dumbass ratie, you post only propaganda bases on any non validated and non verified science. AKA nonsense.
This is also non validated and non verified science. It proves no connection demonstrating CO2 is in any way related to measurements of model mathematical masturbation of two equations and 500 guessed constants solutions.
As an applied physicist of invisible large and small forces it is obvious to me the Satellite measurements are the most realistic global temperature measurement. Their sample area is millions of times larger than surface measurements.
CMIP5 Model Atmospheric Warming 1979-2018: Some Comparisons to Observations December 12th, 2019
I keep getting asked about our charts comparing the CMIP5 models to observations, old versions of which are still circulating, so it could be I have not been proactive enough at providing updates to those. Since I presented some charts at the Heartland conference in D.C. in July summarizing the latest results we had as of that time, I thought I would reproduce those here.
The following comparisons are for the lower tropospheric (LT) temperature product, with separate results for global and tropical (20N-20S). I also provide trend ranking “bar plots” so you can get a better idea of how the warming trends all quantitatively compare to one another (and since it is the trends that, arguably, matter the most when discussing “global warming”).
From what I understand, the new CMIP6 models are exhibiting even more warming than the CMIP5 models, so it sounds like when we have sufficient model comparisons to produce CMIP6 plots, the discrepancies seen below will be increasing.
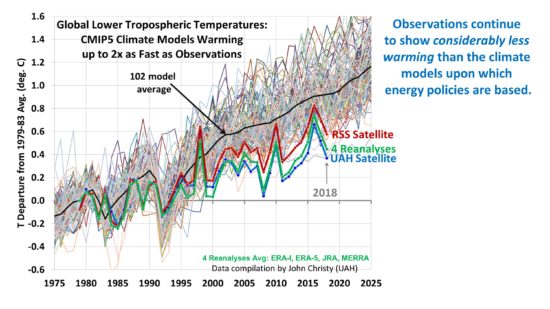
Global Comparisons
First is the plot of global LT anomaly time series, where I have averaged 4 reanalysis datasets together, but kept the RSS and UAH versions of the satellite-only datasets separate. (Click on images to get full-resolution versions).
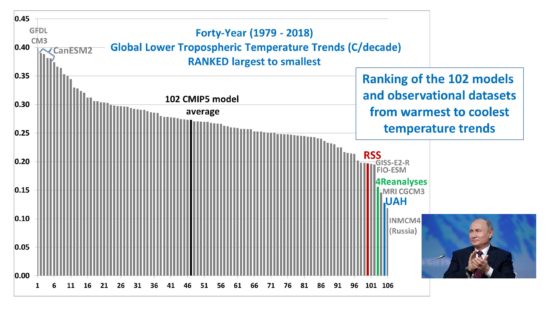
 The ranking of the trends in that figure shows that only the Russian model has a lower trend than UAH, with the average of the 4 reanalysis datasets not far behind. I categorically deny any Russian involvement in the resulting agreement between the UAH trend and the Russian model trend, no matter what dossier might come to light. The ranking of the trends in that figure shows that only the Russian model has a lower trend than UAH, with the average of the 4 reanalysis datasets not far behind. I categorically deny any Russian involvement in the resulting agreement between the UAH trend and the Russian model trend, no matter what dossier might come to light.
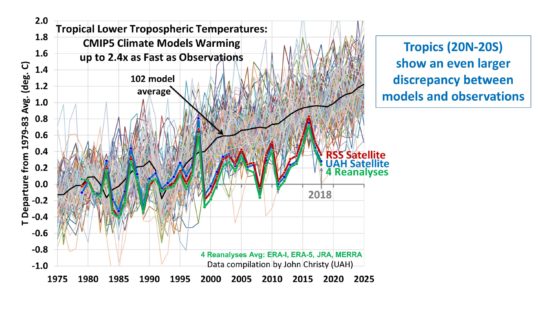
 Tropical Comparisons Tropical Comparisons
Next is the tropical (20N-20S) comparisons, where we now see closer agreement between the UAH and RSS satellite-only datasets, as well as the reanalyses.
....... drroyspencer.com |


