"The focus of the Berkhout manifesto is on climate-related modeling, which it says is “unfit for purpose.” The purpose, in this case, is predicting future climate change."
Following more than a decade of tradition ( at least), I’ve now updated the model-observation comparison page to include observed data through to the end of 2019.
Message 32522276
the rest of them...
Climate model projections compared to observations
Filed under: — group @ 11 April 2017
Since we have been periodically posting updates (e.g. 2009, 2010, 2011, 2012, 2015, 2016) of model output comparisons to observations across a range of variables, we have now set up this page as a permanent placeholder for the most up-to-date comparisons. We include surface temperature projections from 1981, 1988, CMIP3, CMIP5, and satellite products (MSU) from CMIP5, and we will update this on an annual basis, or as new observational products become available. For each comparison, we note the last update date.
Note that Hausfather et al. (2020) made a more complete assessment of previous model projections from 1970 through to CMIP3 ( discussed here).
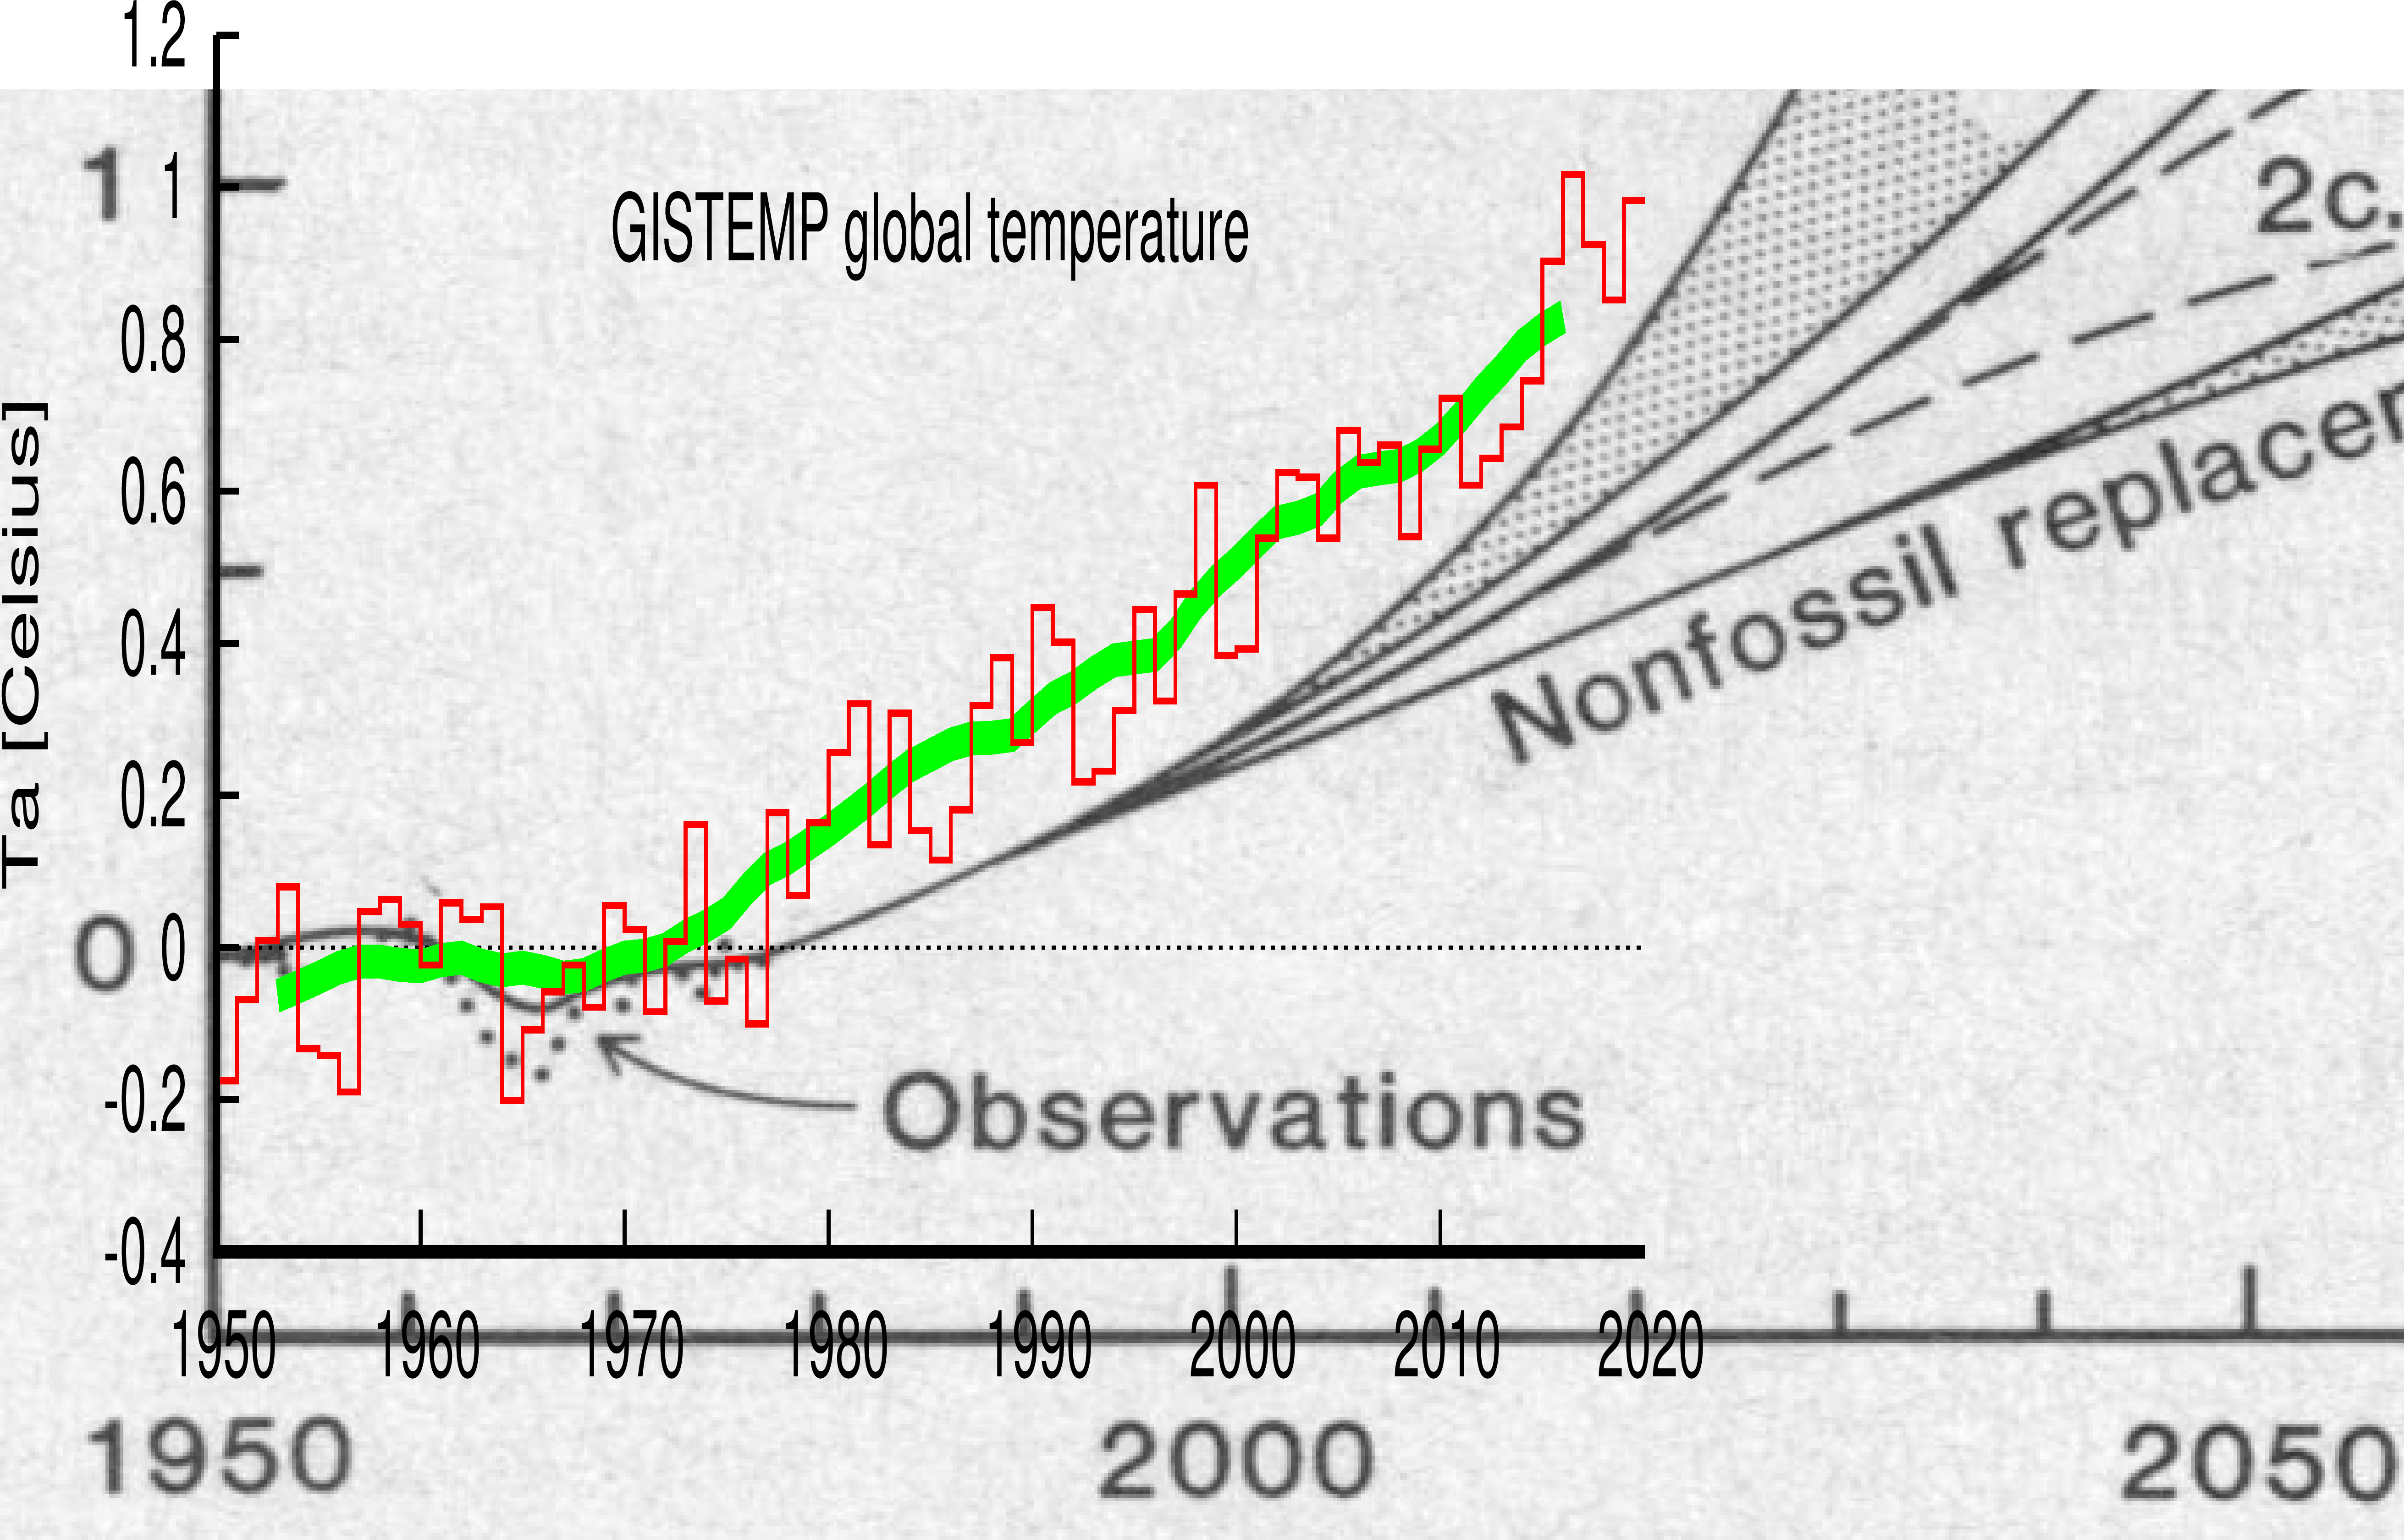
Global mean surface temperature anomaliesHansen et al (1981)

Original discussion (figure courtesy of Geert Jan van Oldenborgh, Hansen et al. (1981)). Observations are the GISTEMP LOTI annual figures and 10 year mean. Last updated: 26 Jan 2020.
Hansen et al (1988)
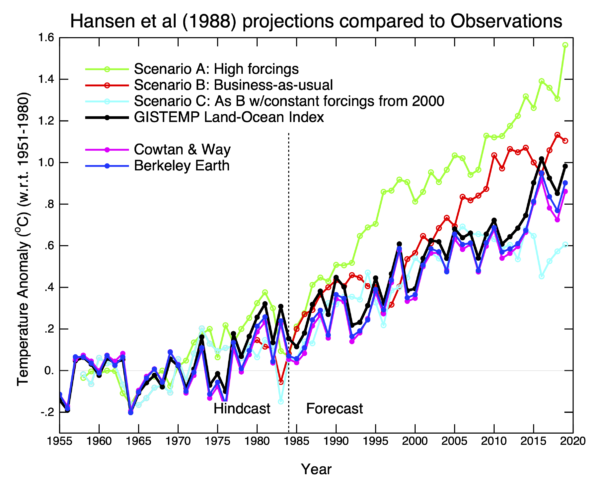
Original discussion (2007), Last discussion (2018). Scenarios from Hansen et al. (1988). Observations are the GISTEMP LOTI annual figures. Trends from 1984: GISTEMP: 0.21ºC/dec, Scenarios A, B, C: 0.33, 0.28, 0.15ºC respectively (all 95% CI ~±0.03). Last updated: 26 Jan 2020.
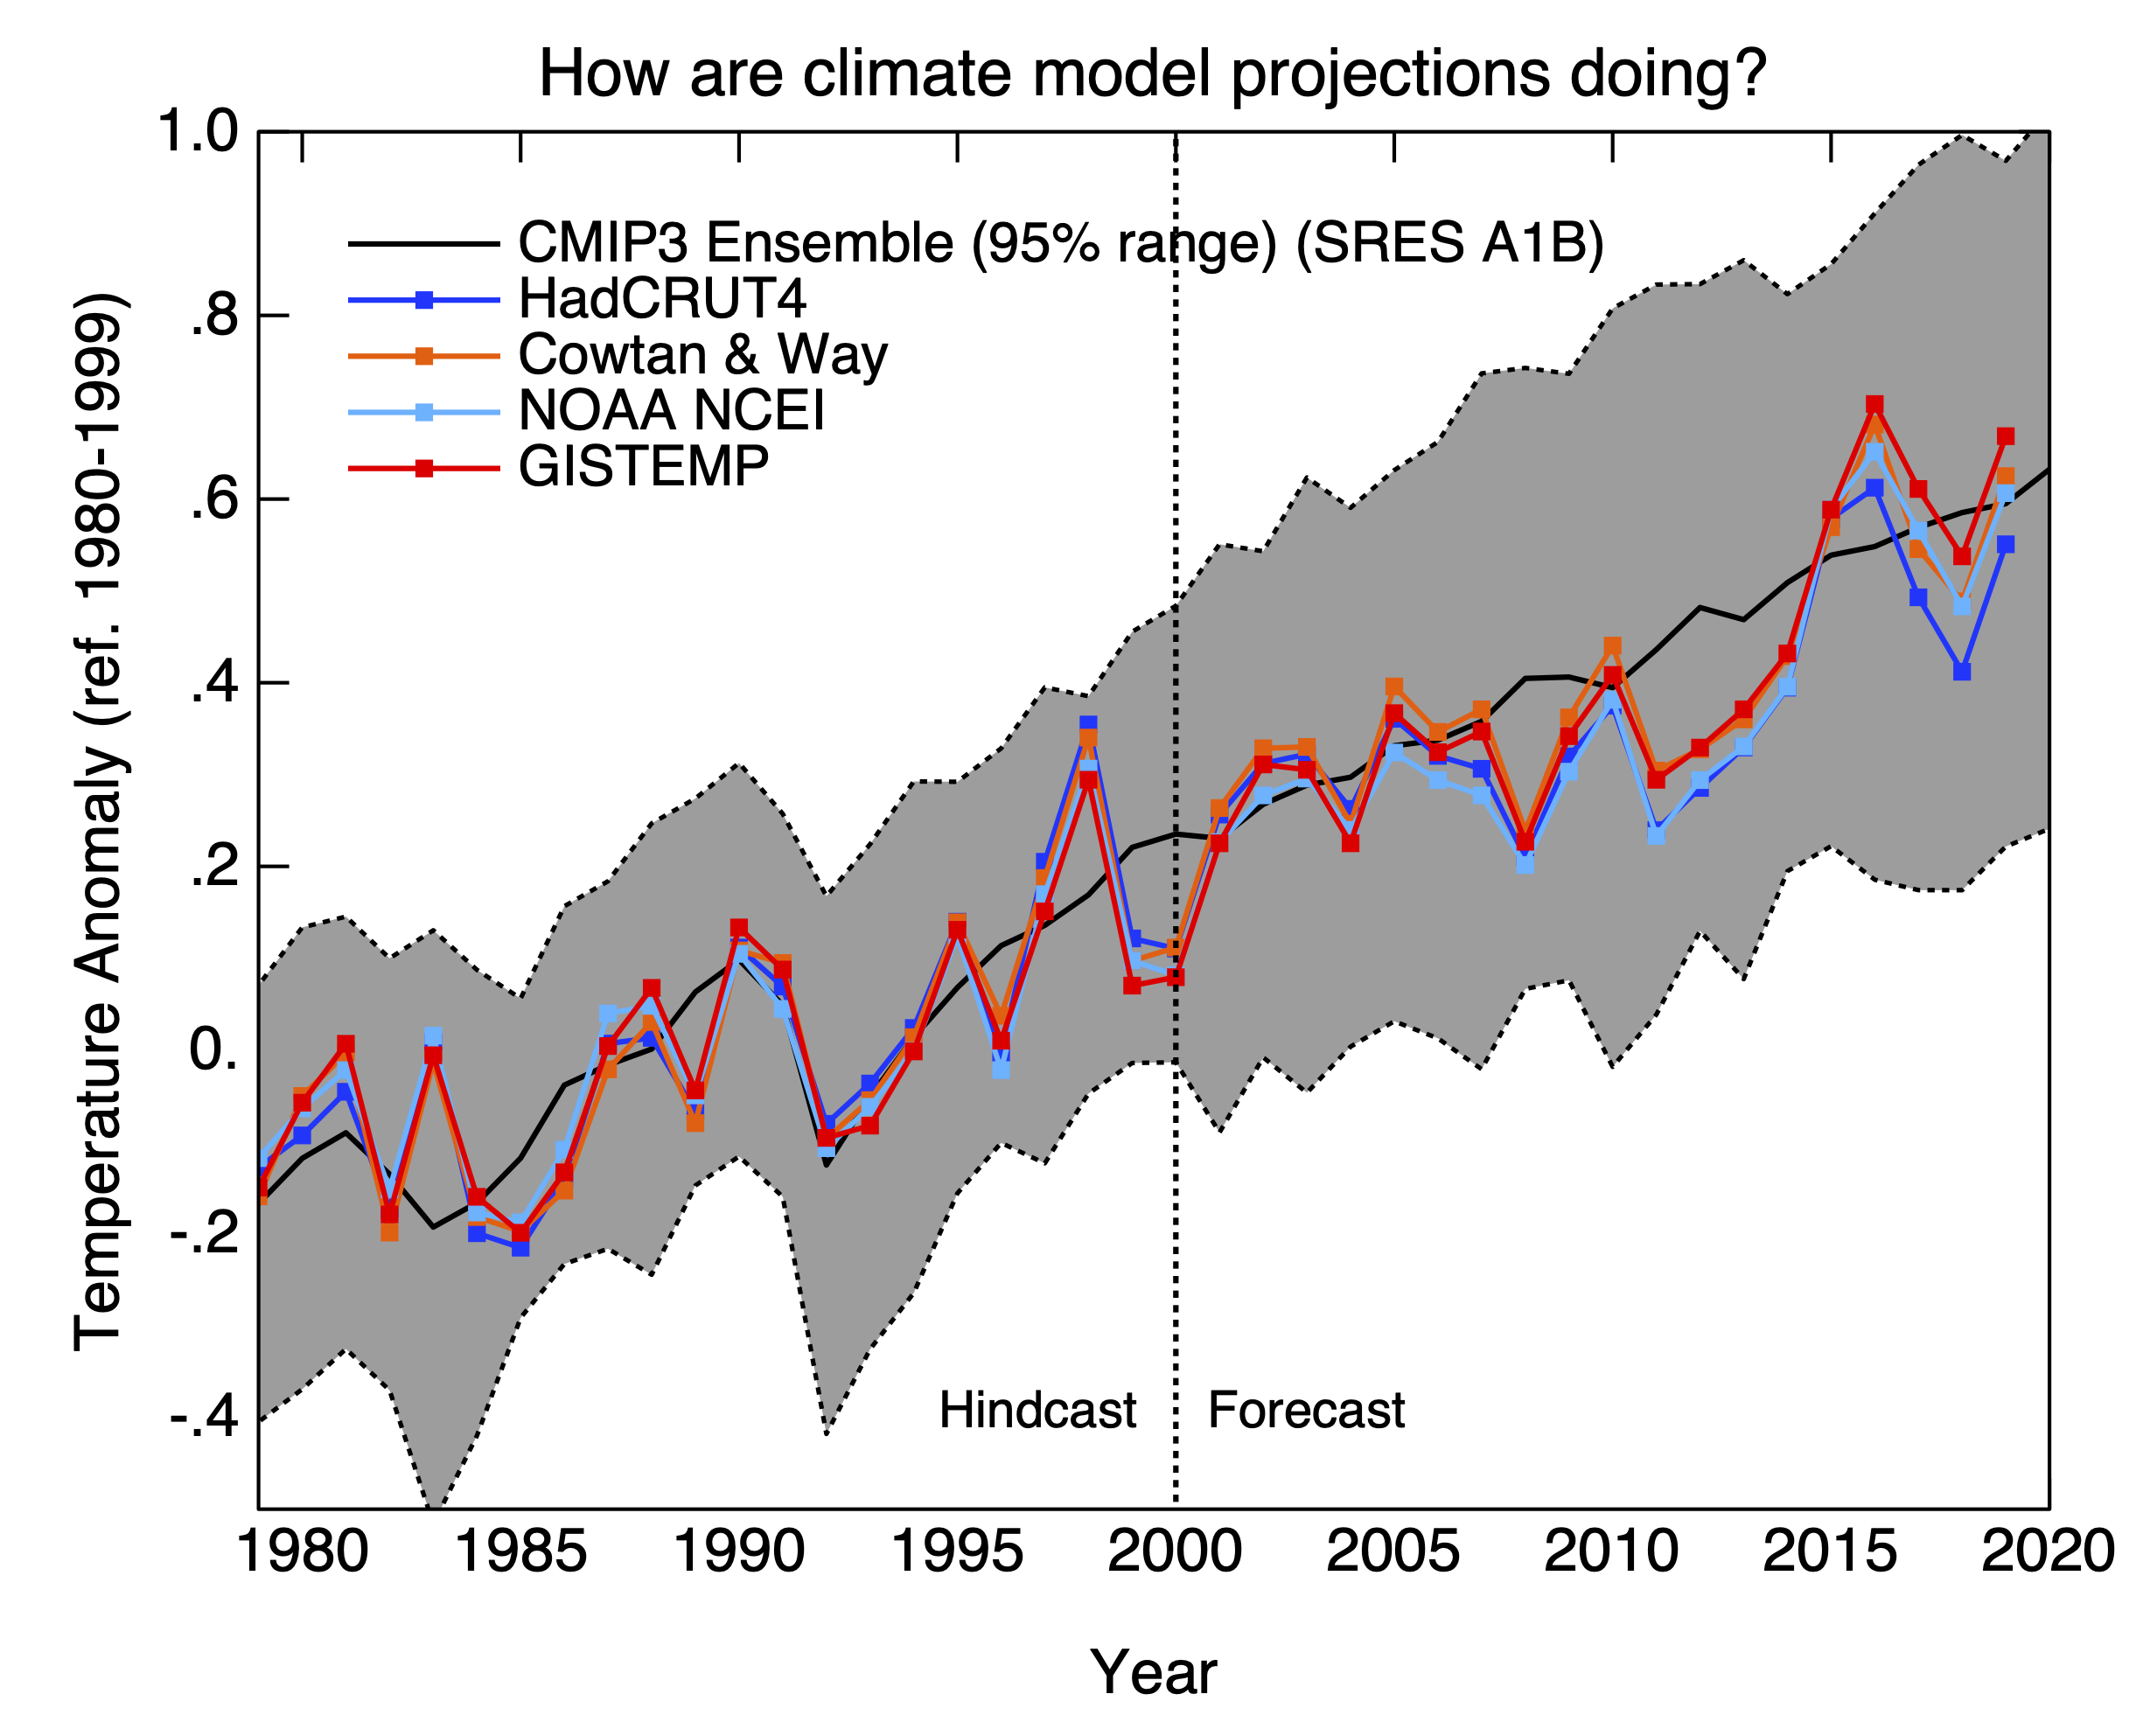
CMIP3 (circa 2004)
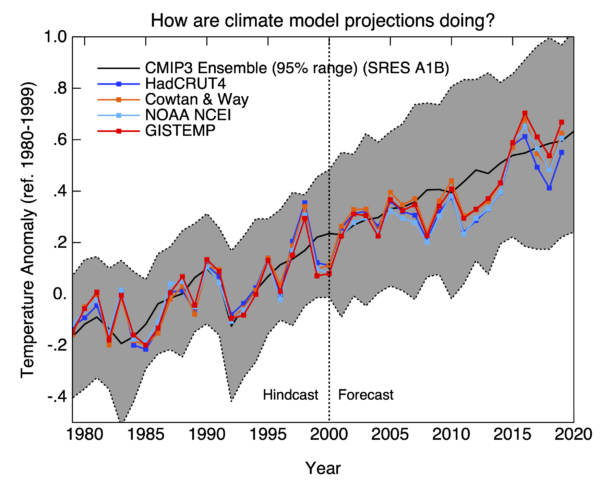
Last discussion (2015). Model spread is the 95% envelope of global mean surface temperature anomalies from all individual CMIP3 simulations (using the SRES A1B projection post-2000). Observations are the standard quasi-global estimates of anomalies with no adjustment for spatial coverage or the use of SST instead of SAT over the open ocean. Last updated 26 Jan 2020.
CMIP5 (circa 2011)
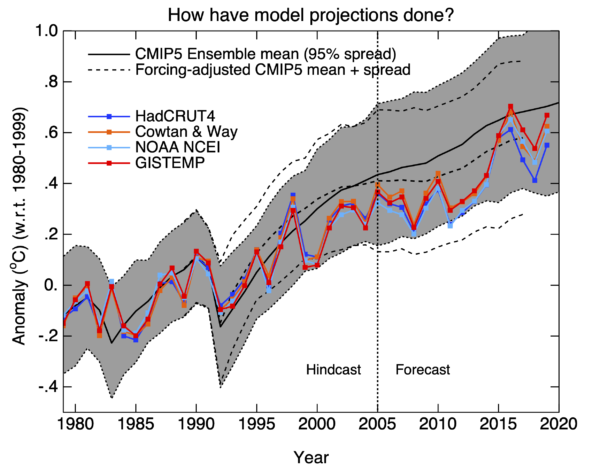
Last discussion (2015). Model spread is the 95% envelope of true global mean surface temperature anomalies from all CMIP5 historical simulations (using the RCP4.5 projection post-2005). Forcing adjustment is updated from Schmidt et al. (2014). Observations are the standard quasi-global estimates of anomalies with no adjustment for spatial coverage or the use of SST instead of SAT over the open ocean. Last updated 26 Jan 2020.
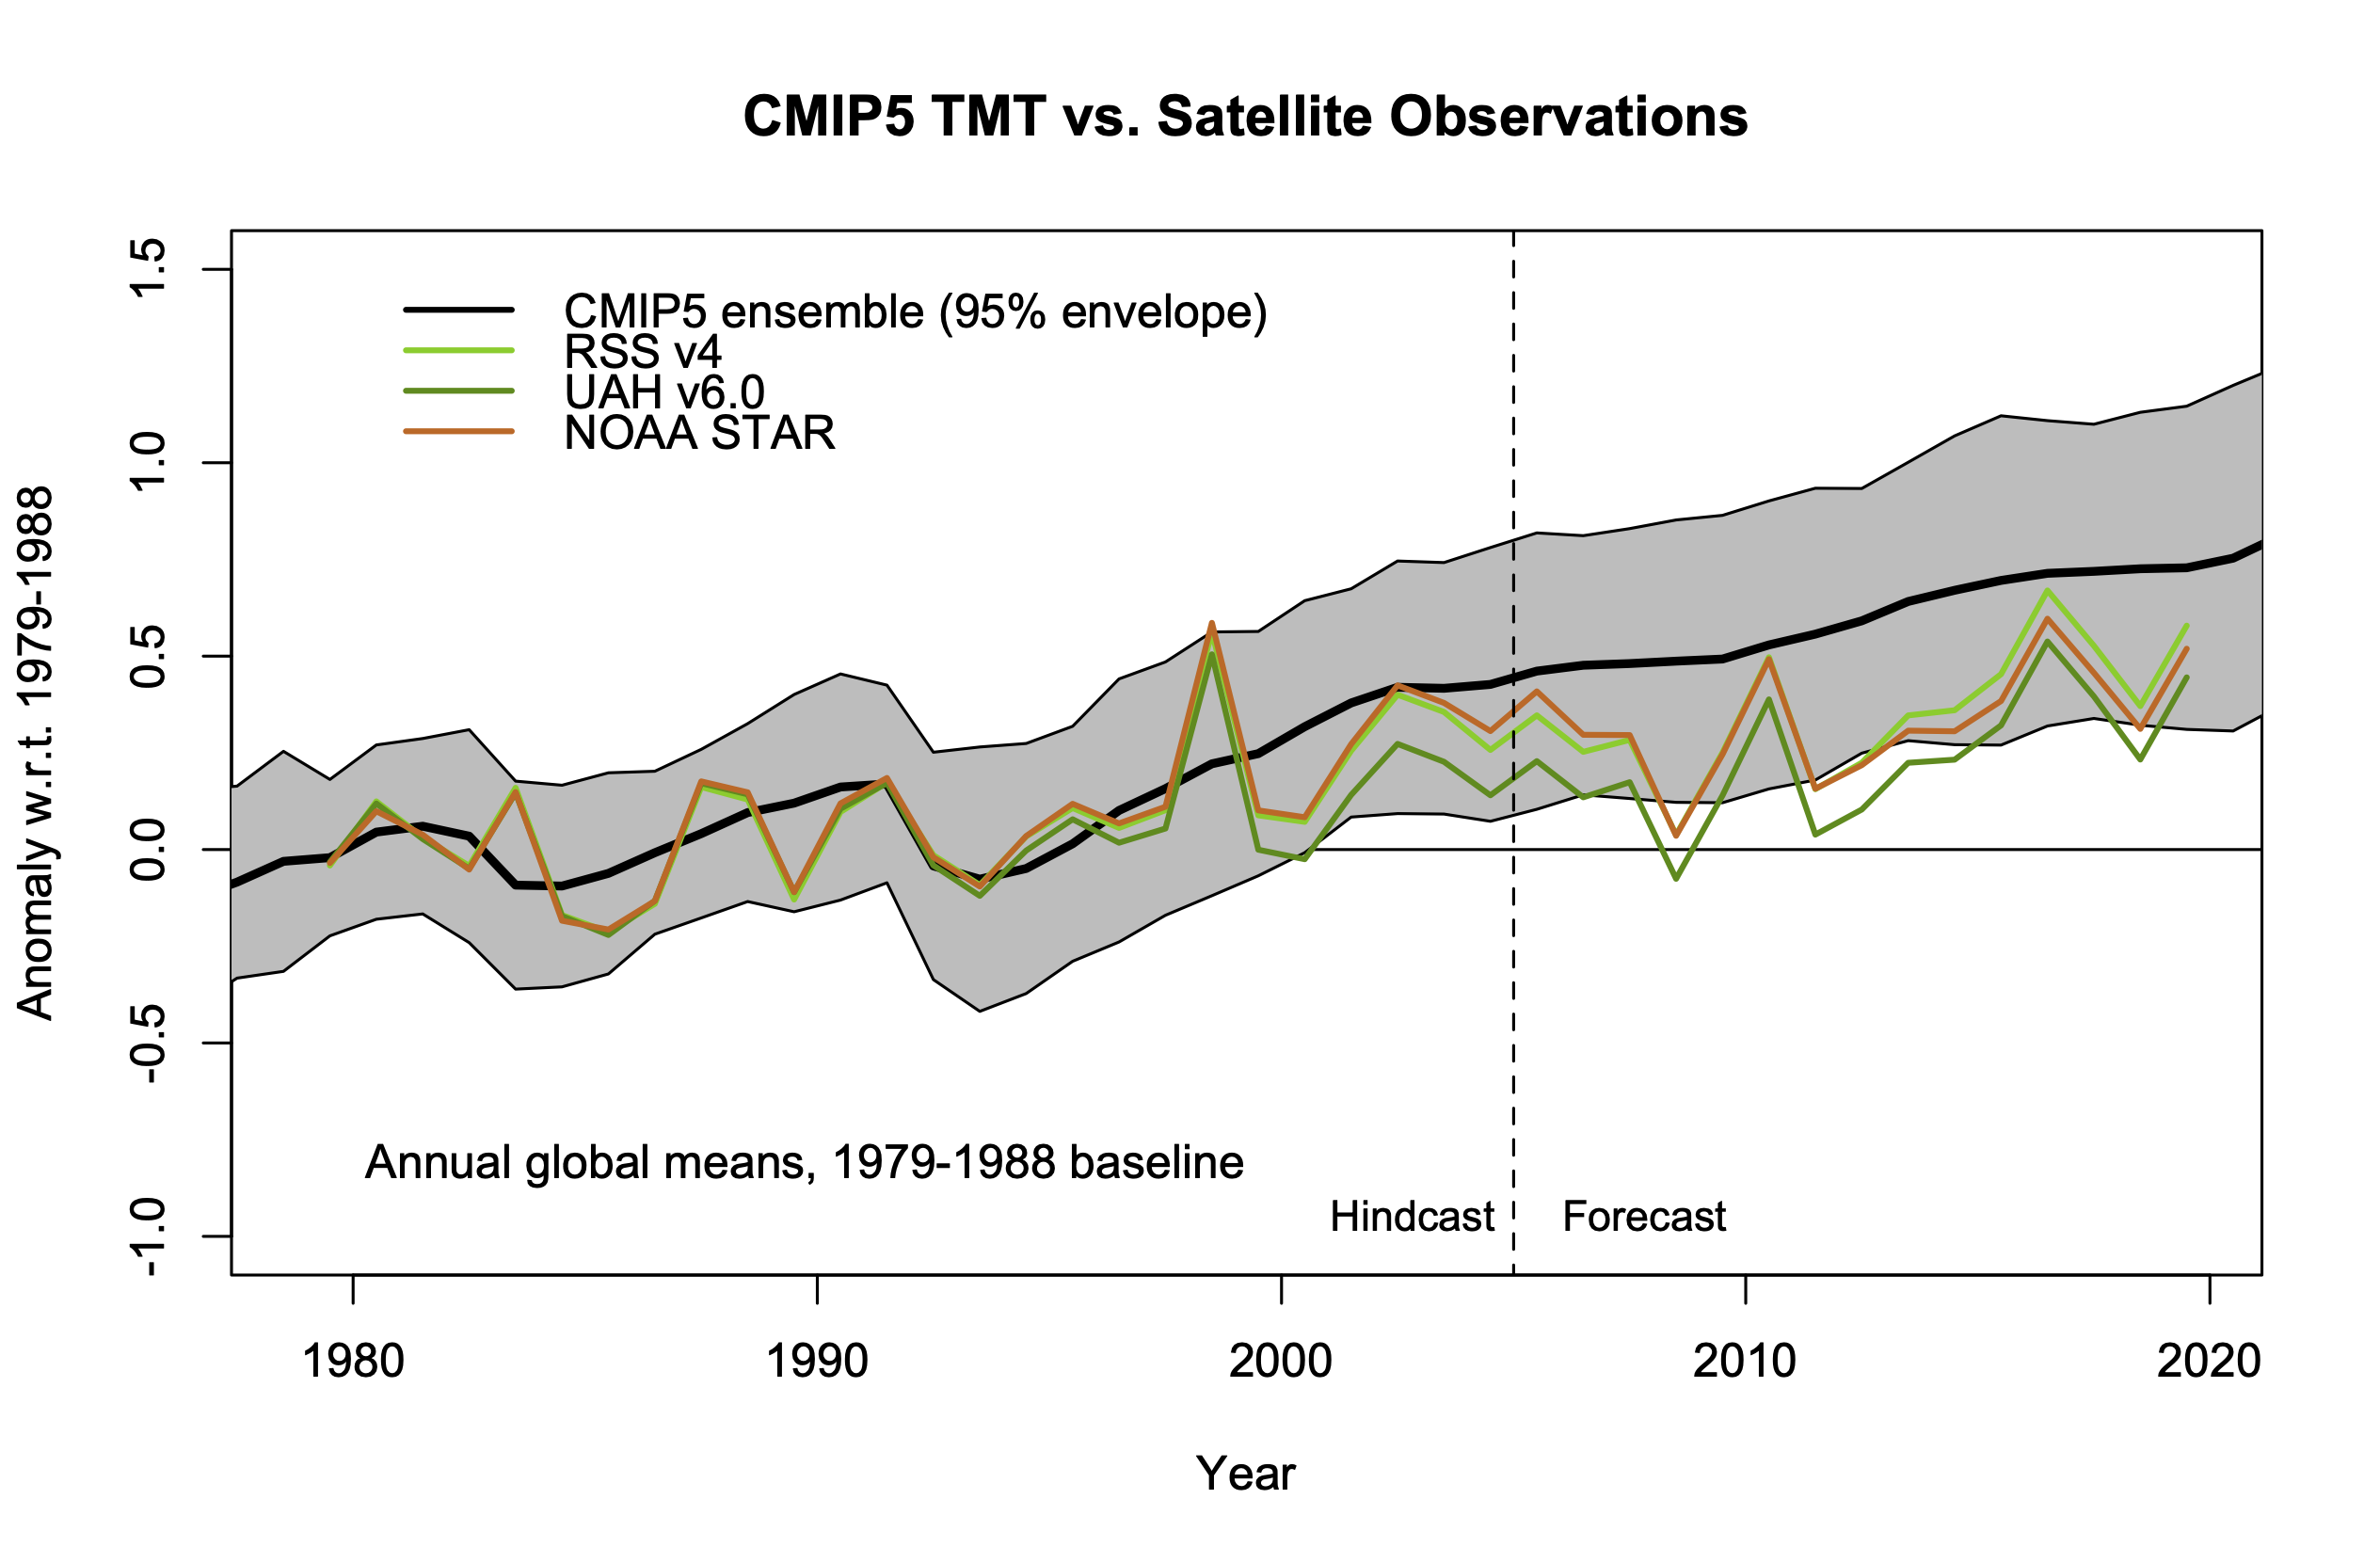
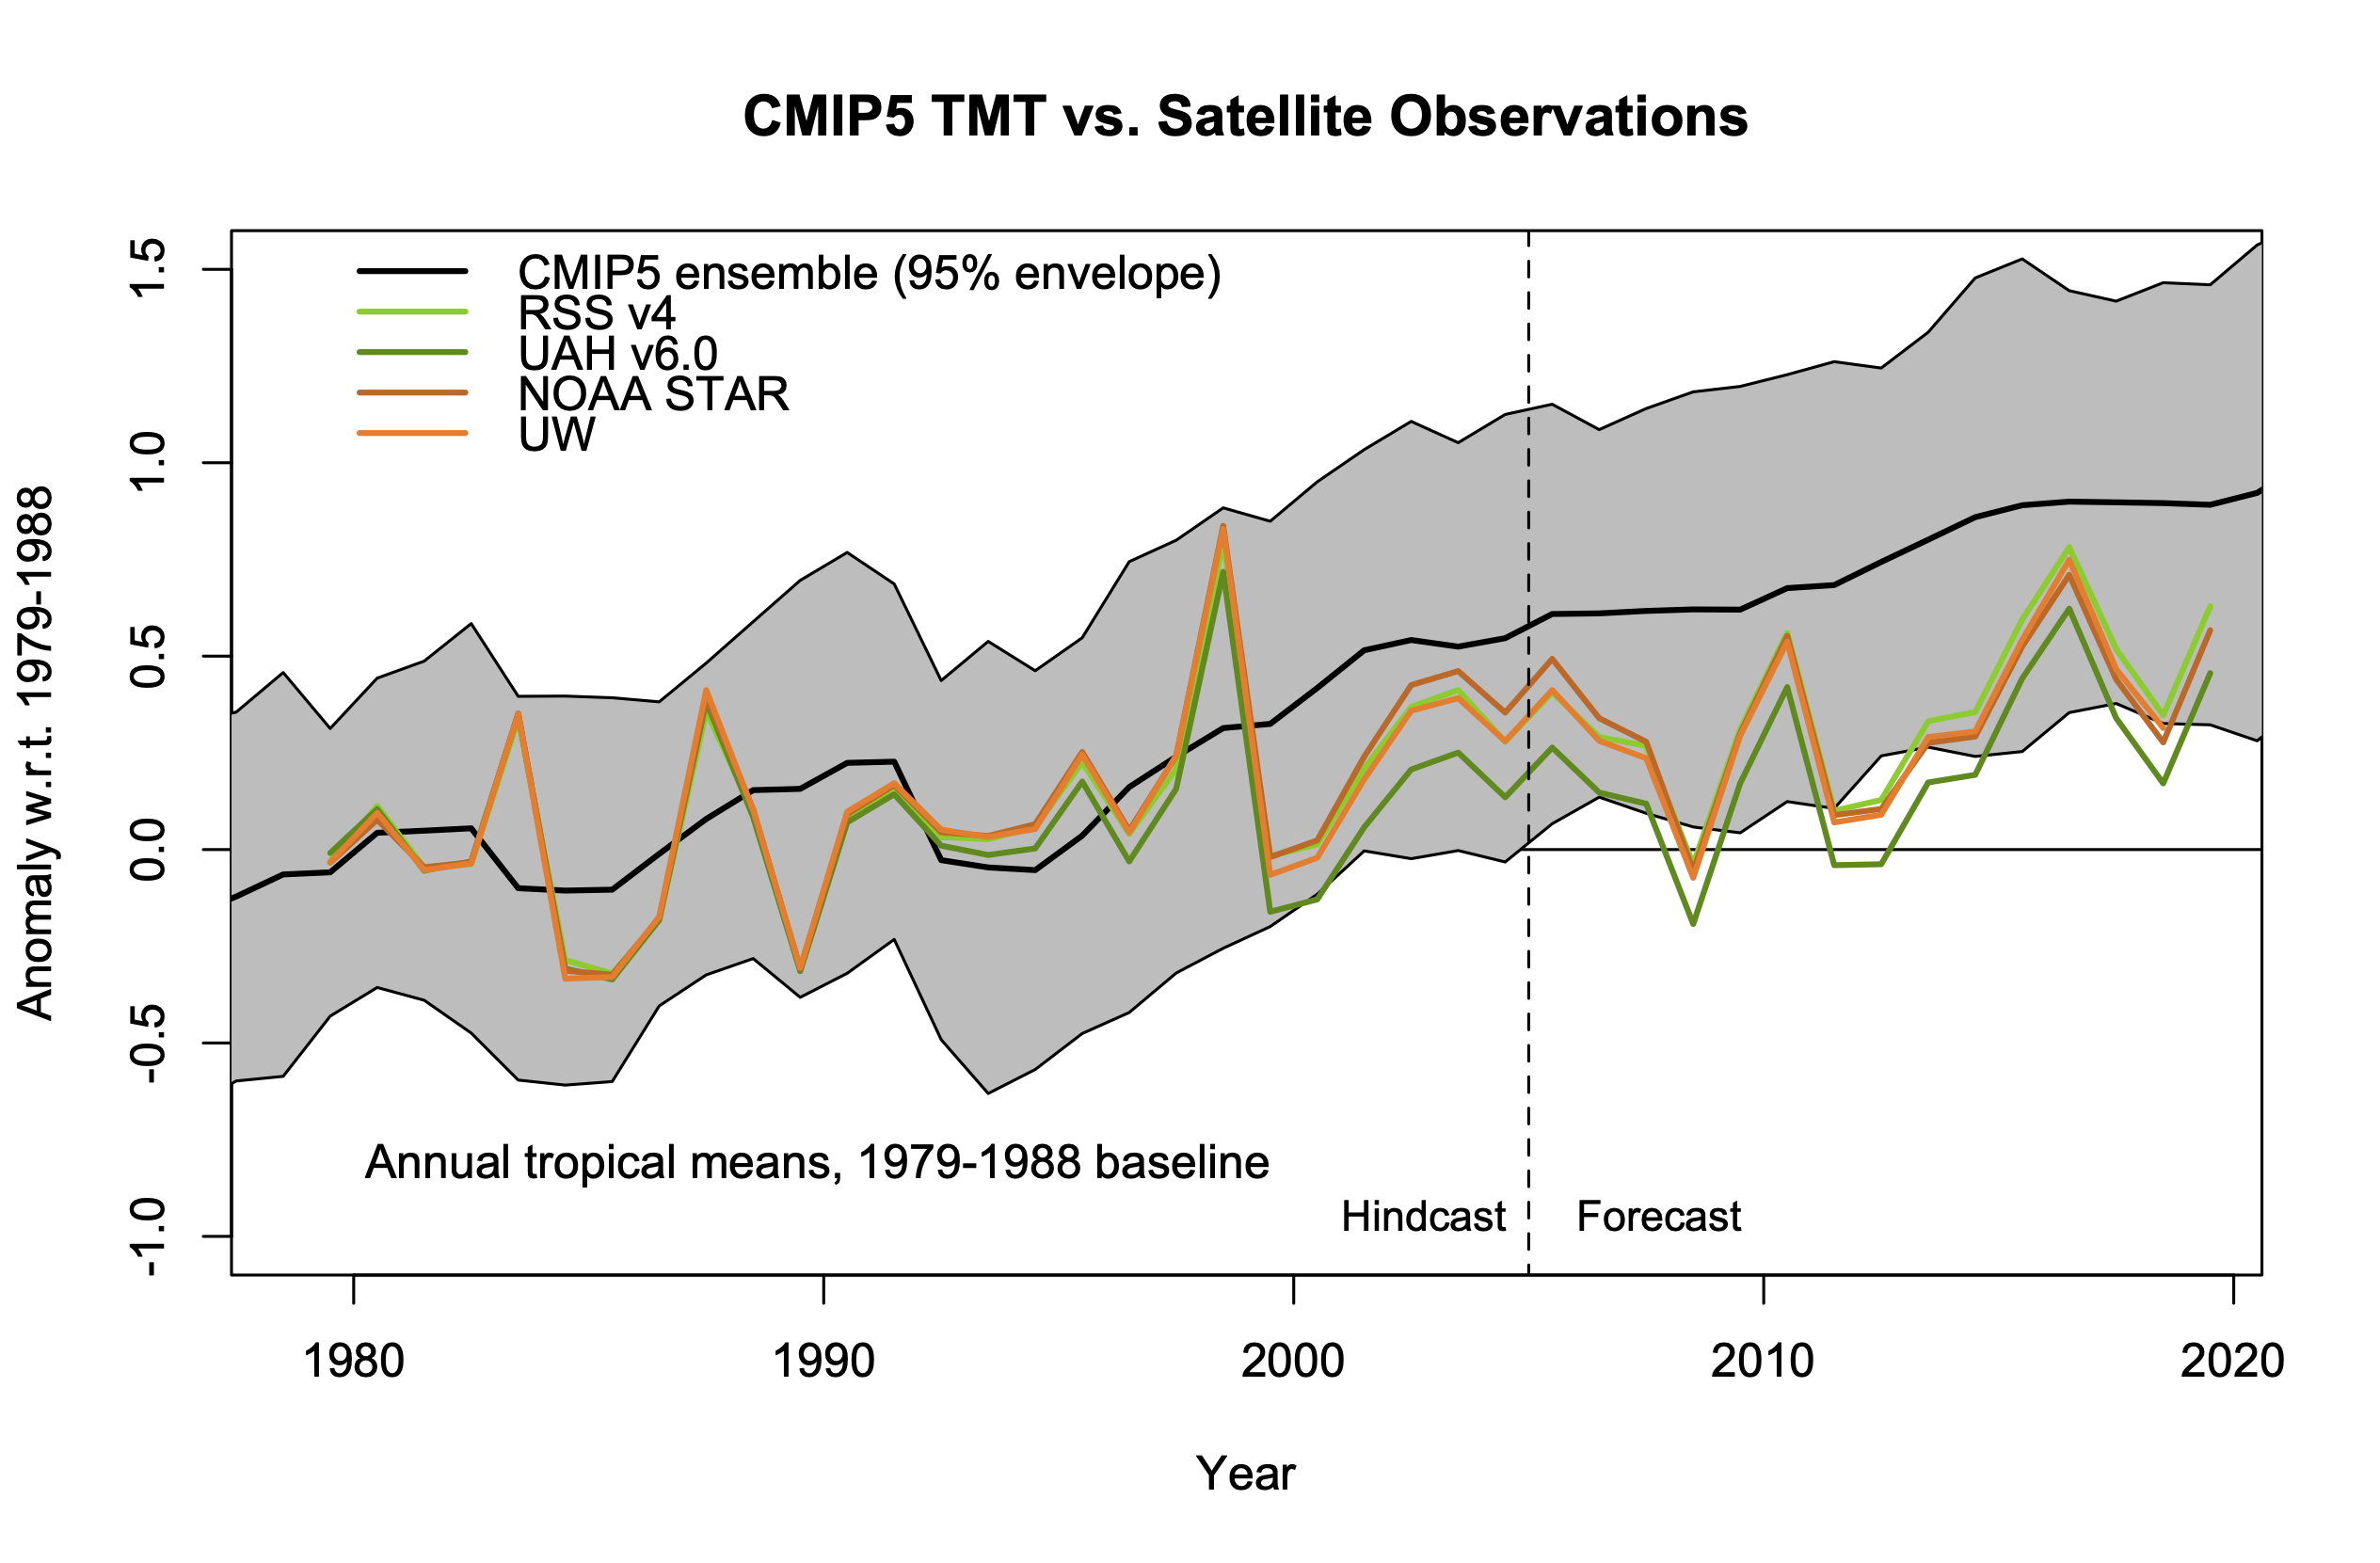
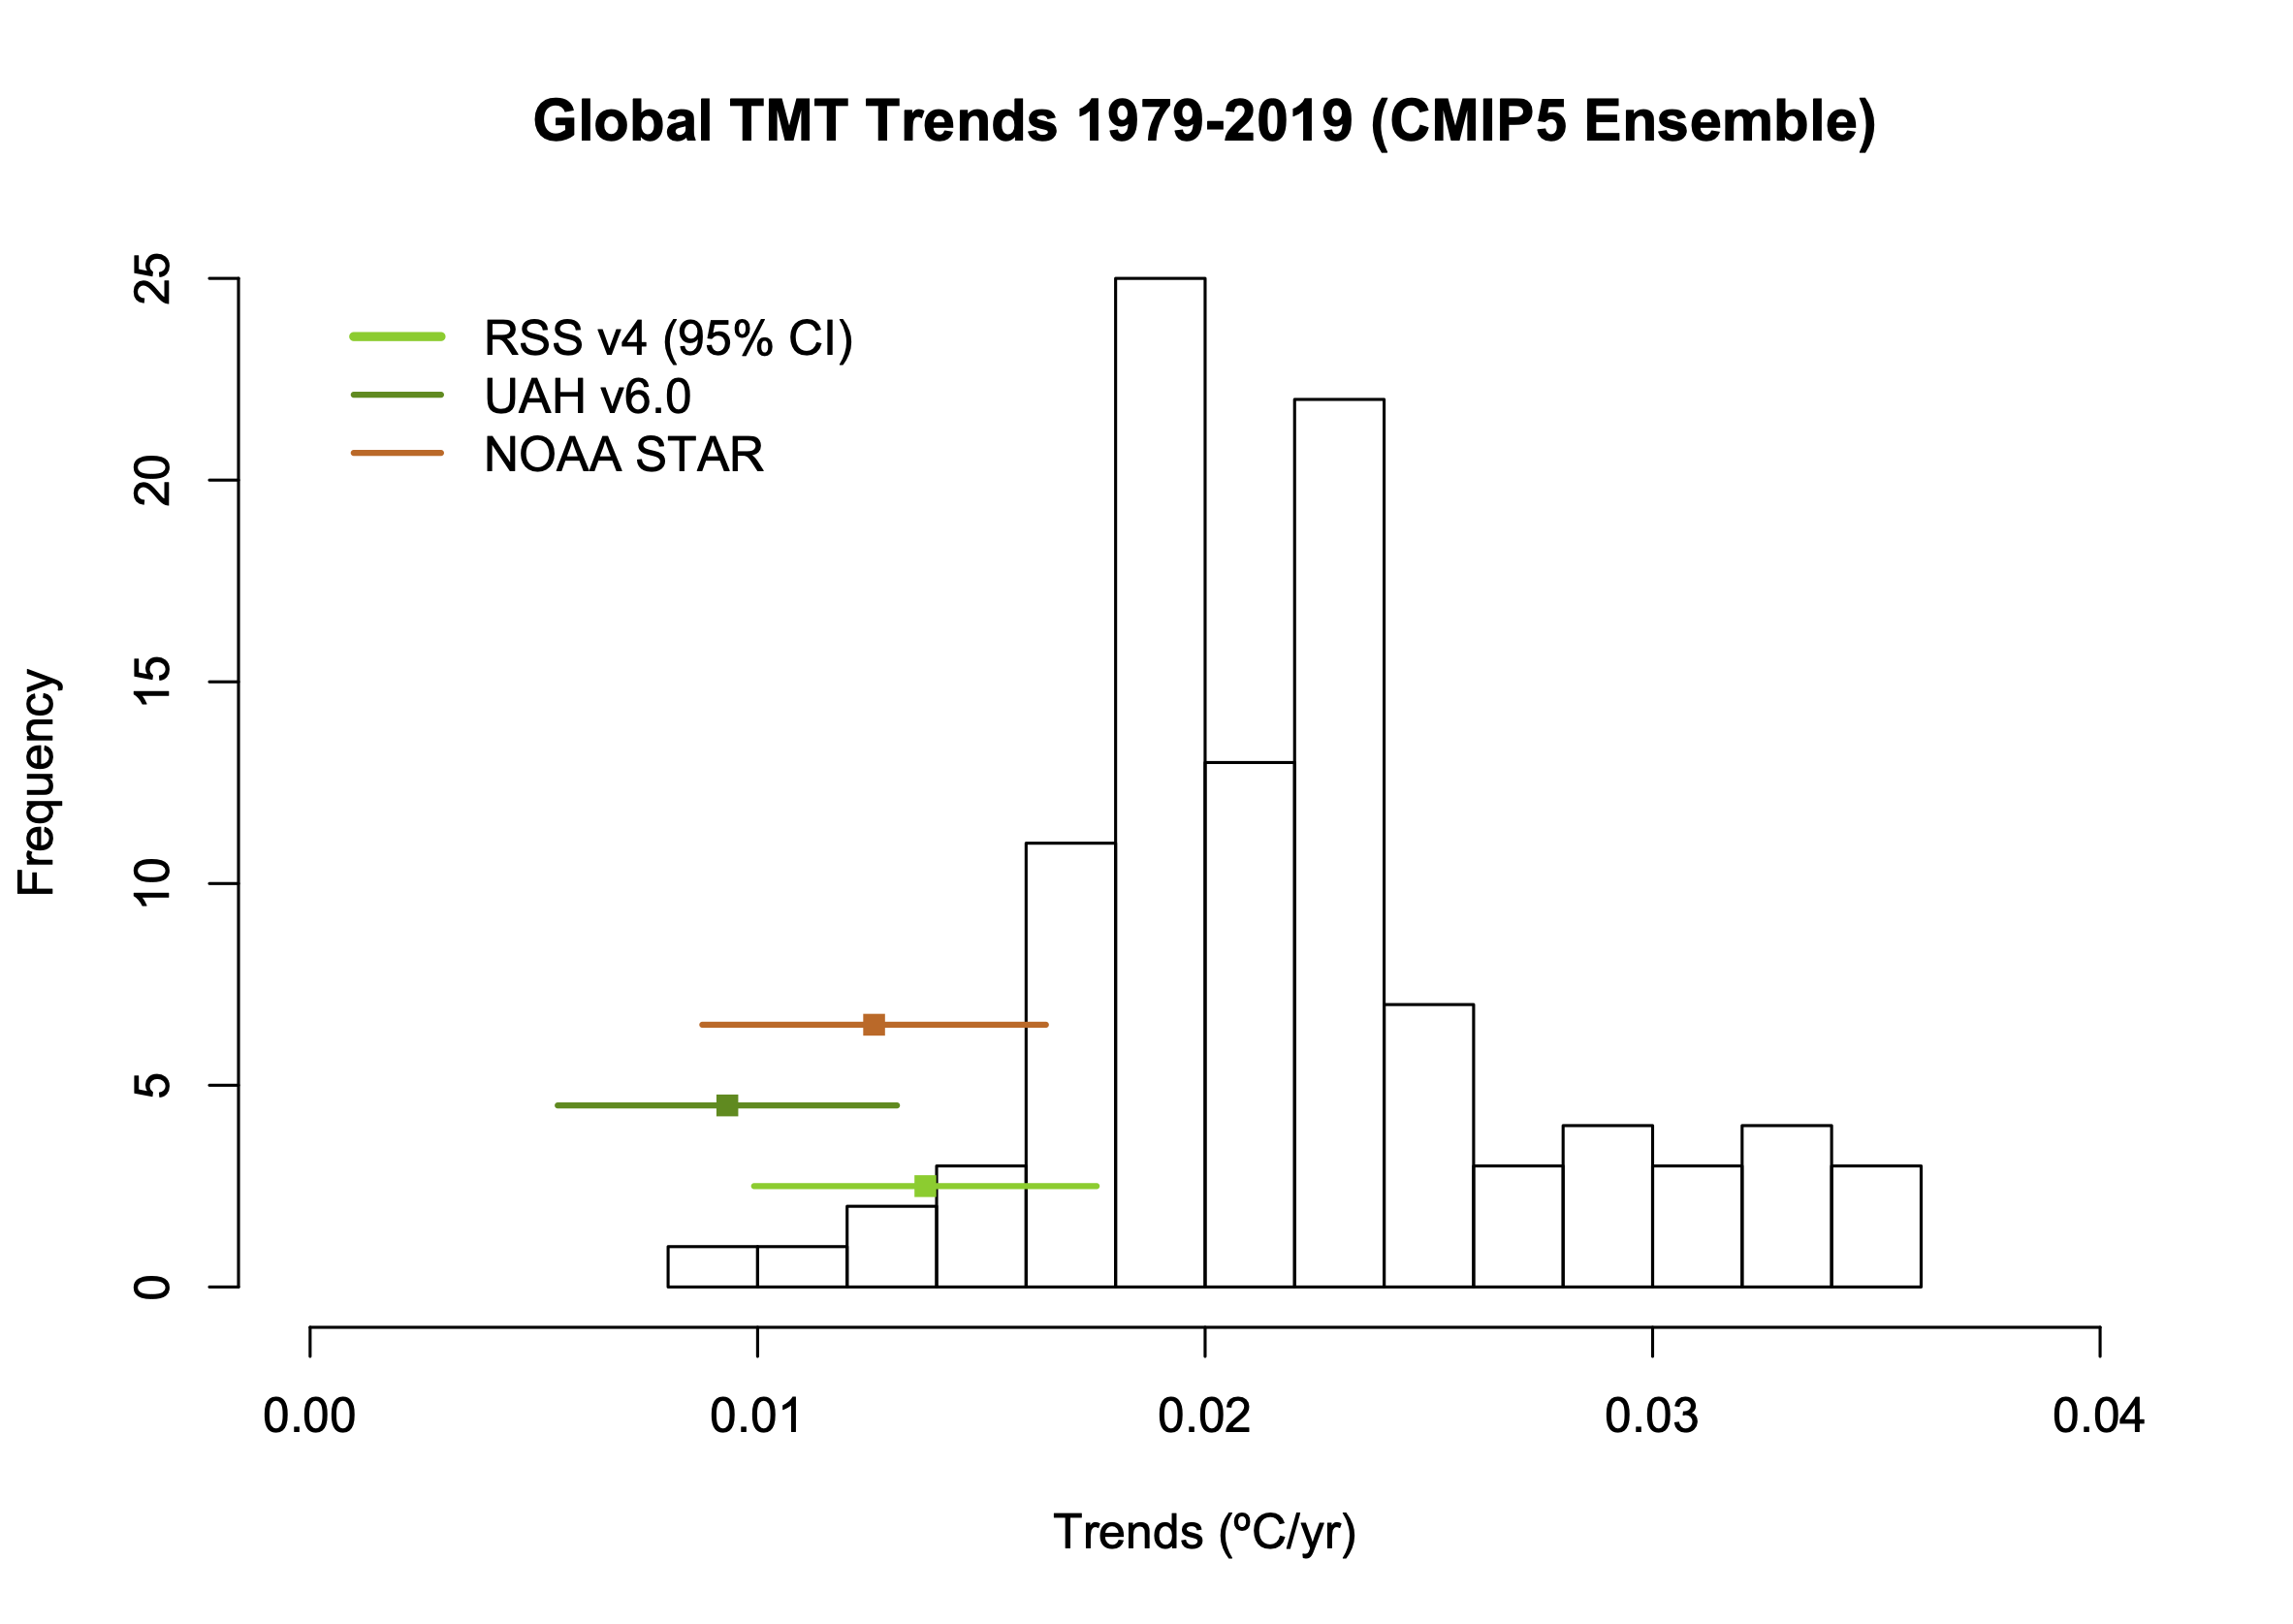
Satellite-derived atmospheric temperaturesMSU-TMT (global and tropical means) (timeseries and trends)
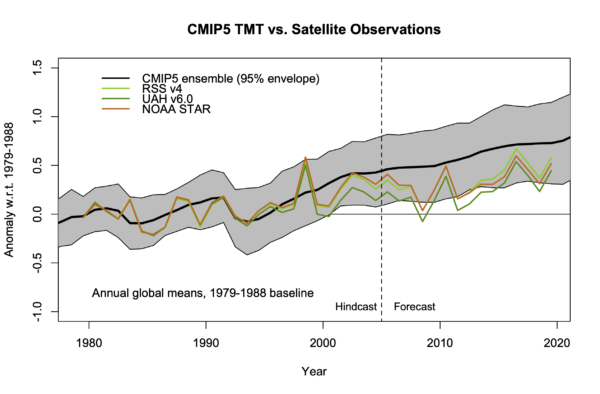 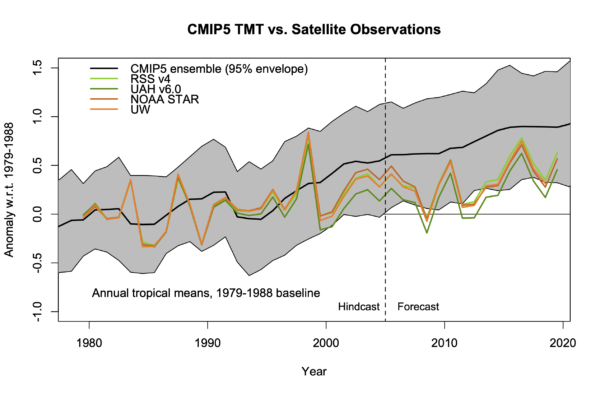 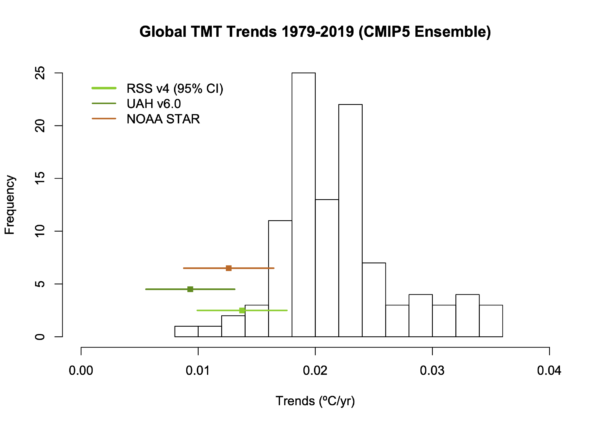 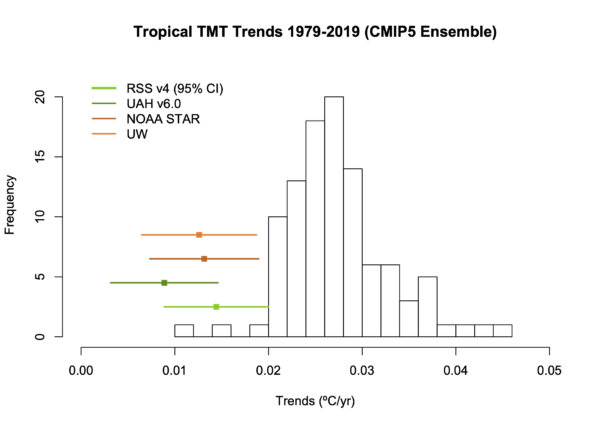
Original discussion (Jan 2017). Mid-troposphere satellite products from UAH, RSS, NOAA STAR and UW. Model values use synthetic MSU-TMT weightings, spread is 95% envelope of simulations. Last updated 26 Jan 2019.
If you have suggestions for additional comparisons, stylistic changes, clarifications etc., please leave a comment here, or on the latest open thread. You can use these figures anywhere (with citation and link back to RealClimate).
realclimate.org |