Gold doing really well. I'm in real estate, low duration bonds, cash, and gold. Preservation of capital has been my game for the last couple of years. I'm continuing to accumulate gold now and working towards a 5% position. YTD, my gold/silver holdings (CEF) have gone up 6.5%. Not bad. Coronavirus is the Black Swan that will shave a few points off of global GDP.
--------
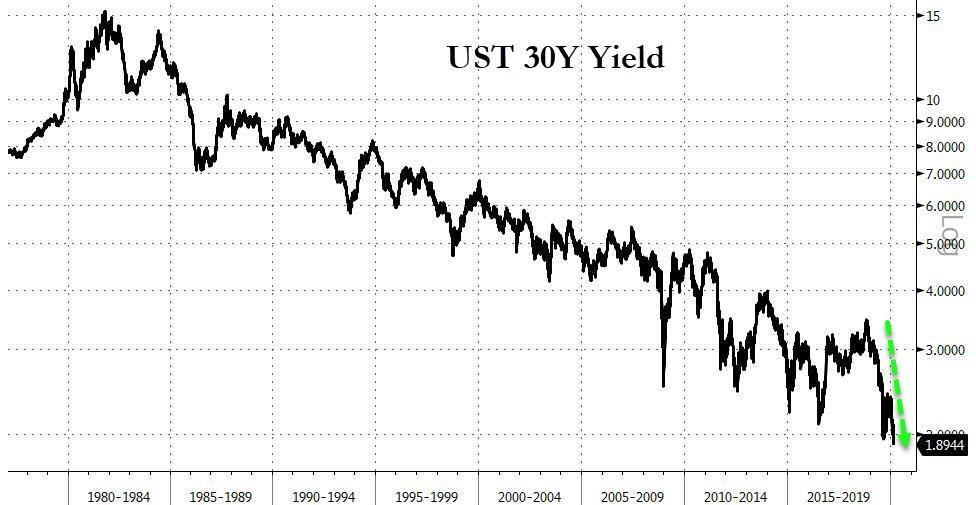
Treasury Yields Plunge To Record Lows As US PMI Collapses Into Contraction
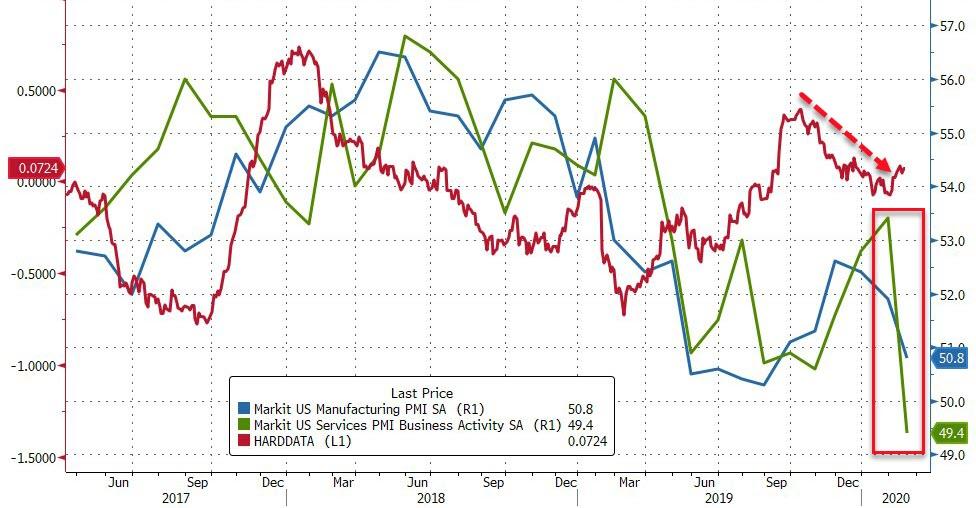
Markit's US Manufacturing bucked the surprising surge in ISM Manufacturing in January and preliminary February data was expected to confirm this slowing trend (with Services steadily expanding).
U.S. Feb. Services Flash PMI 49.4; Est. 53.4
U.S. Feb. Flash Manufacturing PMI 50.8; Est 51.5
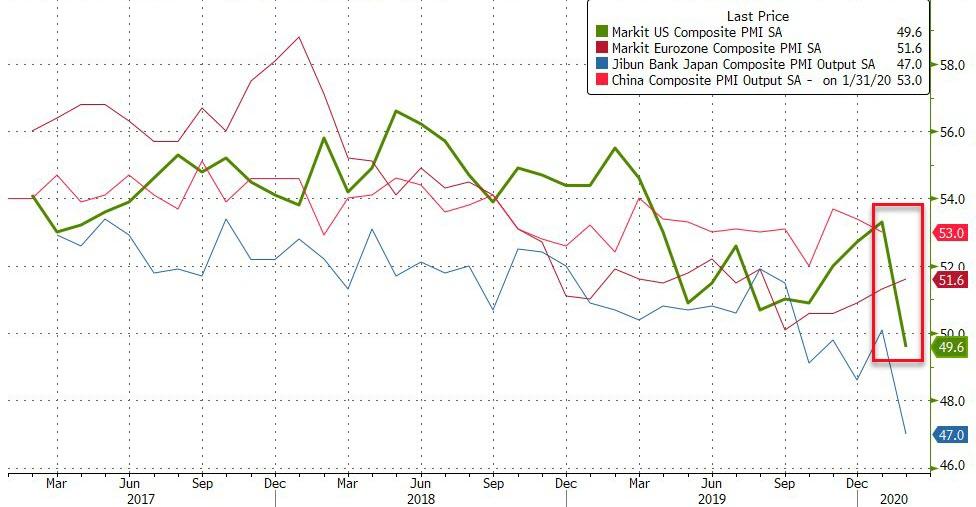
U.S. Feb. Flash Composite PMI 49.6 vs 53.3
And as the chart shows, while 'soft' survey data had been rising, 'hard' data - actual economic flows - has been weakening for 4 months, and February appears to have been catch-down time!

Source: Bloomberg
New orders received by private sector firms fell for the first time since data collection began in October 2009. The fractional decline in new business stemmed from weak client demand across the service sector and the slowest rise in manufacturing new order volumes for nine months. Private sector companies continued to struggle to attract foreign client demand as new export orders fell for the second month running.
Finally, we note that the composite output at factories and service providers fell by 3.7 points to 49.6, the lowest level since October 2013, when the U.S. government shut down.

- “The deterioration in was in part linked to the coronavirus outbreak, manifesting itself in weakened demand across sectors such as travel and tourism, as well as via falling exports and supply chain disruptions,” IHS Markit economist Chris Williamson said in a statement.
- “With the exception of the government-shutdown of 2013, US business activity contracted for the first time since the global financial crisis in February. Weakness was primarily seen in the service sector, where the first drop in activity for four years was reported, but manufacturing production also ground almost to a halt due to a near-stalling of orders.
- “Total new orders fell for the first time in over a decade. The deterioration in was in part linked to the coronavirus outbreak, manifesting itself in weakened demand across sectors such as travel and tourism, as well as via falling exports and supply chain disruptions. However, companies also reported increased caution in respect to spending due to worries about a wider economic slowdown and uncertainty
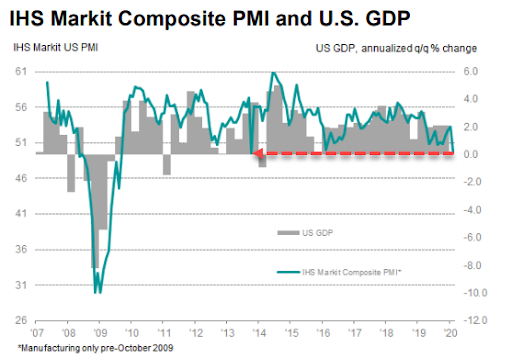
The last time PMI crashed here, GDP went negative in Q1 2014 (-1.1%)...

And it could have been dramatically worse because, there's one big glaring global error in all PMIs going forward. As @ClausVistesen exposes under the surface of Germany's surprisingly solid PMI data.
- The composite PMI in Germany fell trivially to 51.1 in February. from 51.2 in January, above the consensus, 50.7.
- The coronavirus effect is nowhere to be seen in these data...
- There is a catch, though. Markit notes that half of the increase in the manufacturing PMI was attributed slower delivery times.
- Normally, such evidence of supply-side tightening is bullish—signalling accelerated activity — but respondents specifically noted that this was related to disruptions in China due to the coronavirus. Specifically:
- "The 'flash' seasonally adjusted Suppliers' Delivery Times Index was at 47.0 in February. down from 55.1 in January. A reading below 50 signals deterioration in supplier delivery times. In the calculation of the headline Manufacturing PM!. the supplier delivery times index is inverted."
- In other words, the PMIs appear to be designed so as to import a supply-chain disruption from the coronavirus as a bullish signal. Needless to say: it isn't! With that in mind, it's difficult to interpret the evidence of further easing in the rate of contraction and new orders as a good sign. The main risk is that production lines simply grind to a halt, even as new orders keep coming due to disruptions of the supply side.
- ...It's ridiculous. Not exactly economists' finest hours here, building up to the PMIs as if they were the litmus test for all this, and now we can just put them in the bin because of the supply-tightening/headline up effect.
- Basically, we need to watch supply-side factors/input price inflation now. The problem is that we have even worse real-time data here than on the demand side.
And just like that - we now know all PMIs for the next few months are utterly useless (and in fact misleading - not necessarily by intent) due to this is inversion of supply chain crises into a bullish signal.
All of which has sent the 30-year US Treasury yield to an all-time record low of 1.89%...

...with stocks less than 1% off record highs!? |


