Re <<Do the obvious, take your profits when you can because this is unusual. Reap and retreat. Too much trading complexity increases risk>>
Ordinarily I would be doing exactly that, as if I need to rapidly pee before catching the next segment of a video I cannot pause.
This time, as this is wet-work time, must refrain from nuanced delicacy until the beast stops wiggling.
In the meantime, a few words from H
On 26 Feb 2020, at 7:07 AM, H wrote:
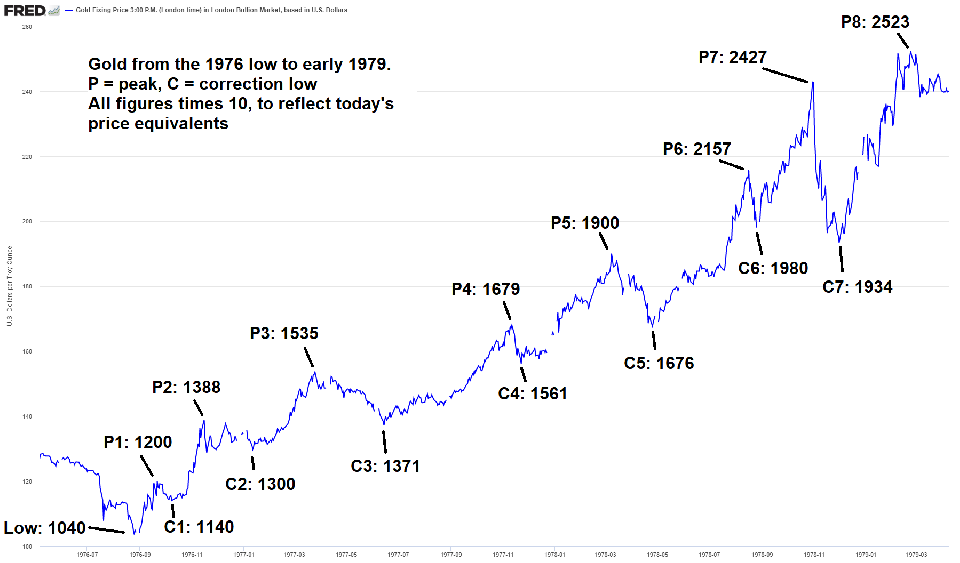
I have hedged gold positions with DUST calls. The 70s template suggests a pullback to the 1560 to 1600 region before the next leg up to $1900 (incidentally $1890 and $2300 are fibonacci-derived targets of the current gold run). See the progression "P4" - "C4" - "P5" on the chart.
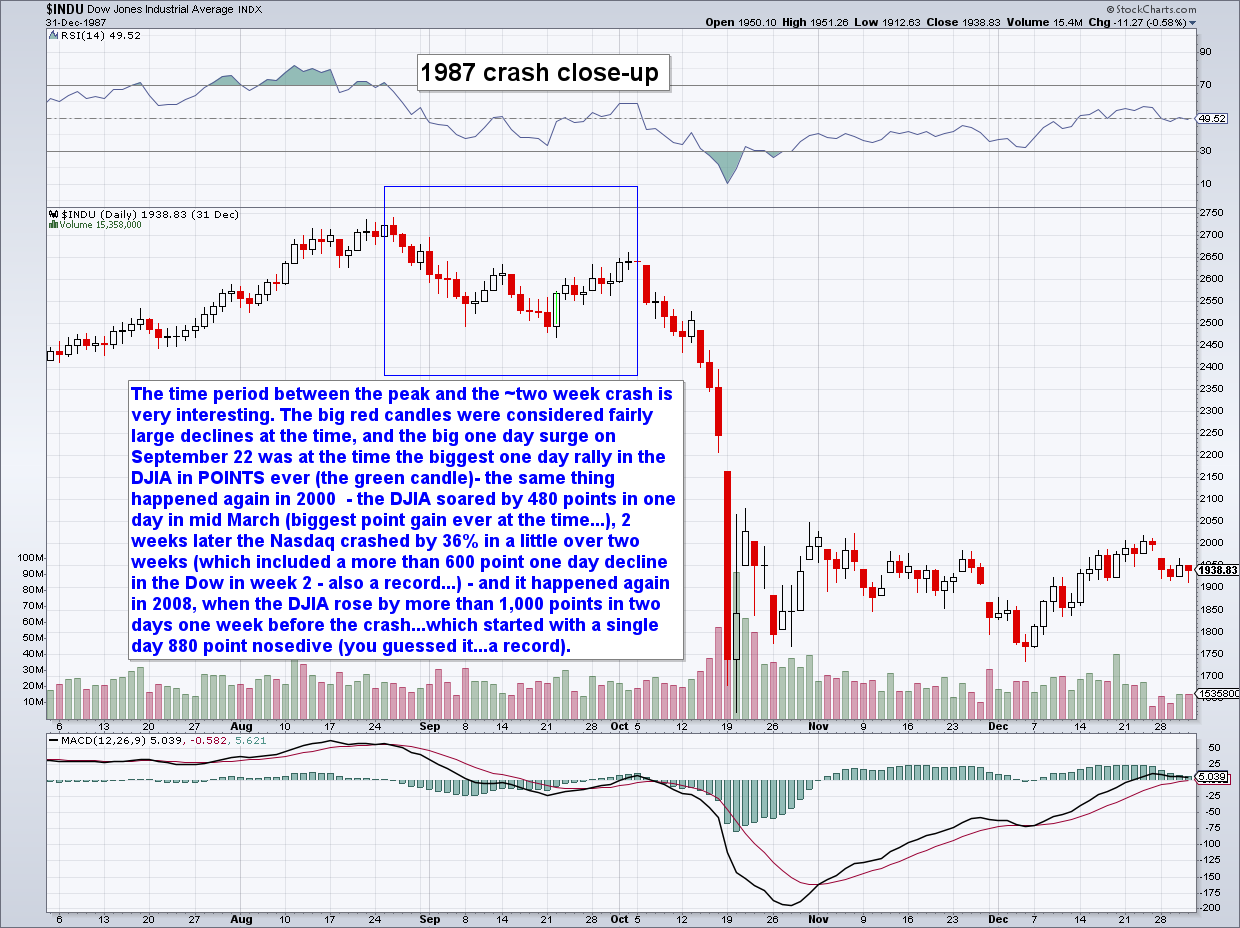
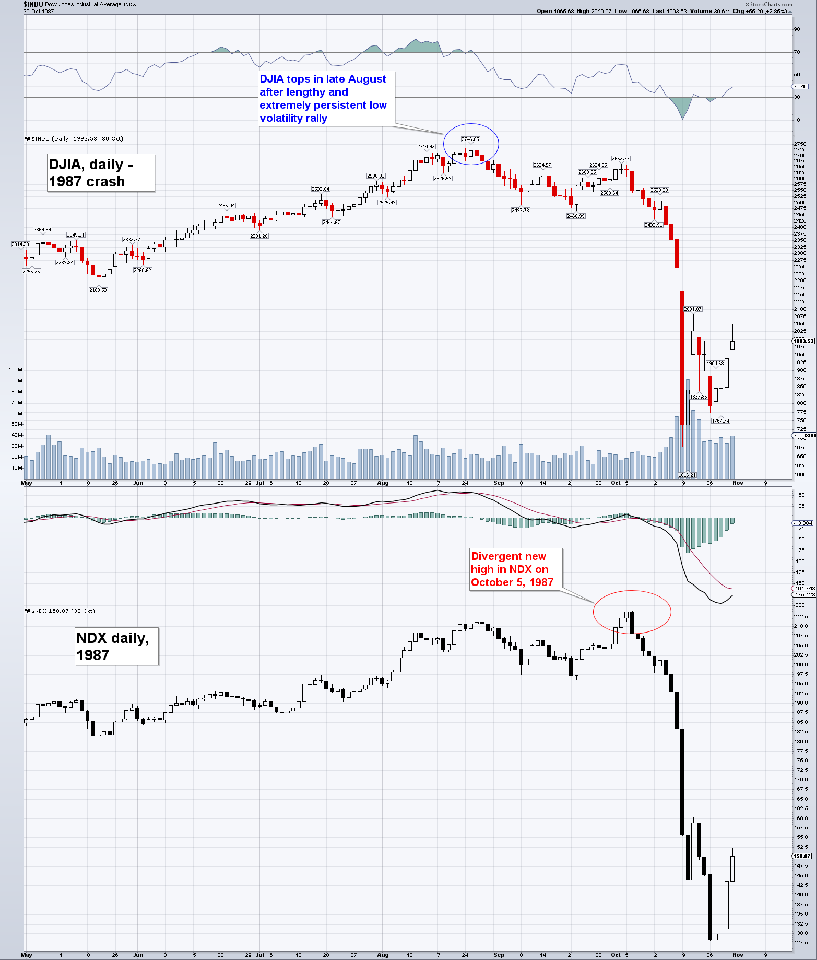
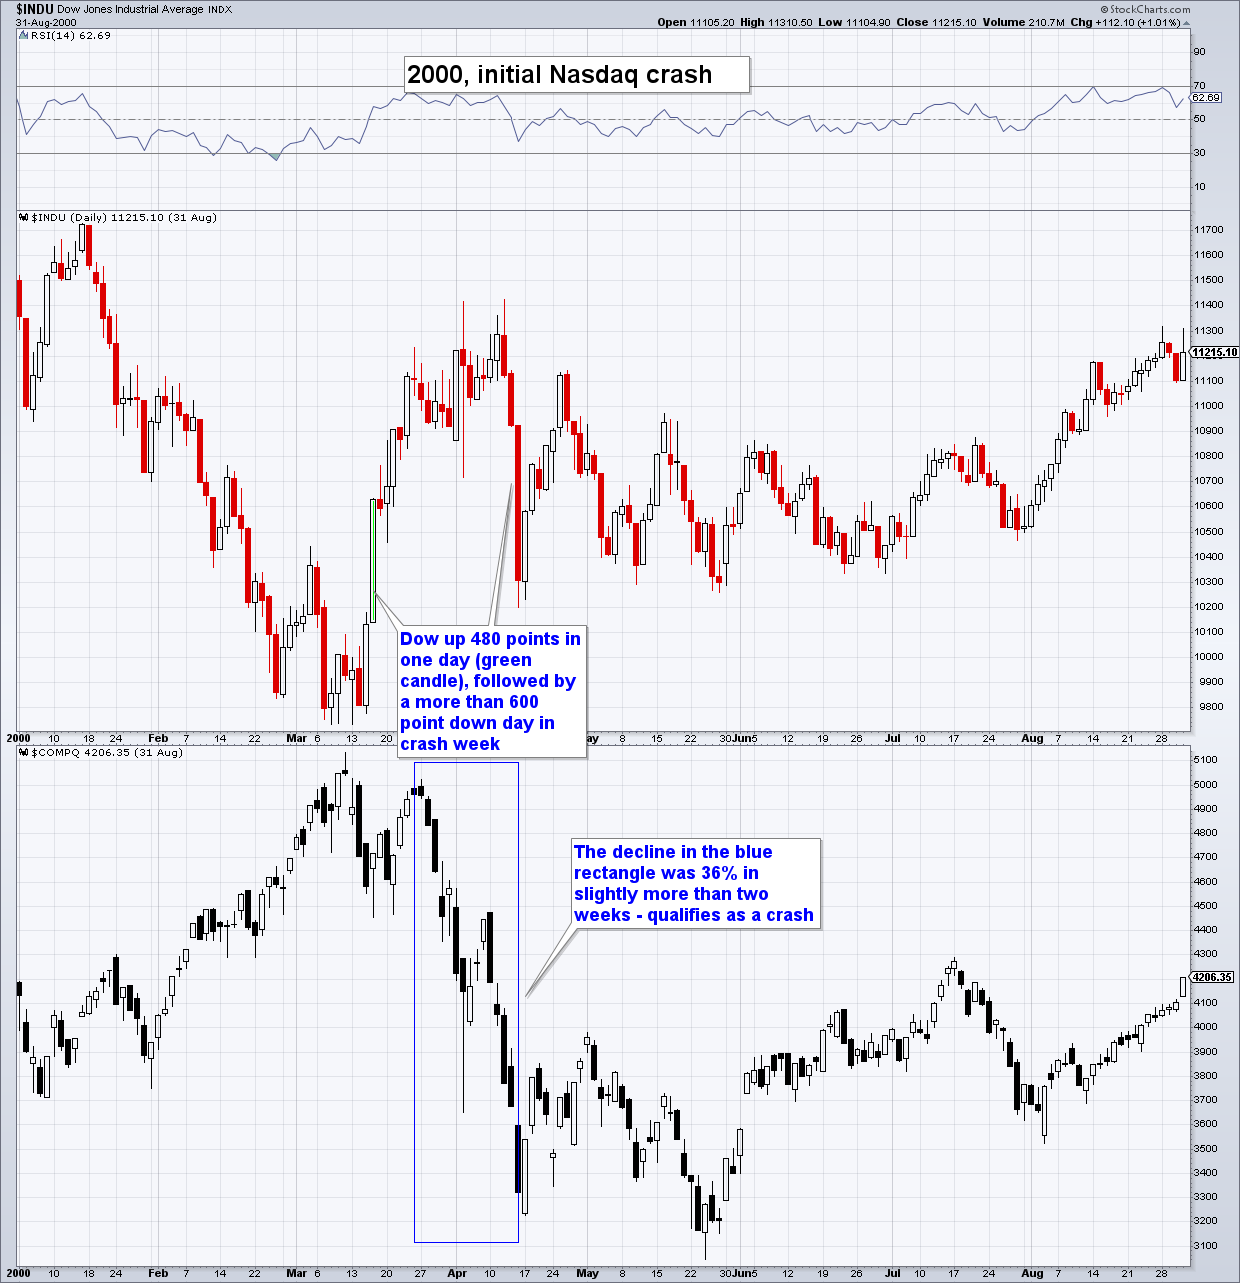
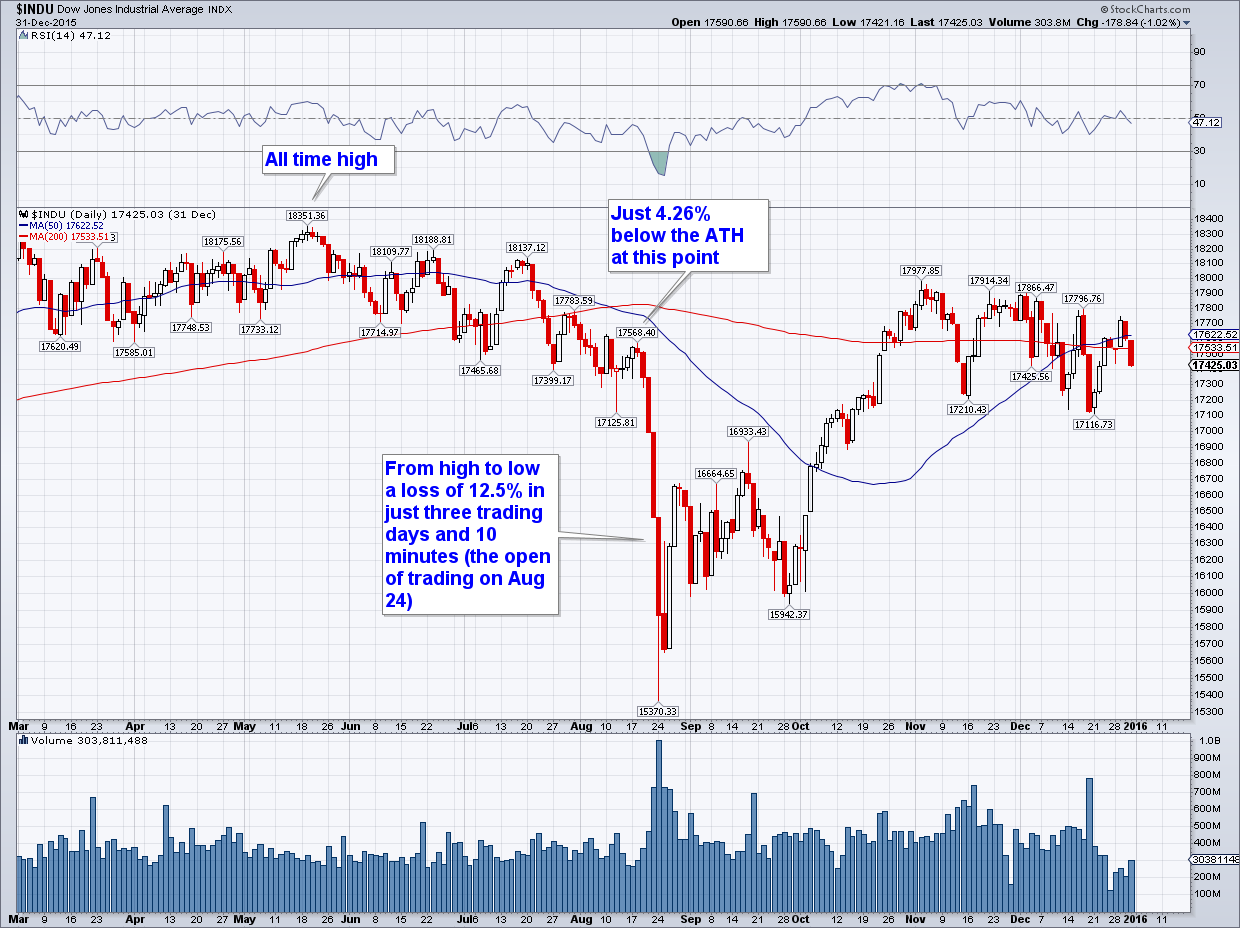
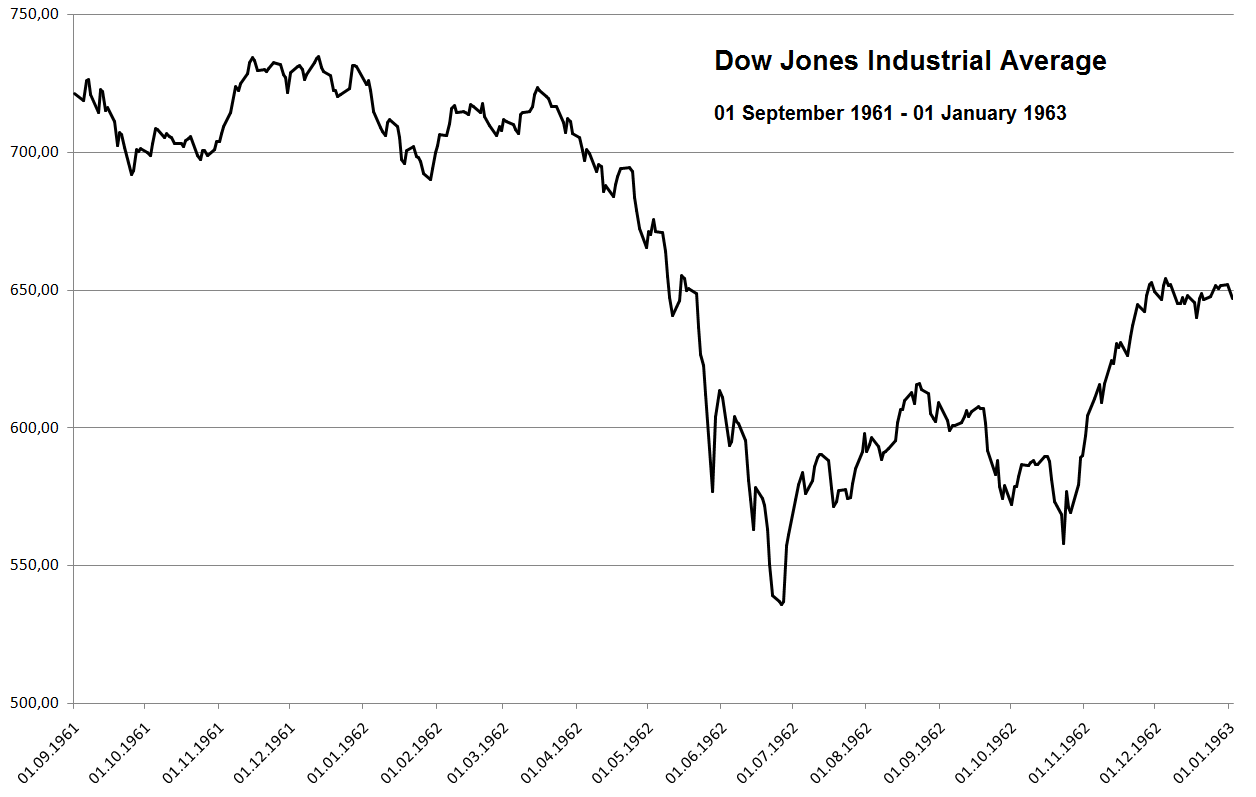
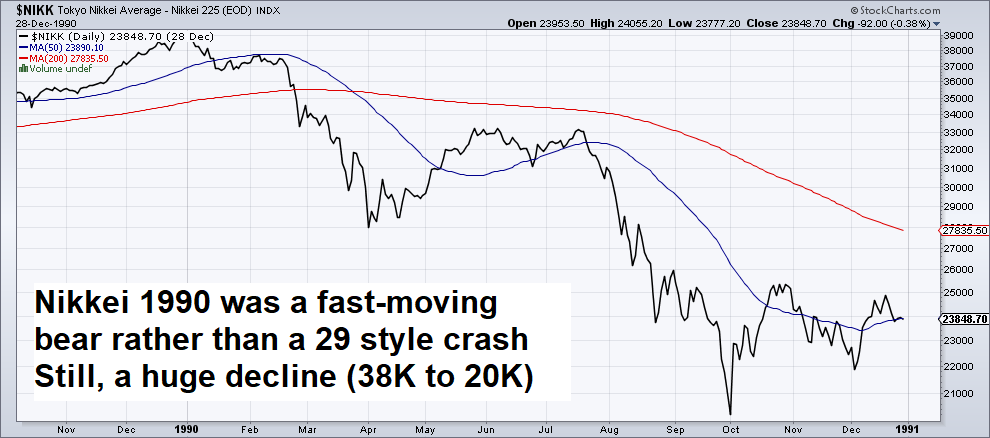
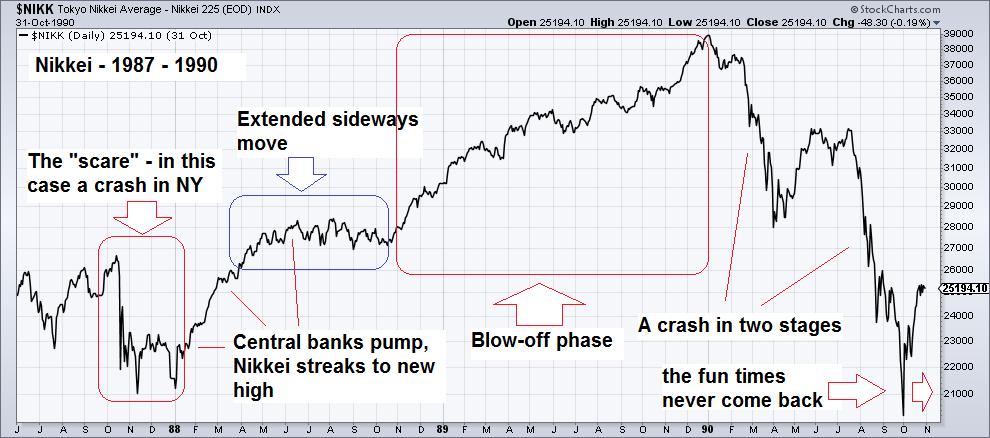
The fact that DJIA and RUT are now below their 200 dmas makes this a very interesting juncture - normally this is where the market should begin to bounce. If it doesn't, you can begin to use the attached crash templates for short term planning purposes. The 1980s - 1990s Nikkei template looks like a fairly close analog as well so far.
On Tue, Feb 25, 2020 at 8:19 PM G wrote:
spx and ndx have a ways to go before the 200 dma...
dow is already there.
qwazy.
and gold bugs don't want to hold on to anything. dble qwazy. fundamentally the virus is a currency wrecker and an inflation creator.. bugs need to pull their heads out of their asses and start thinking again. ....................................... never mind. f**k it.
On Monday, February 24, 2020 7:19 PM, H wrote:
Not going to work if market psychology breaks... keep an eye on the 200-day moving averages in SPX/INDU/NDX... they have survived four tests since the recovery from the late Dec. 2018 low. If they are sliced through with ease, it will signal a complete change in market character.
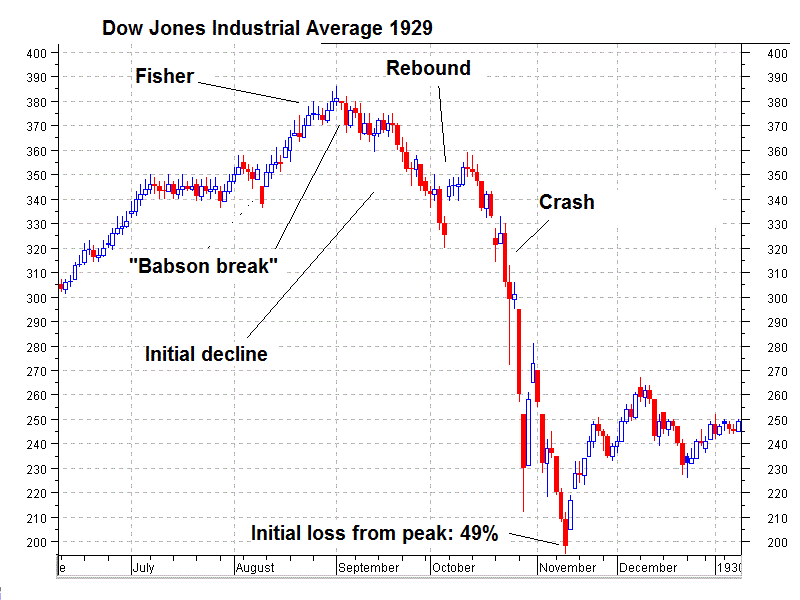
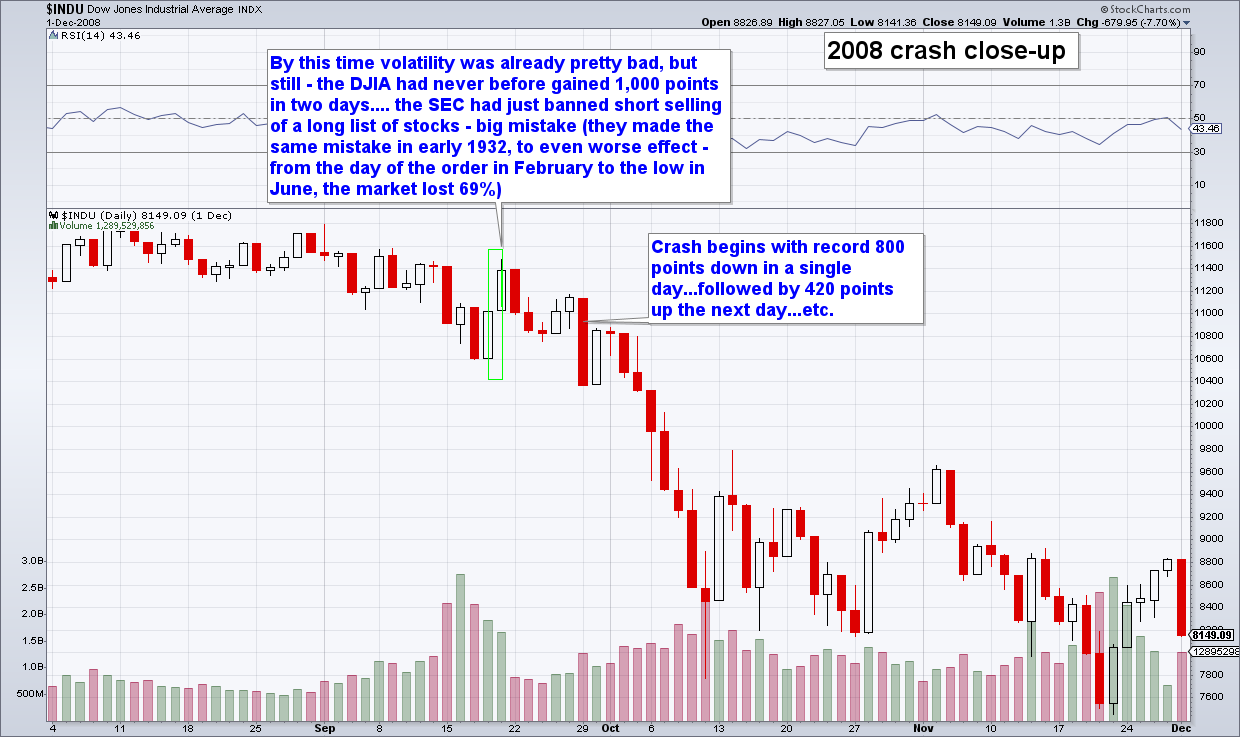
By the way, the charts still look very much like the 1928-1929 template and a variant of the 3 peaks & a domed house formation. I attach a chart I made a few months ago...
If it IS this formation, then we have just entered the crash window. Time to start counting days from the peak, and paying close attention when the bounce after the first wave down unfolds (the nature of the bounce will ideally tell us what outcome to expect).
 |


