HUV-T: in (Countertrend) Rally Mode
As mentioned last weekend, the U.S. stock market was in a 'bottomless pit' - and was hit very hard, almost as hard as the gold market - with the SPX dropping over 8.8% for the week, and is now down nearly 16% for the year as a whole. Take a look at the next chart, which shows the most dominant mid-term cycle that we track:
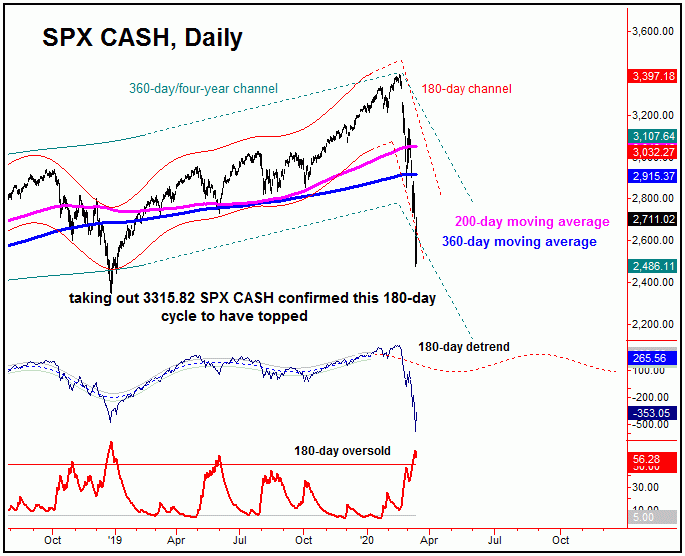
The chart above shows the 180-day cycle, which is next projected to bottom around the May or June timeframe of this year. In terms of price, as mentioned in prior weeks, the reversal below the 3315.82 SPX CASH figure (seen on 2/24/20) was the confirmation that the mid-term cycles had topped out with U.S. stocks - and with that were heading into their largest-percentage decline of the year. In terms of price, the 200-day moving average was expected to act as the minimum magnet, though with a decent potential that a decline back to the lower 360-day moving average would be seen.
With the above said and noted, the downward phase of this 180-day cycle remains in full force, though there is at least a bright light short-term, as we should be in the midst of a decent countertrend rally phase, due to the configuration of the smallest-tracked wave for U.S. stocks - the 10-day cycle, shown below:
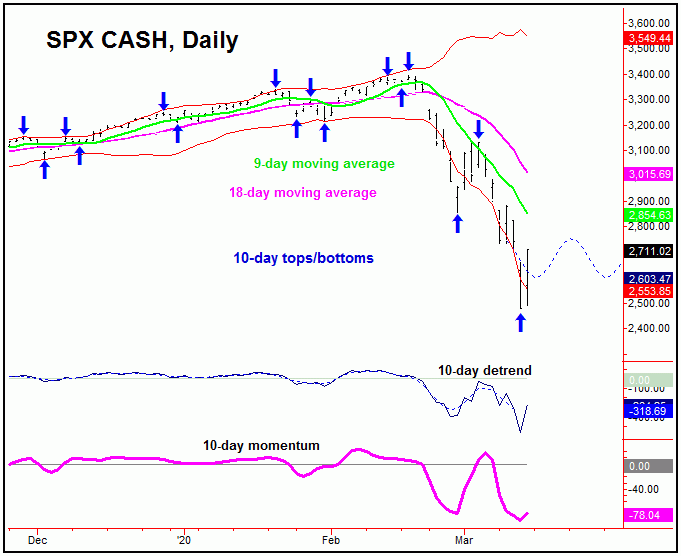
The 10-day cycle looks like it bottomed with Thursday's massive decline, and with that should be headed higher in the coming days - though we could be looking at another sharp decline at Monday's open. However, if the above assessment is correct, that decline will be met with buying, pushing the stock market higher for another week or two, with the 9-day moving average acting as the magnet here - and with some potential that a move as high as the 18-day moving average could be seen. Even said, this move up should be viewed as a countertrend affair, to be followed by lower lows, upon completion. More on all as we continue to move forward in the cyclic configuration.
Jim Curry |


