SI
SI
discoversearch

We've detected that you're using an ad content blocking browser plug-in or feature. Ads provide a critical source of revenue to the continued operation of Silicon Investor.  We ask that you disable ad blocking while on Silicon Investor in the best interests of our community.  If you are not using an ad blocker but are still receiving this message, make sure your browser's tracking protection is set to the 'standard' level.
Strategies & Market Trends : 2026 TeoTwawKi ... 2032 Darkest Interregnum
GLD 382.95-0.8%4:00 PM EST

 Public ReplyPrvt ReplyMark as Last ReadFilePrevious 10Next 10PreviousNext  
To: marcher who wrote (173648)6/25/2021 1:06:27 PM
From: Haim R. Branisteanu2 Recommendations

Recommended By
maceng2
marcher

  Read Replies (3) of 217740
 
marcher some scientists expect a termination event in solar Cycle 25.

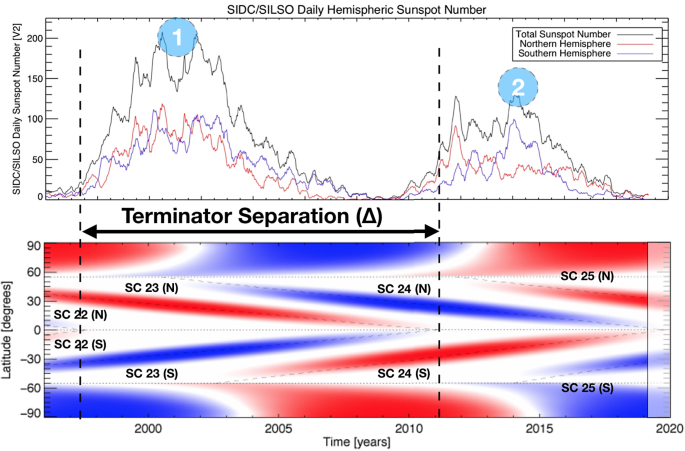
The sun have magnetic bands that are converging in opposition the the heat transport bands.
The magnetic circular band generate the terminations event as explained in this article link.springer.com

What it If this will happen in this cycle the conclusion of overheating earth is in the bag as the sun will generate very big CME's and flares. nature.com


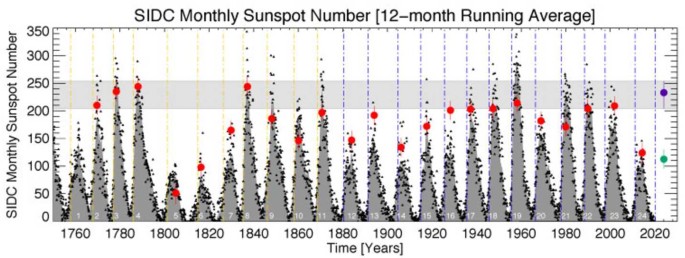
Sunspot Cycle 25 amplitude forecast in context. The monthly mean sunspot number since 1749. The data values are represented by dots and the 12-month running average values are illustrated as a dark gray shaded area. The sunspot cycle numbers are shown in the shaded area—SC1 starting in the 1755 and SC24 presently drawing to a close. For comparison with Figure 1 we show the (M2019) vertical blue dashed lines that signify the magnetic cycle termination times that trigger the rapid growth of sunspot activity, while the vertical orange dashed lines show the discrete Hilbert transform derived terminators of Leamon et al. ( 2020), see Figure 3 and Table 1. Also shown are the forecast values of SC25 amplitude from the analysis above (purple dot) and the SC25PP (green dot). The horizontal light-gray shared region is to place the present forecast in historical context. Finally, we show the hindcast sunspot maxima for each cycle (red dots) derived from the measured terminator values and using the relationship developed above - the error bars on the hindcast dots represent the 68% confidence value.
Report TOU ViolationShare This Post
 Public ReplyPrvt ReplyMark as Last ReadFilePrevious 10Next 10PreviousNext