| | | The Most Splendid Housing Bubbles in America: Holy Cow, September Update
The Most Splendid Housing Bubbles in America: Holy Cow, September Update | Wolf Street
By Wolf Richter for WOLF STREET.House prices spiked 19.7% from a year ago, the biggest year-over-year increase in the data going back to 1987, according to the National Case-Shiller Home Price Index today. But the national index of this raging mania doesn’t do justice to individual metropolitan areas, where price spikes reached up to 32%.
The Fed is getting seriously antsy about this massive house price inflation, on top to the regular consumer price inflation that has hit 30-year highs. Just today, the president of the Federal Reserve Bank of St. Louis, James Bullard, who’d been fretting months ago about the “threatening housing bubble,” came out with a proposal to reduce the assets on the Fed’s balance sheet right after the taper is completed by mid-2022, which would purposefully allow long-term interest rates, including mortgage rates, to rise significantly.
“Everything can occur much faster than it could have in the previous recovery,” he said.
Markets have started to anticipate the end of QE. Long-term interest rates have started to rise. The 10-year Treasury yield is currently at 1.55%, the highest since mid-June. The average 30-year fixed mortgage rate today was 3.16%.
The mind-boggling price spikes in the charts below for individual metropolitan areas are based on the “July” Case-Shiller Index. The July data are a three-month moving average of closed sales that were entered into public records in April, May, and June. That’s the time frame we’re looking at here.
House price inflation. The Case-Shiller Index uses the “sales pairs method,” comparing the sales price of a house to the price of the same house when it sold previously, and includes adjustments for home improvements. By tracking the amount required to buy the same house over time, it is a measure of house price inflation.
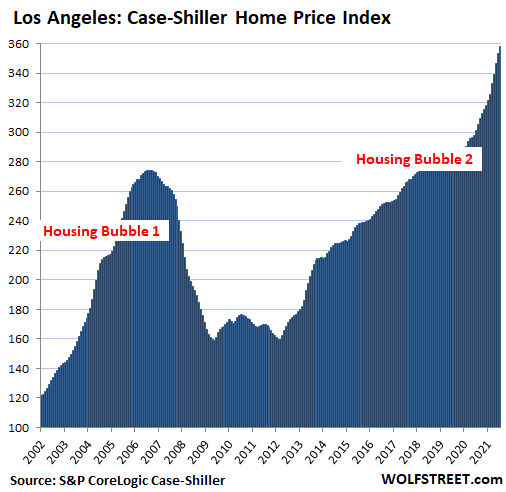
Los Angeles metro: Prices of single-family houses rose 1.4% in July from June and spiked by 19.1% year-over-year.
All Case-Shiller Indices were set at 100 for January 2000. The index value for Los Angeles of 359 means that house prices have soared by 259% since January 2000, despite the Housing Bust in between. The Consumer Price Index (CPI) has risen by 62% over the same period.
This puts Los Angeles on the dubious pedestal of being the most splendid housing bubble on this list. All charts below are on the same scale as Los Angeles to show the relative heat of house price inflation in each market since 2000.
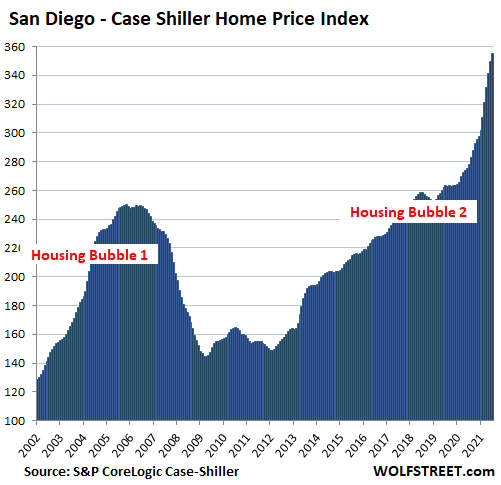
San Diego metro: House prices rose 1.6% for the month and by 27.8% year-over-year. Since 2000, prices have exploded by 255%:
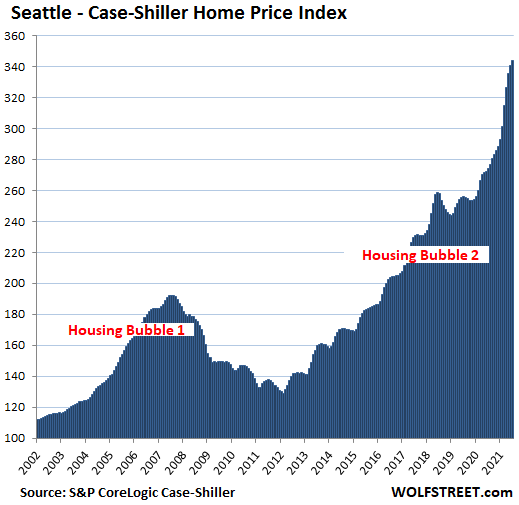
Seattle metro: House prices rose by 0.9% for the month and by 25.5% year-over-year. Since January 2000, house prices have soared 244%:
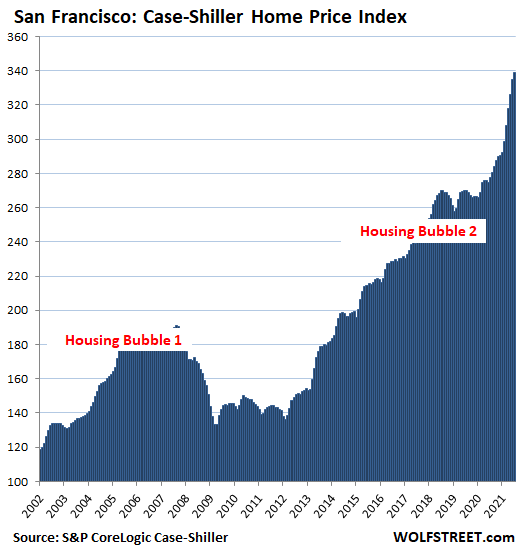
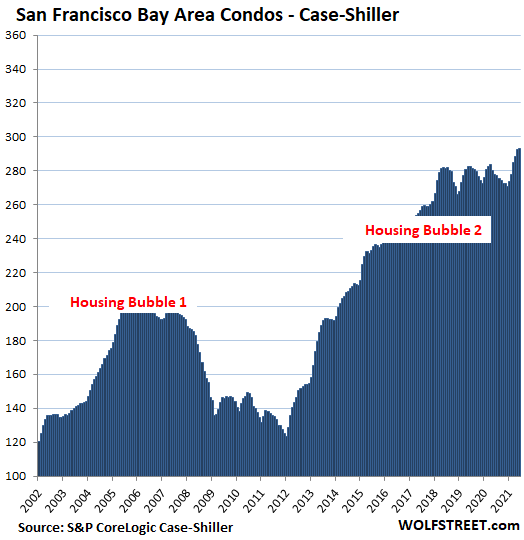
The San Francisco Index covers the five counties of San Francisco, San Mateo, Alameda, Contra Costa, and Marin. The peculiar thing here is that while prices of single-family houses have been spiking, condo prices have gone nowhere in years.
The Case-Shiller Index for houses rose 1.2% for the month and 22.0% year-over-year. Since 2000, prices soared by 239%.
Condo prices have been wobbling along the flat-line since early 2018. For the month, condos rose 0.3% and were up 5.4% from the beaten down levels last year:
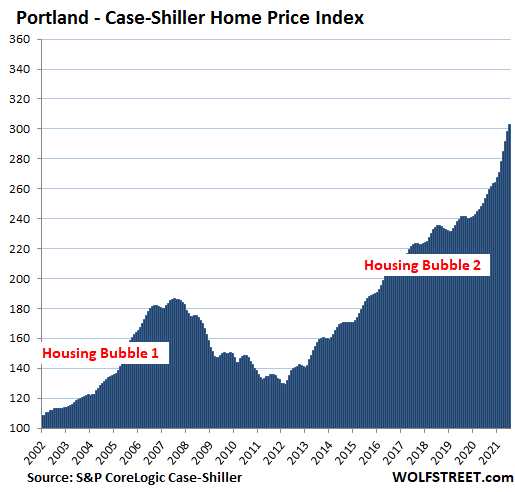
Portland metro: House prices jumped 1.5% for the month and 19.5% year-over-year, and are up 203% since 2000:
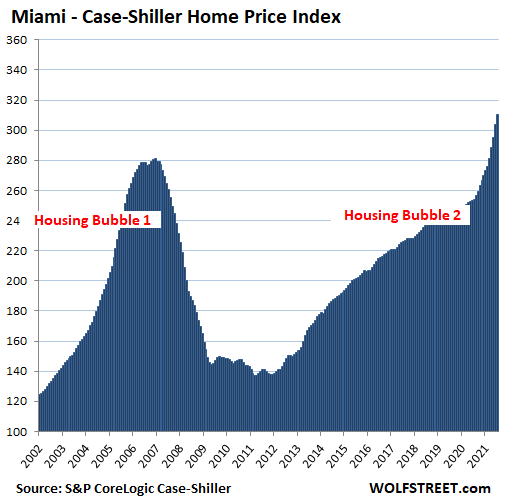
Miami metro: +2.2% for the month, +22.2% year-over-year. Prices are up 210% since 2000:
The New York metro covers New York City plus counties in the states of New York, New Jersey, and Connecticut, ranging from some of the most expensive real estate in the US to less expensive areas:
Low-tier house prices have spiked the most, up 1.6% for the month and 21.8% year-over-year (black line).Condo prices have been about flat since February 2018, with an uptick over the past few months. +1.8% for the month, +3.8% year-over-year (red line).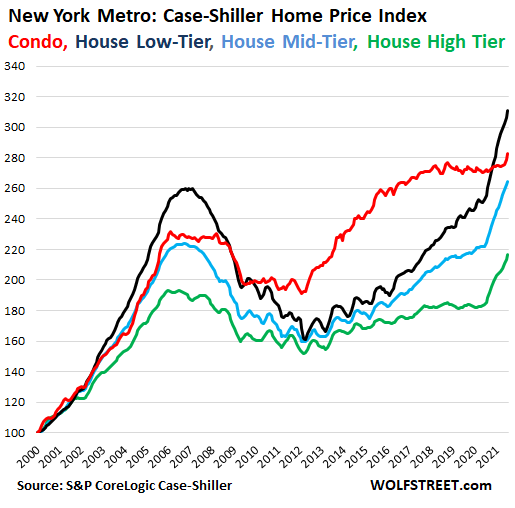
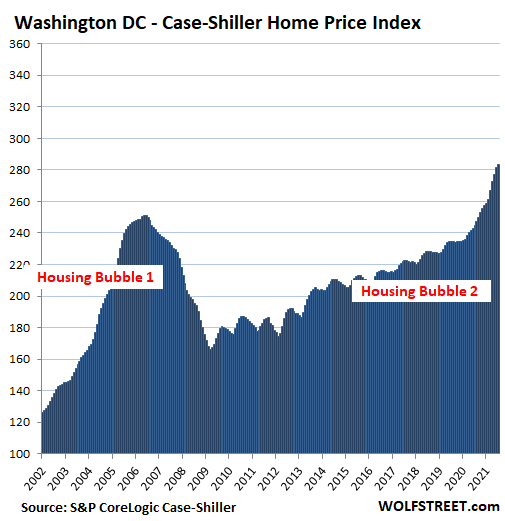
Washington D.C. metro: +0.8% for the month, +15.8% year-over-year:
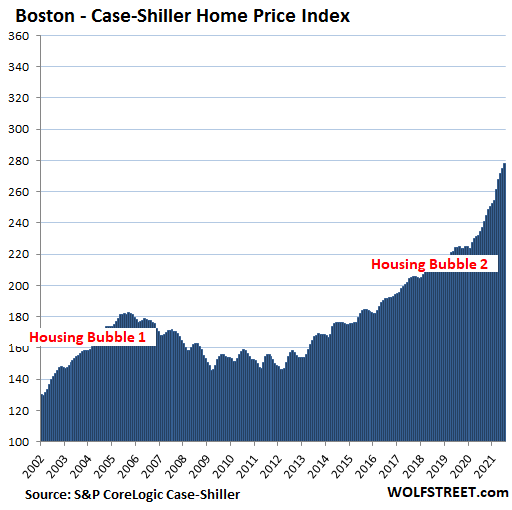
Boston metro: +1.1% for the month, +18.7% year-over-year:
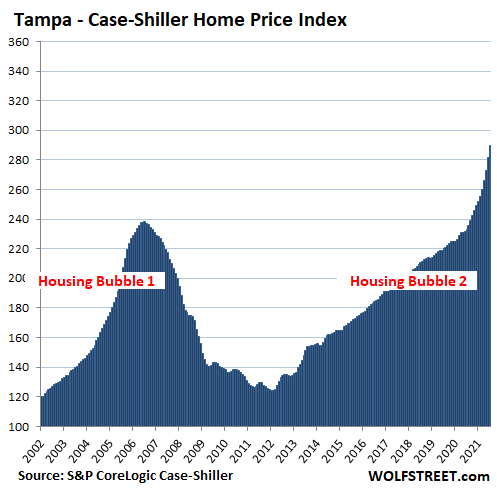
Tampa metro: +2.9% for the month, +24.4% year-over-year:
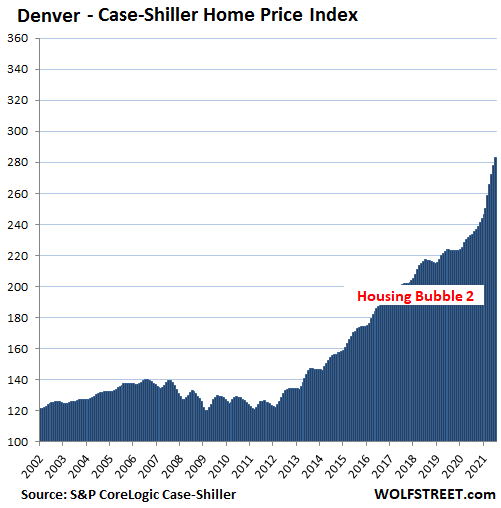
Denver metro: +1.8% for the month, +21.3% year-over-year:
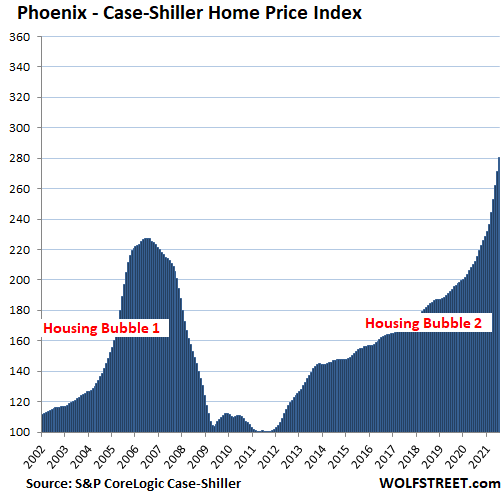
Phoenix metro, holy cow: +3.3% for the month, +32.4% year-over-year. The reddest-hottest annual house price inflation among the most splendid housing bubbles here:
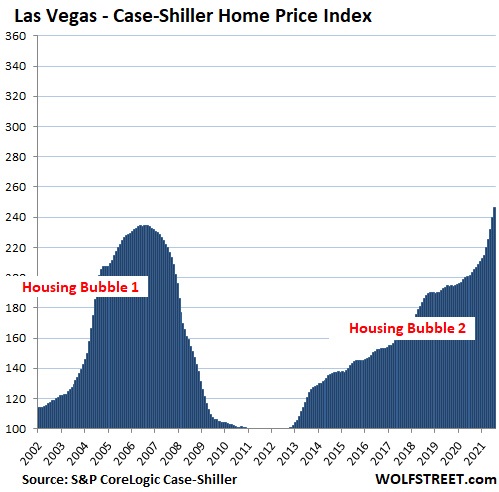
Las Vegas metro: +2.8% for the month, +15.8% year-over-year:
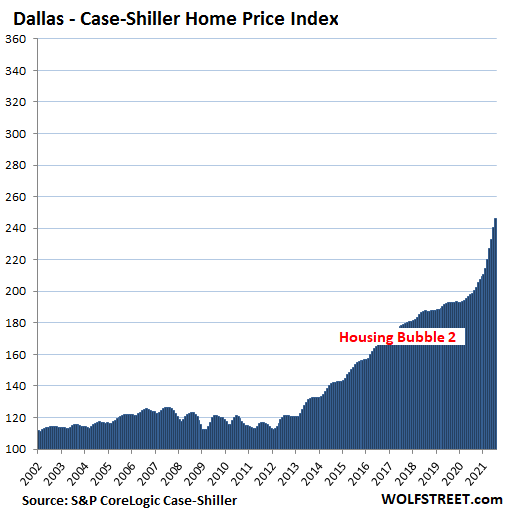
Dallas metro: +2.4% for the month, +23.7% year-over-year. The index is up 146% since 2000.
The remaining cities in the 20-City Case-Shiller Index have experiences less-hot house price inflation since 2000 and thereby don’t yet qualify for this list of the most splendid housing bubbles.
Enjoy reading WOLF STREET and want to support it? Using ad blockers – I totally get why – but want to support the site? You can donate. I appreciate it immensely. Click on the beer and iced-tea mug to find out how:
 |
|


