Latest from McHugh who is very good.
Basically off of 20-30 long-ETF-options (QQQ, DIA, GLD, SQQQ, etc) of short duration (30-60 days), each between 5-8K, staggered, generally w/ perhaps $50-75K on the table, resulting in perhaps 100-150K of take-home. Certainly pays for the subscription.


32.
***************************
Today's Market Comments:
Stocks oscillated around the starting gate, rose, then fell into the close, Friday, February 4th. They ended mixed. Volume was lighter than their 10 day average. Breadth was even. There was a small change in the McClellan Oscillator Friday, suggesting a large price move is likely over the coming days. The market almost triggered another Hindenburg Omen observation, however New Highs just missed the minimum threshold of 2.2 percent of total NYSE issues traded.
This weekend we visit the Long Term Primary Trend Indicator in charts and analysis on pages 34 through 36. This indicator remains on a Buy this weekend, however there is some convergence occurring between the Fast and Slow measures. Once a cross under occurs and lasts for 3 consecutive months, it will trigger a new Sell signal. These signals are rare, but quite effective at identifying major new trends.
We have updated all charts for all markets we cover in this weekend's newsletter.
While it is possible that the Industrials and S&P 500 have completed subwave c-up, the final subwave for the final Minuette degree wave e-up, to complete the terminal Megaphone topping pattern from September 2021, it is also equally possible that wave e-up is not finished. In that case, subwave a-up has topped, and subwave b-down is underway now, with c-up to follow to end the wave e-top. Once e-up tops, a crash will occur.
If the Industrials and S&P 500 drop decisively below their intraday lows on January 24th, below 33,150 and below 4,222, we would conclude the tops are in, and a massive Bear market CRASH is resuming in Blue Chips.
As for the NASDAQ 100, they topped on November 22nd, 2021, and are inside the first five-wave decline of the developing Grand Supercycle degree {IV} Bear market. The NDX has completed the first three Micro degree waves, and is inside corrective Micro degree wave 4-up. To follow will be 5-down, putting the final touches on the first NASDAQ 100 crash of the new Bear market (there will be several on the way down to the pit). See charts on pages 49 and 50. The point is, more downside is coming.
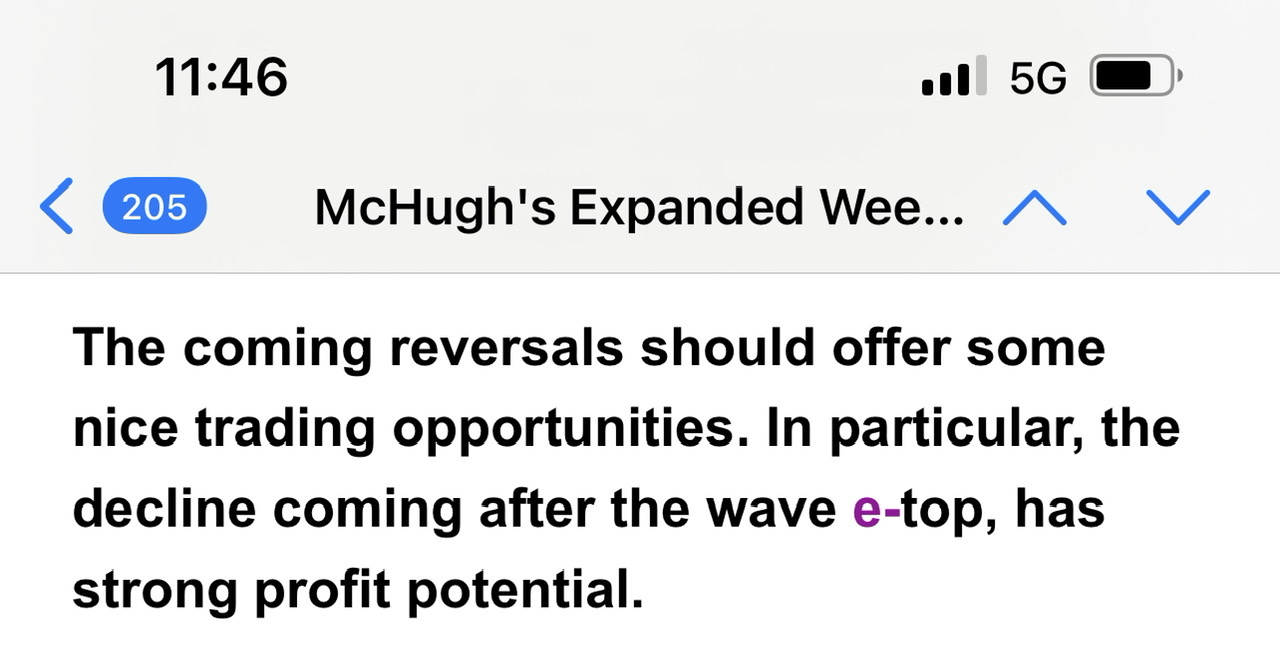
The coming reversals should offer some nice trading opportunities. In particular, the decline coming after the wave e-top, has strong profit potential.
The stock market sits on two simultaneous "official" Hindenburg Omen potential stock market crash signals. The H.O.'s are warning that the odds for a full-blown stock market crash are far higher than random at this time, the third one on the clock through May, the second one through April. This stock market may be on the teetering edge. March into May could be ugly.
We can expect a continuing wild ride for the Stock Market in 2022. There are going to be a total of 18 Phi Mate and significant Bradley Model turn dates throughout 2022. There will be 7 turns that both cycle methods identify together. Those will likely be major turns in the stock market. By comparison, there were only 8 total Phi Mate and Bradley Model turn dates during 2021, with only two turns identified by both at the same time. We will progressively feed these forward dates to you during 2022. Trend Turns typically occur +/- a few days from these dates.
The stock market has declined sharply between November and March in nine of the past thirteen years (70 percent of the years). This is likely to occur again in early 2022.
Our intermediate term Secondary Trend Indicator generated a Sell signal November 26th. It rose 3 points Friday (out of a possible 9 points), to negative - 40.
There were two changes to our key indicators from Thursday's plunge: The Blue Chip three component key indicator moved to Neutral from Buy as the Purchasing Power Indicator triggered a Sell. The NASDAQ 100 three component key indicator moved to neutral from a Buy as the NDX PPI triggered a Sell. The small cap Russell 2000's Purchasing Power Indicator remains on a Buy.
Our Blue Chip key trend-finder indicators generated a Neutral signal February 3rd, 2022 and remain there Friday, February 4th, 2022. The Purchasing Power Indicator component triggered a Sell signal Thursday, February 3rd. The 14-day Stochastic Indicator generated a Buy on January 28th, 2022, and the 30-Day Stochastic Indicator generated a Buy on February 2nd, 2022. When these three indicators agree, it is a short-term (1 week to 3 months' time horizon) key trend-finder directional signal. When these three indicators are in conflict with one another, it is a Neutral (Sideways) key trend-finder indicator signal.
Demand Power Rose 6 to 471 Friday, while Supply Pressure was flat at 530, telling us Friday's Blue Chip move was weak. This DP/SP Indicator generated a Sell Signal January 18th.
Today's Mining Stocks and Precious Metals Market Comments:
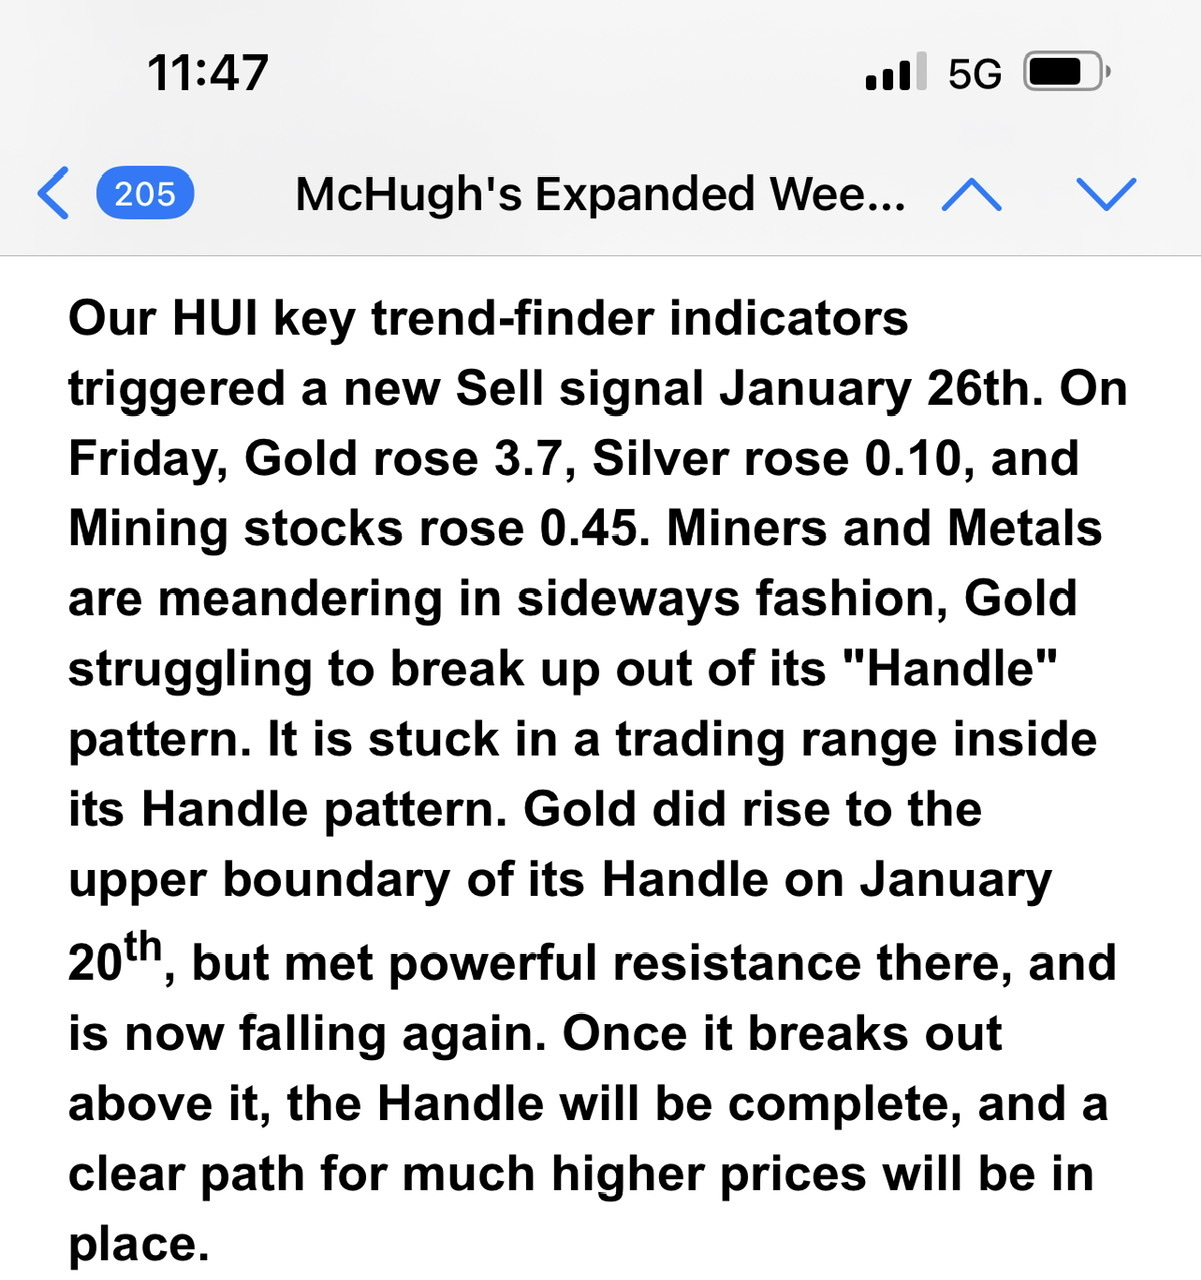
Our HUI key trend-finder indicators triggered a new Sell signal January 26th. On Friday, Gold rose 3.7, Silver rose 0.10, and Mining stocks rose 0.45. Miners and Metals are meandering in sideways fashion, Gold struggling to break up out of its "Handle" pattern. It is stuck in a trading range inside its Handle pattern. Gold did rise to the upper boundary of its Handle on January 20th, but met powerful resistance there, and is now falling again. Once it breaks out above it, the Handle will be complete, and a clear path for much higher prices will be in place.
Gold started a Bullish Cup and Handle pattern in 2011. The Cup portion completed a year ago, and since then Gold has been declining inside the handle portion of the pattern, which is the concluding piece. While the timing for a breakout is slow and frustrating for Gold bugs, one thing we can be assured of is once it breaks out of the Handle, a powerful rally will follow, one for the ages.
The HUI key trend-finder indicator triggered a Sell signal January 26th, 2022, as the HUI 30 Day Stochastic triggered a Sell signal January 26th, and the HUI Purchasing Power Indicator triggered a Sell on January 21st. When these two indicators agree, it is a directional signal, and when at odds with one another, it is a combination neutral signal. The HUI Demand Power / Supply Pressure Indicator triggered a Sell signal January 21st. On Friday, February 4th, Demand Power was Flat at 379 while Supply Pressure fell 4 to 400, telling us Friday's move was weak.
DJIA/SPY PPI rose 1 to negative - 6.09, on a Sell
DJIA 30 Day Stochastic Fast 40.00 Slow 42.67 On a Buy
DJIA 14 Day Stochastic Fast 60.00 Slow 60.56 On a Buy
DJIA % Above 30 Day Average 40.00
DJIA % Above 10 Day Average 63.33
DJIA % Above 5 Day Average 26.67
Secondary Trend Indicator Rose 3 to Negative - 40, On a Sell
Demand Power Up 6 to 471, Supply Pressure Flat at 530 on a Sell
McClellan Oscillator rose modestly to negative - 65.99
McClellan Osc Summation Index - 992.19
DJIA 10 Day Advance/Decline Indicator - 171.9 on a Sell
NYSE New Highs 67 New Lows 265
Today's Technology NDX Market Comments:
The NDX Short-term key Trend-finder Indicators moved to a Neutral signal Thursday, February 3rd, 2022, and remain there February 4th, 2022. The NDX Purchasing Power Indicator generated a Sell on February 3rd, 2022, the NDX 14 Day Stochastic triggered a Buy on January 31st, 2022, and the 30 Day Stochastic triggered a Buy signal on January 31st, 2022. When all three component indicators are in agreement on signals, it is a consensus directional signal. When they differ, it is a sideways signal.
The NDX Demand Power / Supply Pressure Indicator moved to a Sell Signal Thursday, January 13th, and remains there February 4th. On Friday, February 4th, Demand Power Rose 17 to 517, while Supply Pressure Fell 7 to 539, telling us Friday's rise was powerful with short covering doing most of the buying.
The NDX 10 Day Average Advance/Decline Line Indicator triggered a Buy signal February 4th, and needs to fall below negative - 5.0 for a new Sell. It rose to positive + 6.6 on Friday, February 4th.
NDX 100 Purchasing Power Indicator Up 3 to + 254.02 On a Buy
NDX 30 Day Stochastic Fast 28.21 Slow 30.00 On a Buy
NDX 14 Day Stochastic Fast 53.85 Slow 55.13 On a Buy
NDX 10 Day Advance/Decline Line Indicator + 6.6 On a Buy
NDX Demand Power Up 17 to 517, Supply Pressure Fell 7 to 539 Sell
RUT PPI Up 1 to 178.36, on a Buy
RUT 10 Day Advance/Decline Line Indicator - 64.10, On a Sell
McHugh's Market Forecasting and Trading Report and this Executive Summary |


