| | | Our son tells us the same at Ma General.
Pictures of covid lung infection:
PHOTO GALLERY: How COVID-19 Appears on Medical Imaging
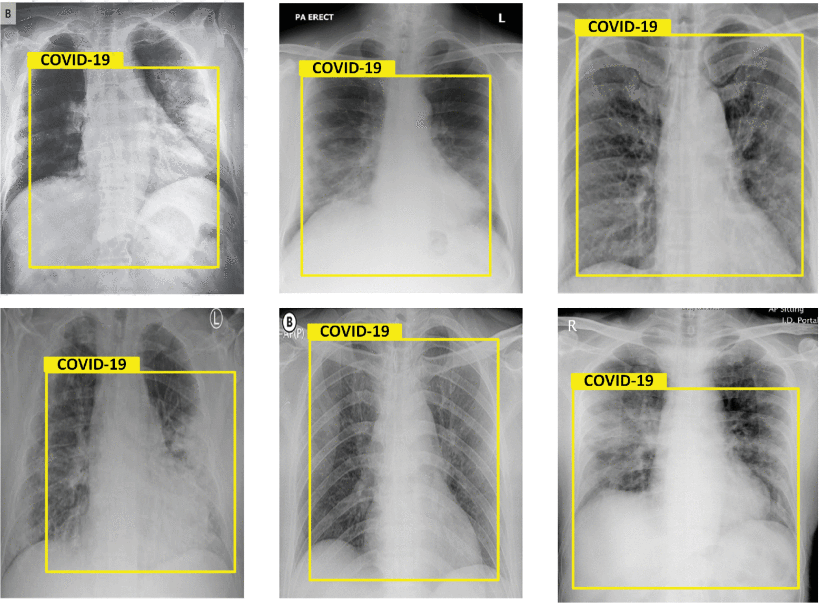
 Several studies have reported that AI-based systems can be used to detect COVID-19 in chest X-ray images because the disease tends to produce areas with pus and water in the lungs, which show up as white spots in the X-ray scans. Although various diagnostic AI models based on this principle have been proposed, improving their accuracy, speed, and applicability remains a top priority. Results of chest X-Rays, detected as COVID-19. Images courtesy of IEEE Several studies have reported that AI-based systems can be used to detect COVID-19 in chest X-ray images because the disease tends to produce areas with pus and water in the lungs, which show up as white spots in the X-ray scans. Although various diagnostic AI models based on this principle have been proposed, improving their accuracy, speed, and applicability remains a top priority. Results of chest X-Rays, detected as COVID-19. Images courtesy of IEEE
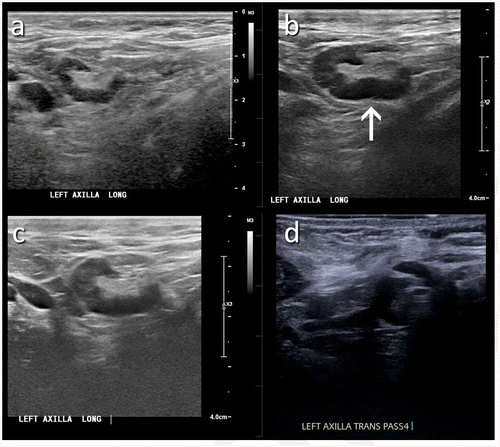
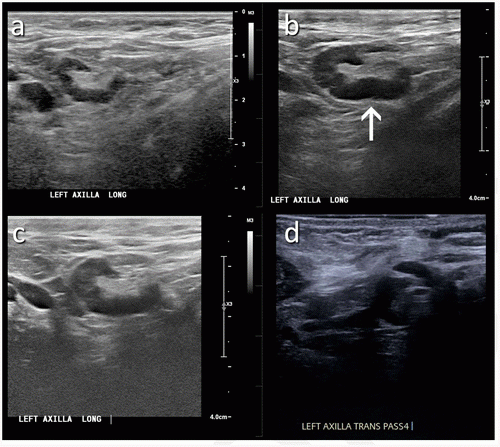 (A) A 46-year-old patient with a strong family history of breast cancer had a screening ultrasound prior to COVID-19 vaccination demonstrating a morphologically normal left axillary lymph node. (B) 25 days following the second dose of the COVID-19 vaccination, the patient presented with a palpable lump in the left axilla and ultrasound demonstrated enlarged lymph nodes with cortex measuring up to 6 mm in thickness (arrow). (C) A follow-up ultrasound 21 weeks following demonstrated stable axillary lymphadenopathy. (D) An ultrasound-guided core biopsy was then recommended and pathology demonstrated lymphoid cells negative for carcinoma. Image courtesy of RSNA Radiology Journal (A) A 46-year-old patient with a strong family history of breast cancer had a screening ultrasound prior to COVID-19 vaccination demonstrating a morphologically normal left axillary lymph node. (B) 25 days following the second dose of the COVID-19 vaccination, the patient presented with a palpable lump in the left axilla and ultrasound demonstrated enlarged lymph nodes with cortex measuring up to 6 mm in thickness (arrow). (C) A follow-up ultrasound 21 weeks following demonstrated stable axillary lymphadenopathy. (D) An ultrasound-guided core biopsy was then recommended and pathology demonstrated lymphoid cells negative for carcinoma. Image courtesy of RSNA Radiology Journal
Read the full story here
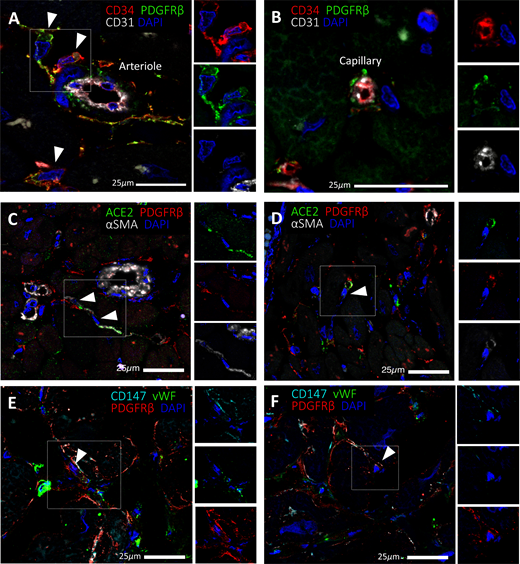 Expression of SARS-CoV-2 receptors in human cardiac PCs in situ: Immunofluorescence stainings showing PCs in the human heart. (A,B) Identification of CD31-CD34+PDGFRß+ PCs around microvessels. CD31 recognises the vessel lumen, the CD34 labels both the luminal ECs and perivascular PCs, while PDGFRß labels both PCs and vascular smooth muscle cells (VSMCs) in the arteriole’s tunica media. (C–F) A subset of PDGFRß+ cardiac PCs express ACE2 (C,D) and CD147 (E,F). a-SMA labels some PCs and arterioles’ VSMCs (C,D), while vWF recognises ECs (E,F). CD147 is also expressed by ECs (E,F). Arrowheads point to PCs. Image courtesy of Clinical Science Read the full story here Expression of SARS-CoV-2 receptors in human cardiac PCs in situ: Immunofluorescence stainings showing PCs in the human heart. (A,B) Identification of CD31-CD34+PDGFRß+ PCs around microvessels. CD31 recognises the vessel lumen, the CD34 labels both the luminal ECs and perivascular PCs, while PDGFRß labels both PCs and vascular smooth muscle cells (VSMCs) in the arteriole’s tunica media. (C–F) A subset of PDGFRß+ cardiac PCs express ACE2 (C,D) and CD147 (E,F). a-SMA labels some PCs and arterioles’ VSMCs (C,D), while vWF recognises ECs (E,F). CD147 is also expressed by ECs (E,F). Arrowheads point to PCs. Image courtesy of Clinical Science Read the full story here
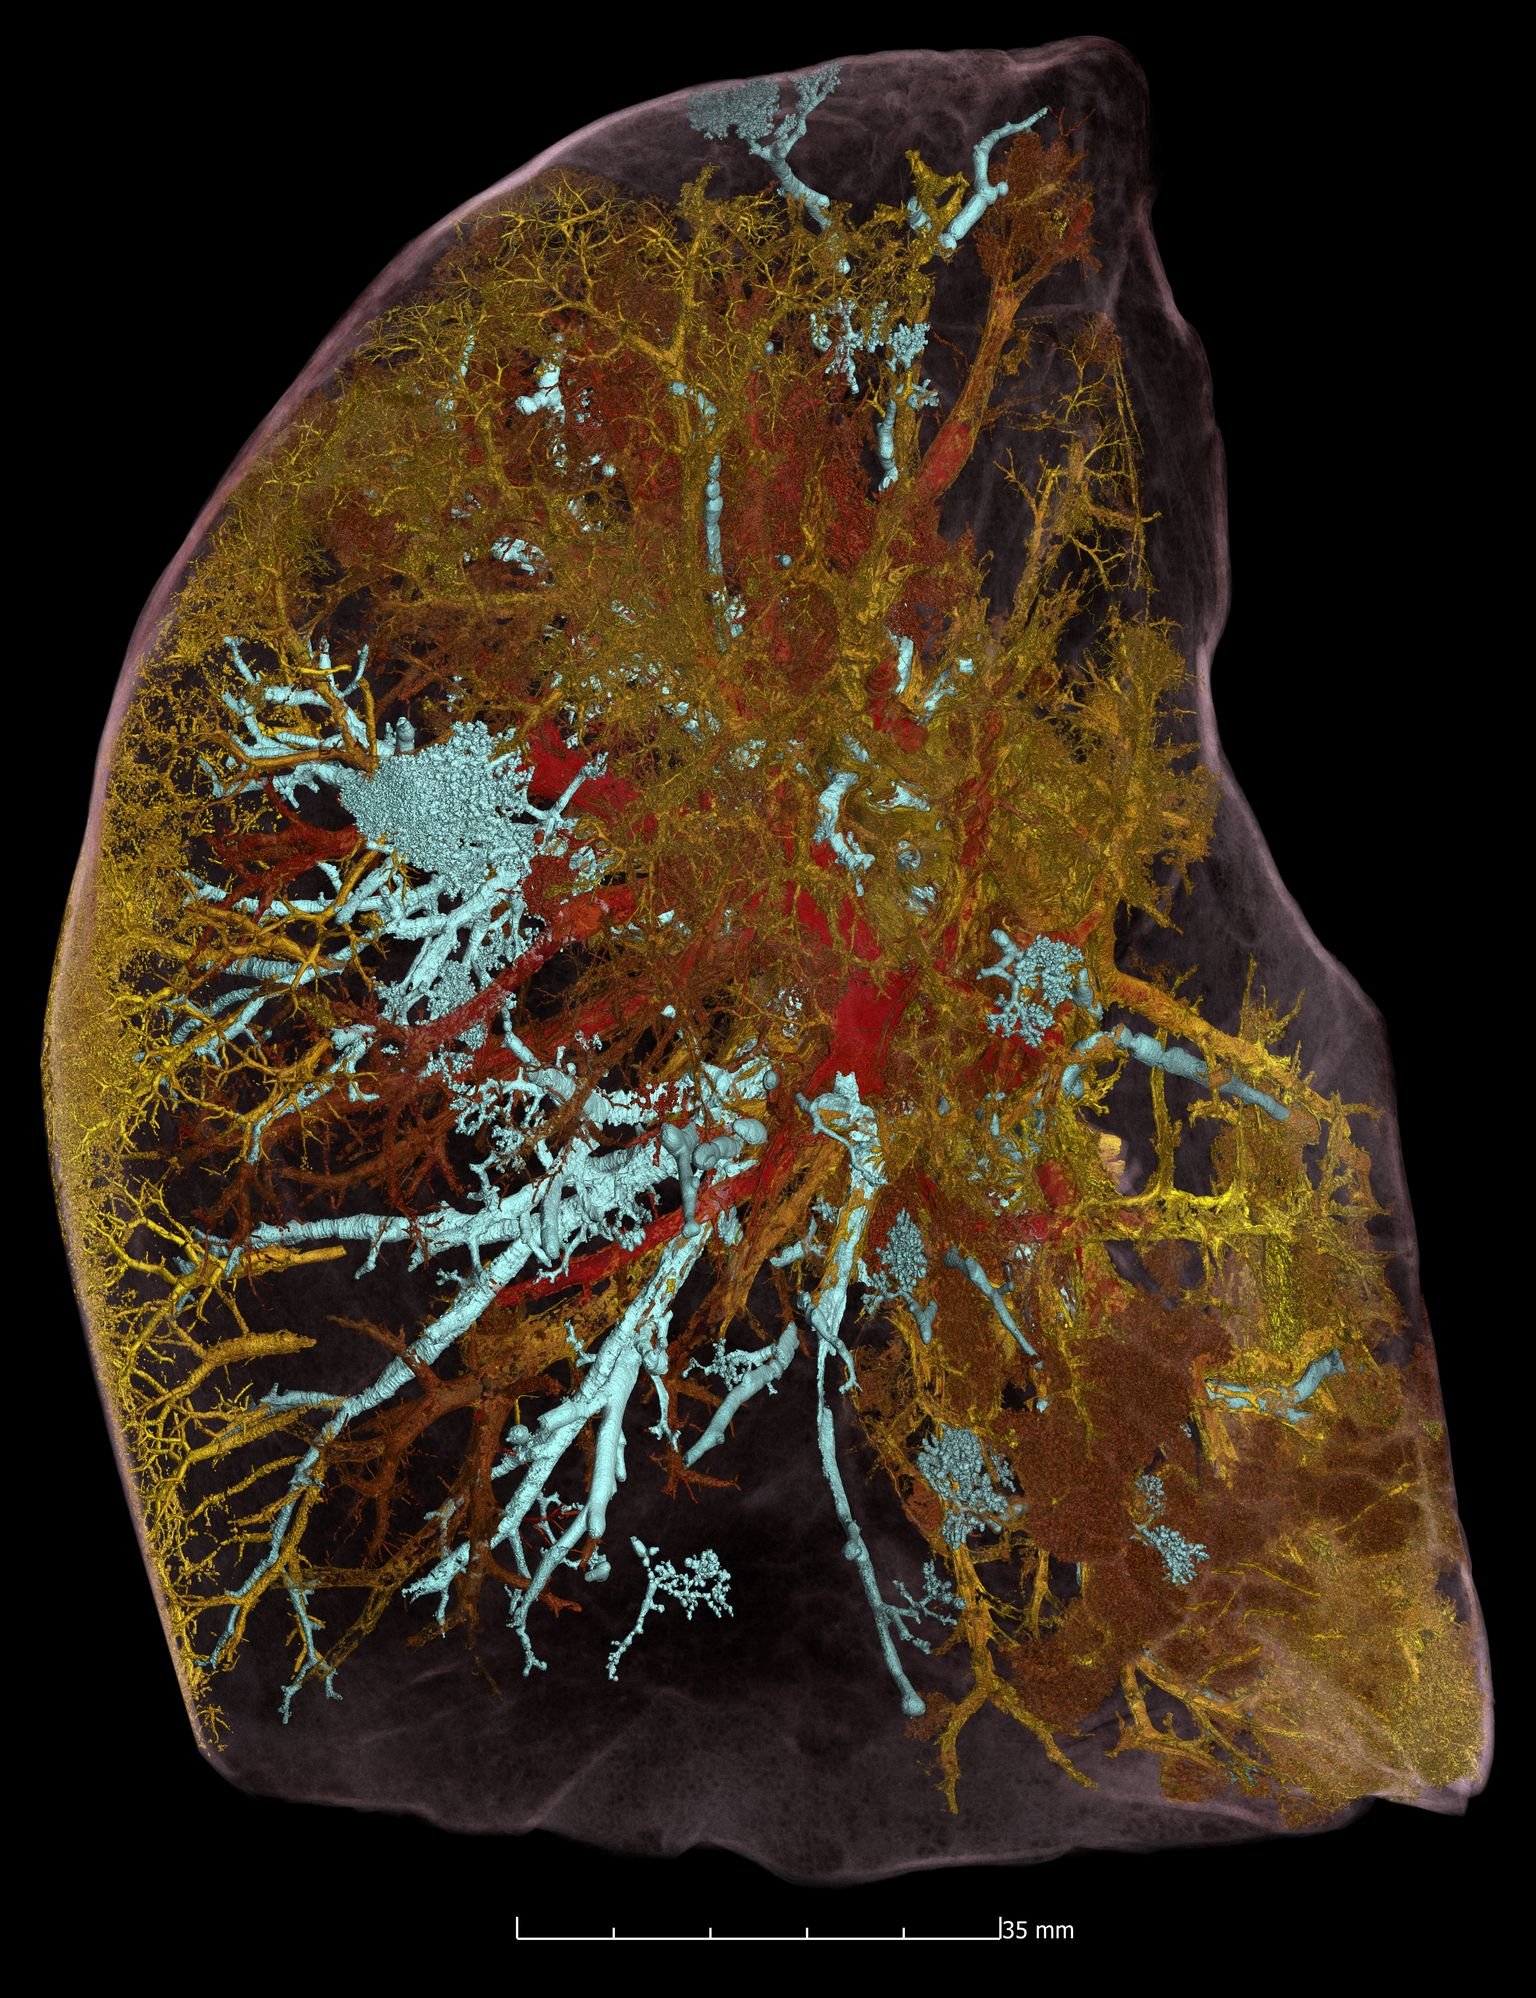
 The damage caused by COVID-19 to the lungs’ smallest blood vessels captured using high-energy X-rays emitted by a special type of particle accelerator in a new imaging technique called Hierarchical Phase-Contrast Tomography (HiP-CT). This enables 3D mapping across a range of scales, allowing clinicians to view the whole organ as never before by imaging it as a whole and then zooming down to cellular level. The technique uses X-rays supplied by the European Synchrotron in Grenoble, France, which now provides the brightest source of X-rays in the world at 100 billion times brighter than a hospital X-ray. This allows researchers to view blood vessels 5 microns in diameter (a tenth of the diameter of a hair). A clinical CT scan only resolves blood vessels that are about 100 times larger, around 1 mm in diameter. Read more The damage caused by COVID-19 to the lungs’ smallest blood vessels captured using high-energy X-rays emitted by a special type of particle accelerator in a new imaging technique called Hierarchical Phase-Contrast Tomography (HiP-CT). This enables 3D mapping across a range of scales, allowing clinicians to view the whole organ as never before by imaging it as a whole and then zooming down to cellular level. The technique uses X-rays supplied by the European Synchrotron in Grenoble, France, which now provides the brightest source of X-rays in the world at 100 billion times brighter than a hospital X-ray. This allows researchers to view blood vessels 5 microns in diameter (a tenth of the diameter of a hair). A clinical CT scan only resolves blood vessels that are about 100 times larger, around 1 mm in diameter. Read more
 A 26-year-old man with history of diabetes and hypertension presented with 7 days of fever, chills, nausea, intractable vomiting, diarrhea and generalized weakness, but no specific upper or lower respiratory symptoms aside from mild shortness of breath. The patient was diaphoretic and retching on arrival. Physical examination showed diffuse abdominal tenderness, mild tachypnea and tachycardia. Subsequent CT chest and SARS-CoV-2 PCR testing confirmed the diagnosis of COVID-19. The patient was admitted to the hospital with a primary diagnosis of diabetic ketoacidosis, the likely cause of his abdominal pain, secondary to SARS-CoV-2 infection. The patient was discharged home 9 days later. View the Case Study A 26-year-old man with history of diabetes and hypertension presented with 7 days of fever, chills, nausea, intractable vomiting, diarrhea and generalized weakness, but no specific upper or lower respiratory symptoms aside from mild shortness of breath. The patient was diaphoretic and retching on arrival. Physical examination showed diffuse abdominal tenderness, mild tachypnea and tachycardia. Subsequent CT chest and SARS-CoV-2 PCR testing confirmed the diagnosis of COVID-19. The patient was admitted to the hospital with a primary diagnosis of diabetic ketoacidosis, the likely cause of his abdominal pain, secondary to SARS-CoV-2 infection. The patient was discharged home 9 days later. View the Case Study
 The Society of Nuclear Medicine and Molecular Imaging (SNMMI) issued a statement on Jan. 14 regarding the possible effect of Omicron infection on FDG PET/CT scans. The Task Force members have recently observed an unusual imaging pattern on FDG PET/CT or FDG PET/MR that may be due to COVID-19 infection, and offered suggested recommendations that should be taken into consideration at the time of FDG PET/CT interpretations and the possibility of infection with Omicron variant of COVID-19 should be entertained in the differential diagnosis. The SNMMI guidelines can be found here. The Society of Nuclear Medicine and Molecular Imaging (SNMMI) issued a statement on Jan. 14 regarding the possible effect of Omicron infection on FDG PET/CT scans. The Task Force members have recently observed an unusual imaging pattern on FDG PET/CT or FDG PET/MR that may be due to COVID-19 infection, and offered suggested recommendations that should be taken into consideration at the time of FDG PET/CT interpretations and the possibility of infection with Omicron variant of COVID-19 should be entertained in the differential diagnosis. The SNMMI guidelines can be found here.
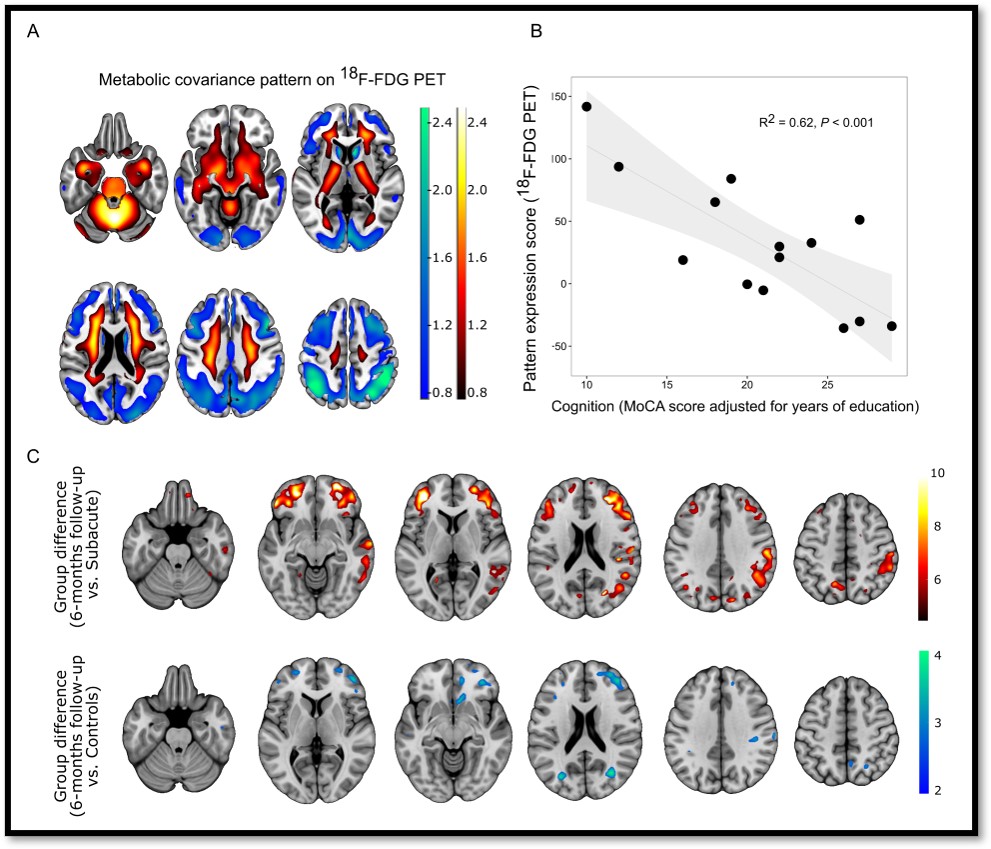
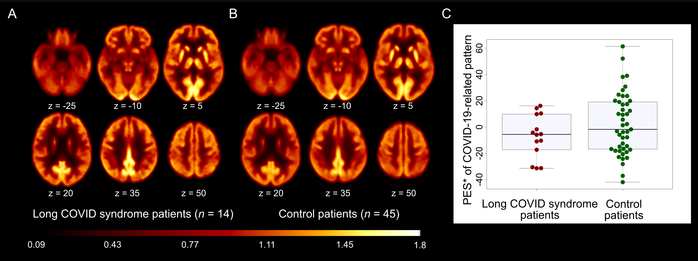
 Figure 1. A: COVID-19-related spatial covariance pattern of cerebral glucose metabolism overlaid onto an MRI template. B: Association between the expression of COVID-19-related covariance pattern and the MoCA score adjusted for years of education. Each dot represents individual patient. C: Results of a statistical parametric mapping analysis. Image Credit: G Blazhenets et al., Department of Nuclear Medicine, Medical Center – University of Freiburg, Faculty of Medicine, University of Freiburg. Figure 1. A: COVID-19-related spatial covariance pattern of cerebral glucose metabolism overlaid onto an MRI template. B: Association between the expression of COVID-19-related covariance pattern and the MoCA score adjusted for years of education. Each dot represents individual patient. C: Results of a statistical parametric mapping analysis. Image Credit: G Blazhenets et al., Department of Nuclear Medicine, Medical Center – University of Freiburg, Faculty of Medicine, University of Freiburg.
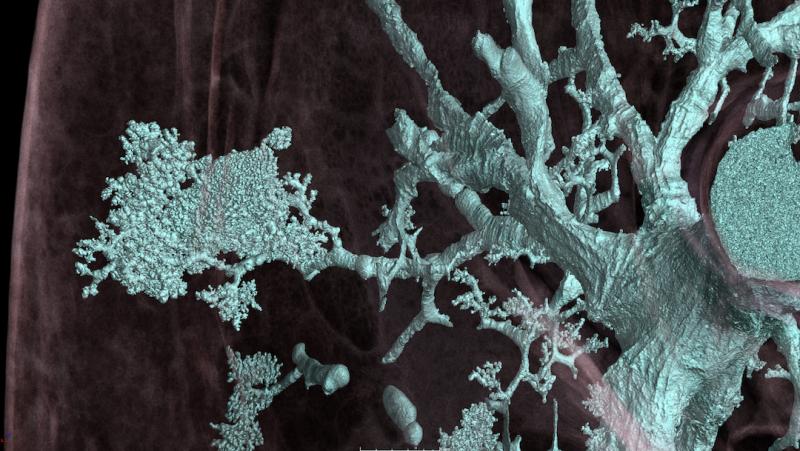 The damage caused by COVID-19 to the lungs’ smallest blood vessels captured using high-energy X-rays emitted by a special type of particle accelerator in a new imaging technique called Hierarchical Phase-Contrast Tomography (HiP-CT). This enables 3D mapping across a range of scales, allowing clinicians to view the whole organ as never before by imaging it as a whole and then zooming down to cellular level. The technique uses X-rays supplied by the European Synchrotron in Grenoble, France, which now provides the brightest source of X-rays in the world at 100 billion times brighter than a hospital X-ray. This allows researchers to view blood vessels 5 microns in diameter (a tenth of the diameter of a hair). A clinical CT scan only resolves blood vessels that are about 100 times larger, around 1 mm in diameter. Read more The damage caused by COVID-19 to the lungs’ smallest blood vessels captured using high-energy X-rays emitted by a special type of particle accelerator in a new imaging technique called Hierarchical Phase-Contrast Tomography (HiP-CT). This enables 3D mapping across a range of scales, allowing clinicians to view the whole organ as never before by imaging it as a whole and then zooming down to cellular level. The technique uses X-rays supplied by the European Synchrotron in Grenoble, France, which now provides the brightest source of X-rays in the world at 100 billion times brighter than a hospital X-ray. This allows researchers to view blood vessels 5 microns in diameter (a tenth of the diameter of a hair). A clinical CT scan only resolves blood vessels that are about 100 times larger, around 1 mm in diameter. Read more
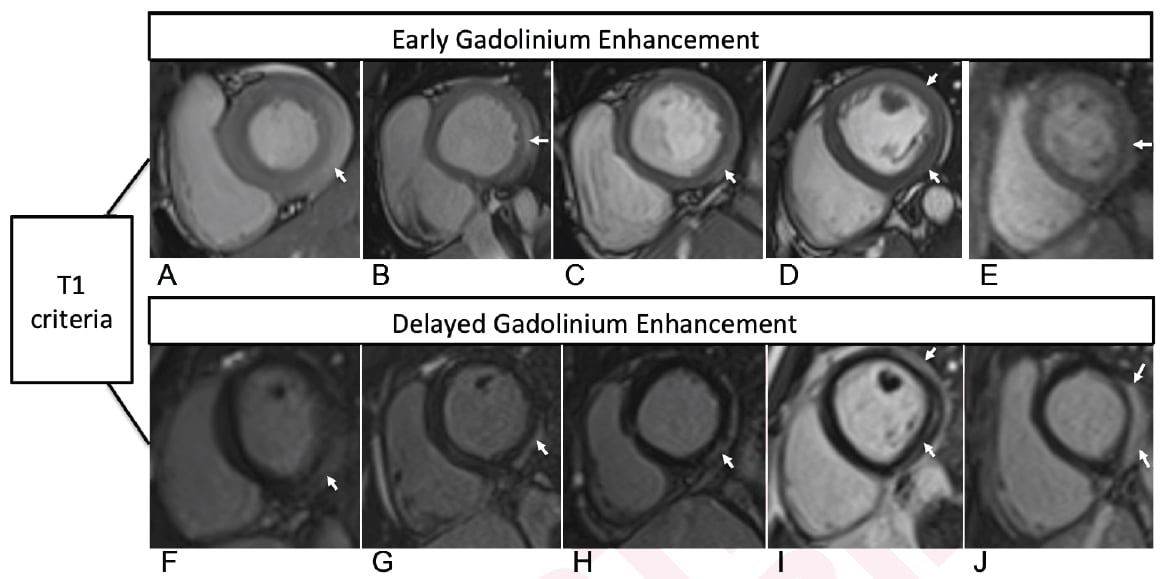
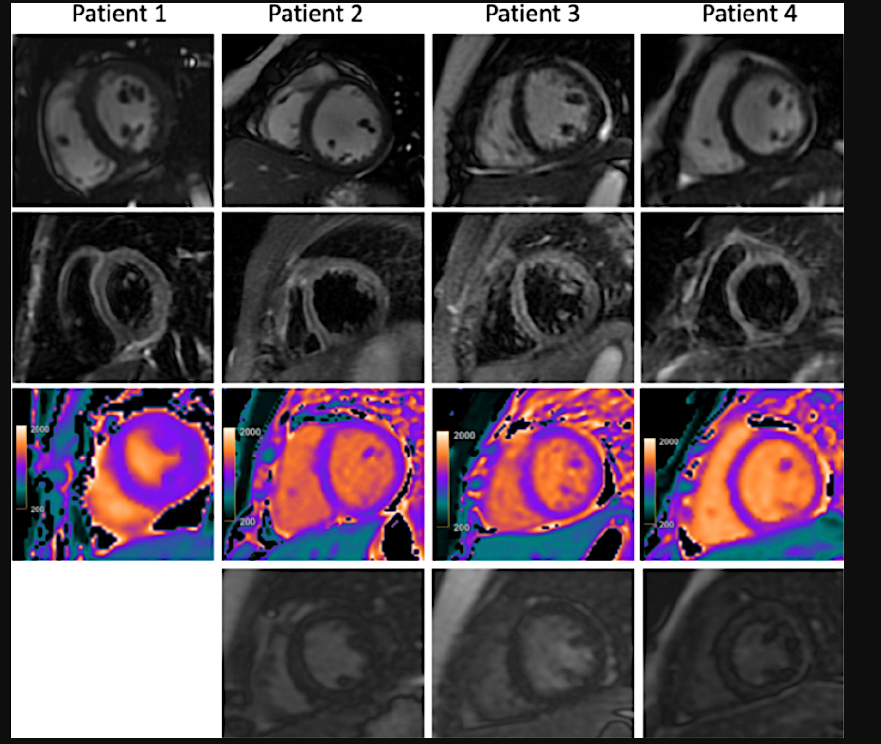
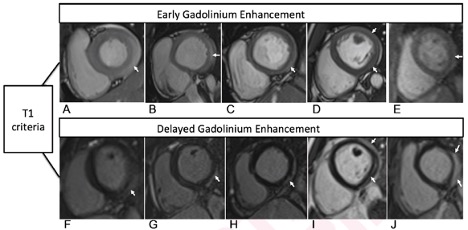
 Cardiac MRI T1-based criteria for myocarditis in patients with recent COVID-19 mRNA caccination. Early gadolinium enhancement (EGE) compared with precontrast SSFP sequence (not shown) is observed on early post-contrast short-axis SSFP images in (A) 16-year-old male, (B) 17-year-old male, (C) 16-year-old male, and (D) 19-year-old male, and on early postcontrast short-axis perfusion image in (E) 17-year-old male (arrow, A-E). Late gadolinium enhancement (LGE) is also present (arrows) in all 5 patients (F, G, H, I, and J; same patients as in A, B, C, D, and E, respectively). EGE and LGE predominantly affect subepicardium of the inferior, inferolateral, or anterolateral walls. EGE extends beyond confines of LGE in patient shown in (A) and (F) and in (B) and (G). Basilar LV involvement is present in patient shown in (A) and (F), (B) and (G), and (C) and (H). Mid-cavity LV involvement is present in patient shown in (D) and (I) and in (E) and (J). Chelala, et al. AJR article. Read more on this study. Cardiac MRI T1-based criteria for myocarditis in patients with recent COVID-19 mRNA caccination. Early gadolinium enhancement (EGE) compared with precontrast SSFP sequence (not shown) is observed on early post-contrast short-axis SSFP images in (A) 16-year-old male, (B) 17-year-old male, (C) 16-year-old male, and (D) 19-year-old male, and on early postcontrast short-axis perfusion image in (E) 17-year-old male (arrow, A-E). Late gadolinium enhancement (LGE) is also present (arrows) in all 5 patients (F, G, H, I, and J; same patients as in A, B, C, D, and E, respectively). EGE and LGE predominantly affect subepicardium of the inferior, inferolateral, or anterolateral walls. EGE extends beyond confines of LGE in patient shown in (A) and (F) and in (B) and (G). Basilar LV involvement is present in patient shown in (A) and (F), (B) and (G), and (C) and (H). Mid-cavity LV involvement is present in patient shown in (D) and (I) and in (E) and (J). Chelala, et al. AJR article. Read more on this study.
Lung images of a post-COVID patient with a Siemens Naeotom Alpha photon-counting CT system. The photon-counting technology allows simultaneous acquisition and visualization of detailed structures (center image) combined with functional information (right image). For comparison is an image with conventional CT (left). Courtesy of Dr. J. Ferda, University Hospital Plzen, Czech Republic. Read more about this new scanner.
 There is a mismatch in the gas imaging phase (showing concentrations of the xenon gas in the left gas images), and the gas uptake phase where there are numerous areas where there is gas present but it cannot be transferred to the blood due to micro-emboli (seen in the right RBC images). Read more. Image courtesy of RSNA. There is a mismatch in the gas imaging phase (showing concentrations of the xenon gas in the left gas images), and the gas uptake phase where there are numerous areas where there is gas present but it cannot be transferred to the blood due to micro-emboli (seen in the right RBC images). Read more. Image courtesy of RSNA.
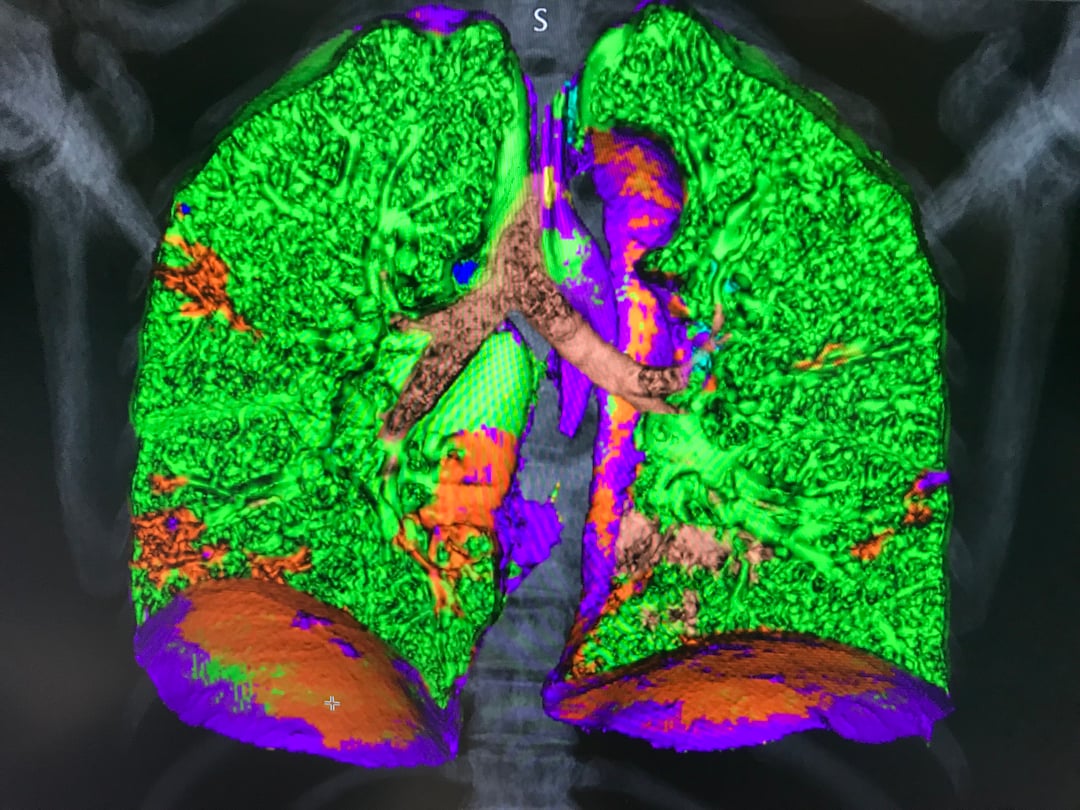
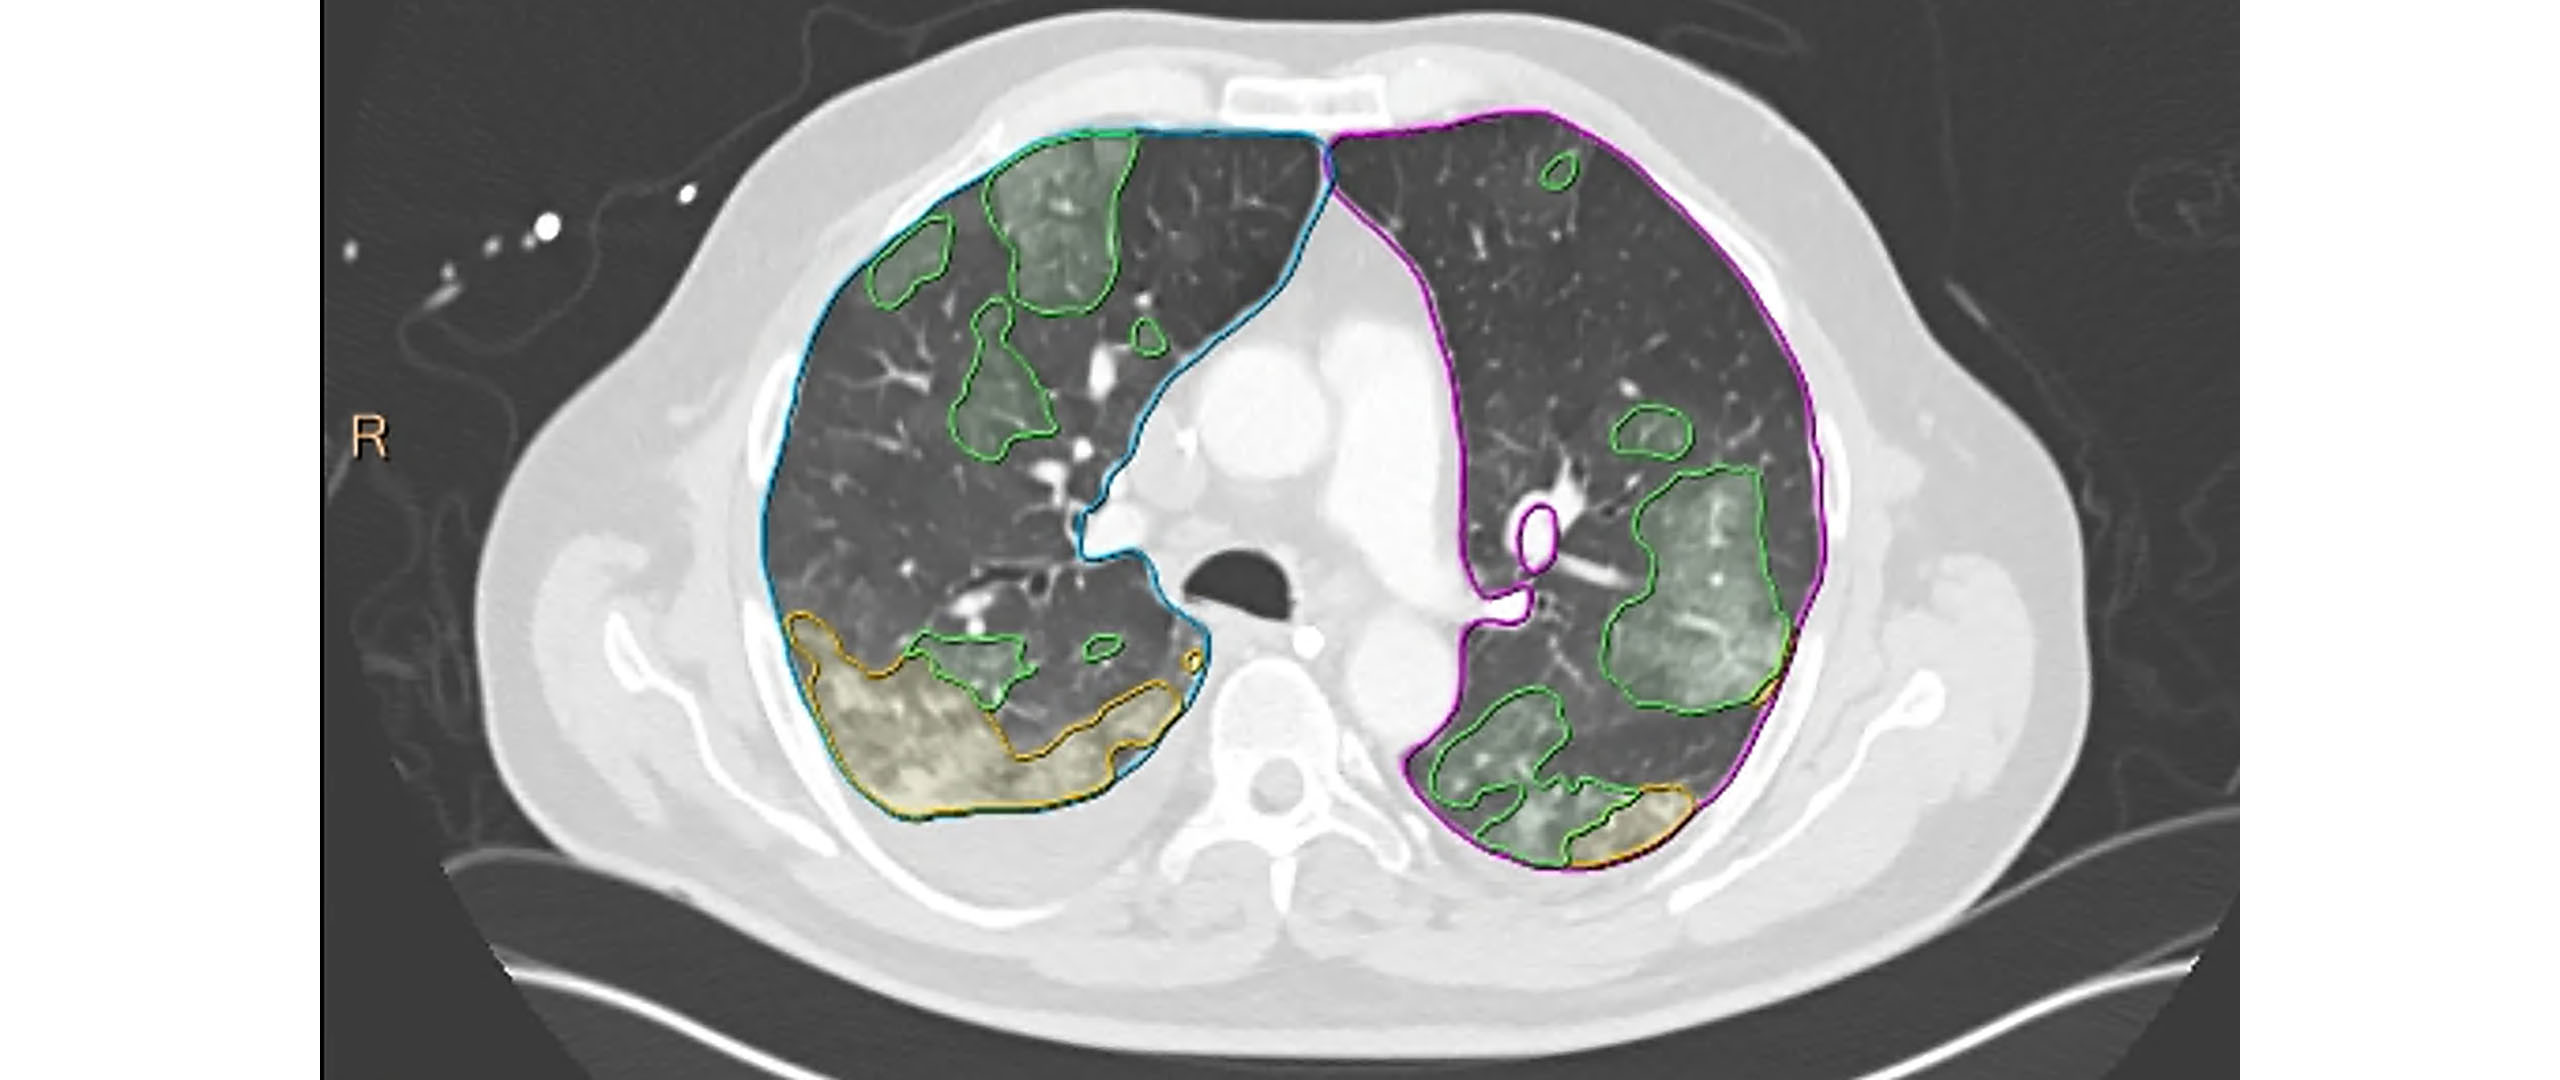
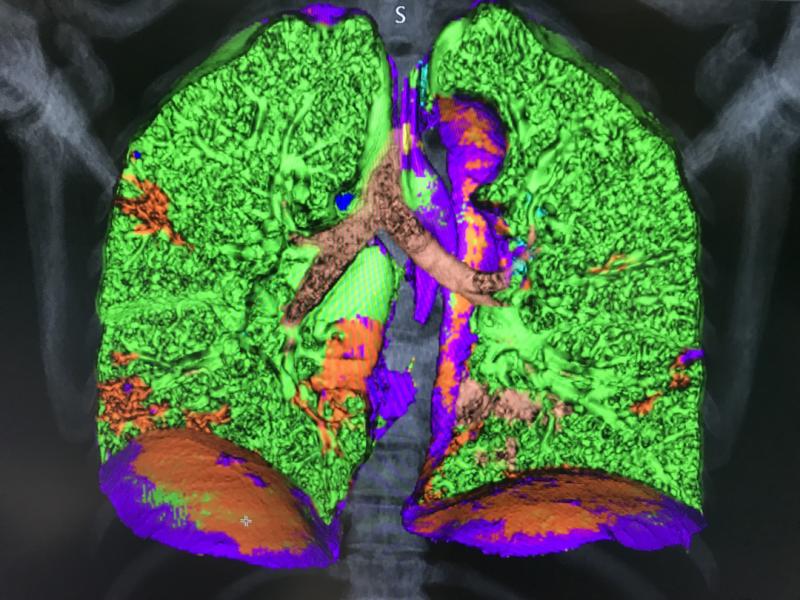 This is a COVID-19 patient's lungs on Canon’s new advanced visualization lung analysis tool. It uses both tissue density measured with the CT Hounsfield units and tissue texture to mark and quantify areas of COVID pneumonia consolidations. It was cleared under an FDA emergency use authorization and showed at the the 2021 HIMSS meeting. The green shows areas of normal lung, and areas of red are COVID. The software can auto quantify these areas to use as a baseline to assess long-haulers. This is a COVID-19 patient's lungs on Canon’s new advanced visualization lung analysis tool. It uses both tissue density measured with the CT Hounsfield units and tissue texture to mark and quantify areas of COVID pneumonia consolidations. It was cleared under an FDA emergency use authorization and showed at the the 2021 HIMSS meeting. The green shows areas of normal lung, and areas of red are COVID. The software can auto quantify these areas to use as a baseline to assess long-haulers.
An example of COVID-19 (SARS-CoV-2) pneumonia lung consolidation on ultrasound and related B-lines in the image. See this image in motion in the VIDEO: COVID Pneumonia Lung Consolidation on Ultrasound..
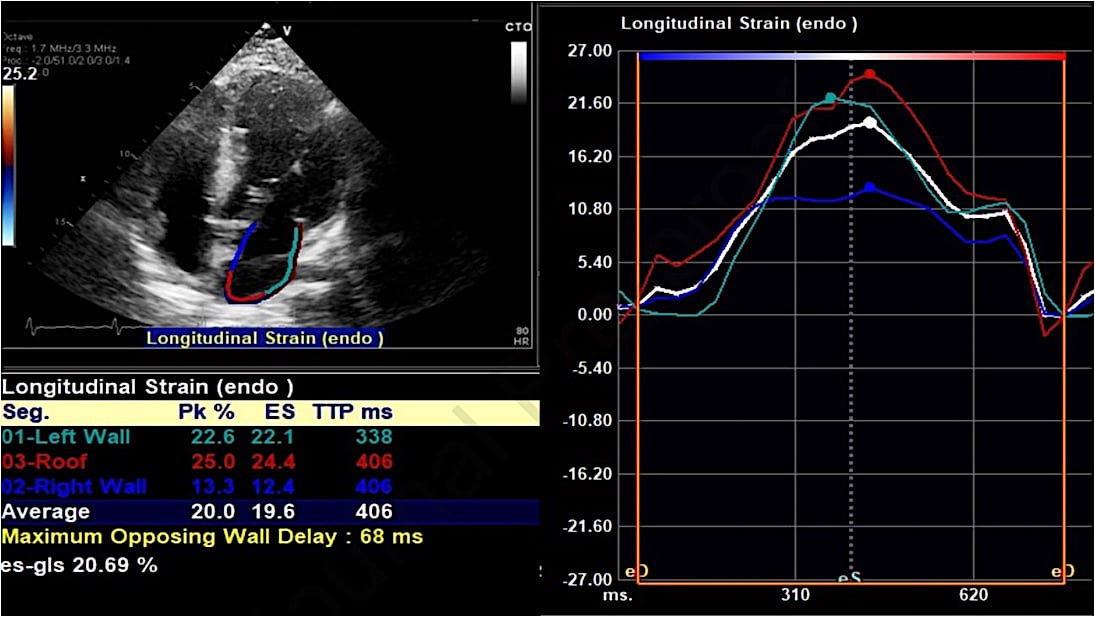
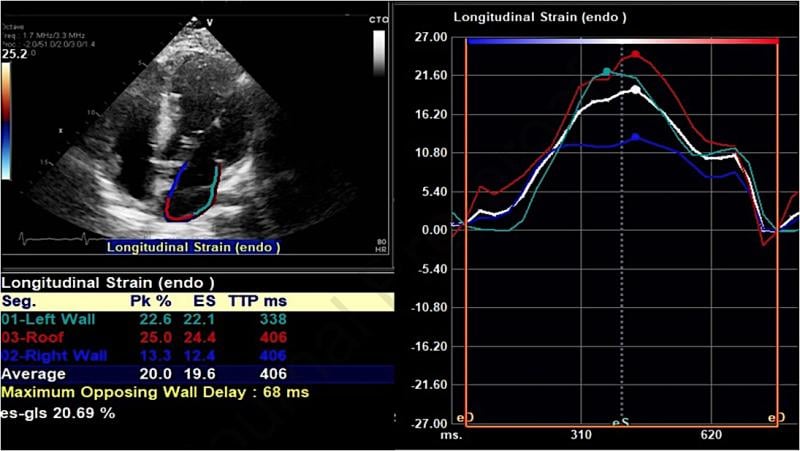 An example of a strain echo from the study showing reduced peak longitudinal/reservoir left atrial strain in a COVID-19 patient who developed atrial fibrillation during admission. A Average left atrial strain here is 20% (normal should be above 38%). Researchers at Johns Hopkins Medicine showed in a May 2021 Journal of the American Society of Echocardiography study that speckle-tracking strain echocardiograms may predict which patients with COVID-19 are most at risk of developing atrial fibrillation (AF). Read the study. An example of a strain echo from the study showing reduced peak longitudinal/reservoir left atrial strain in a COVID-19 patient who developed atrial fibrillation during admission. A Average left atrial strain here is 20% (normal should be above 38%). Researchers at Johns Hopkins Medicine showed in a May 2021 Journal of the American Society of Echocardiography study that speckle-tracking strain echocardiograms may predict which patients with COVID-19 are most at risk of developing atrial fibrillation (AF). Read the study.
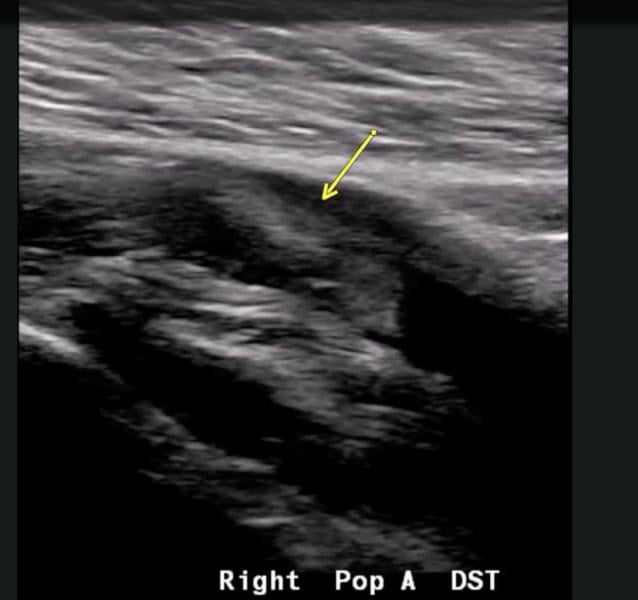 An example of popliteal artery thrombosis formation caused by COVID-19 (SARS-CoV-2). Coronavirus often caused thrombus formation in the body, leading to numerous types of complications, including pulmonary embolism, stroke, heart attack, deep vein thrombosis (DVT) and ischemia or infarcts in various organs. Watch this image in motion in the VIDEO: Example of COVID Thrombosis on Ultrasound Imaging. Image courtesy of Margarita Revzin et al. An example of popliteal artery thrombosis formation caused by COVID-19 (SARS-CoV-2). Coronavirus often caused thrombus formation in the body, leading to numerous types of complications, including pulmonary embolism, stroke, heart attack, deep vein thrombosis (DVT) and ischemia or infarcts in various organs. Watch this image in motion in the VIDEO: Example of COVID Thrombosis on Ultrasound Imaging. Image courtesy of Margarita Revzin et al.
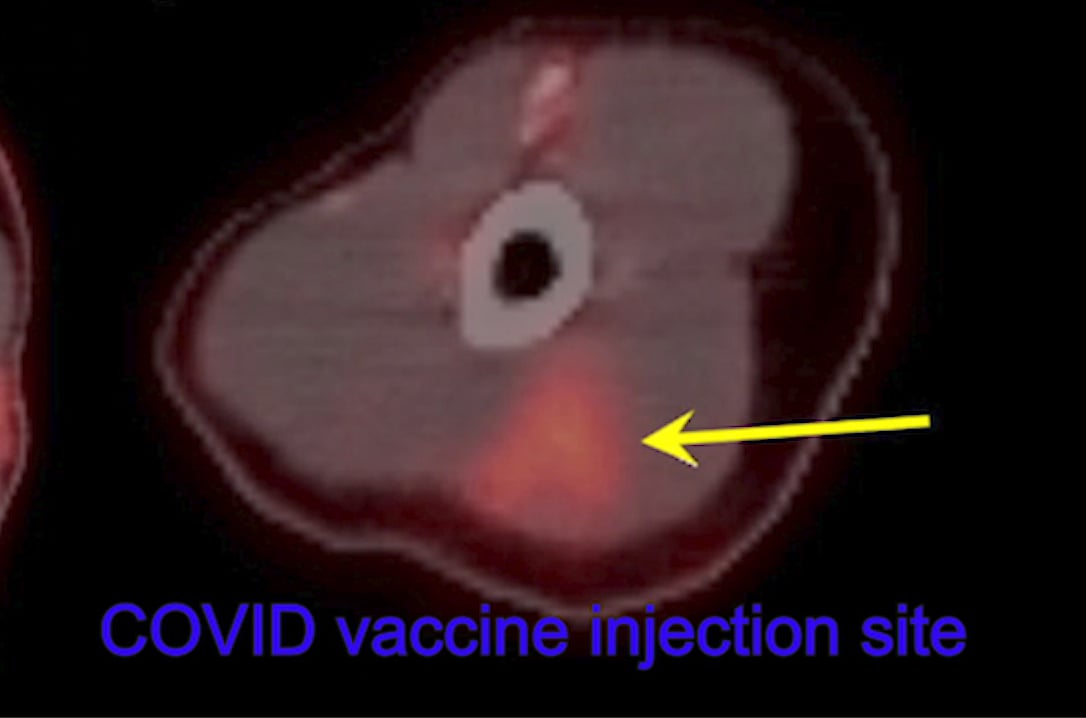
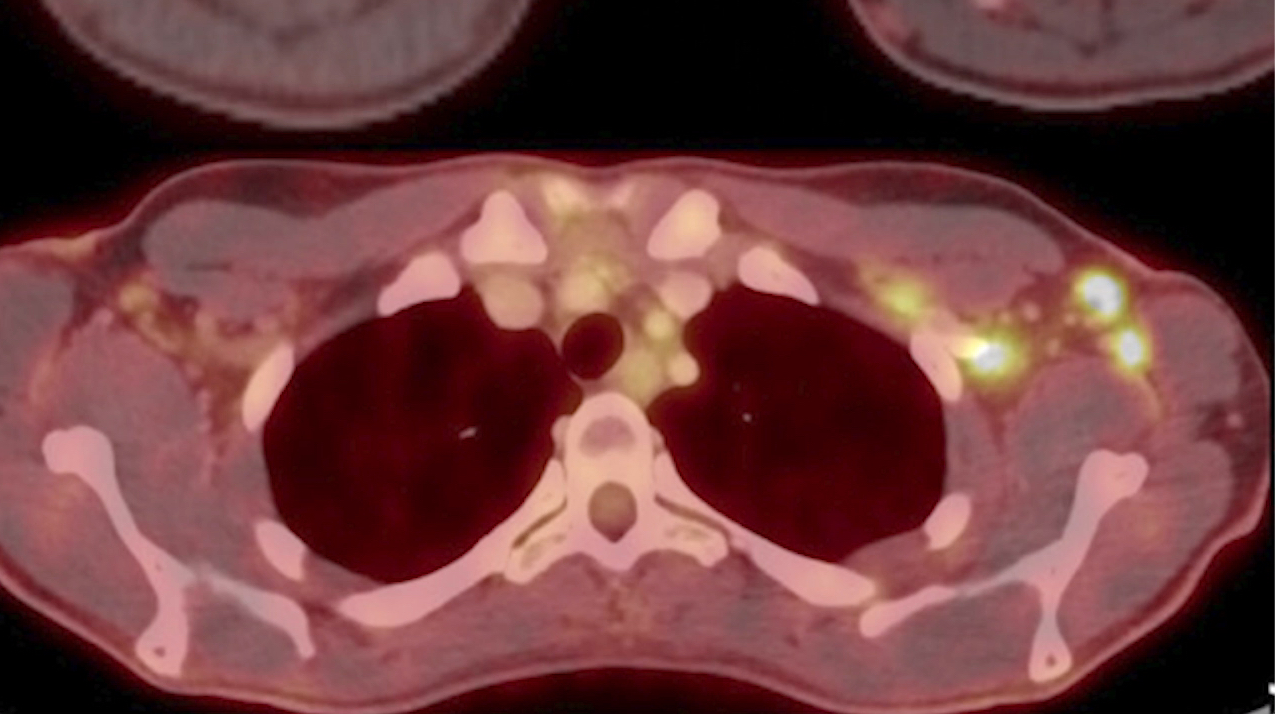
 Thirty-two-year-old female left arm shows hypermetabolic triangular shaped inflammation (arrow) at the COVID vaccine injection site on 18-FDG PET/CT. Read more in the original study. Image courtesy of RSNA. Thirty-two-year-old female left arm shows hypermetabolic triangular shaped inflammation (arrow) at the COVID vaccine injection site on 18-FDG PET/CT. Read more in the original study. Image courtesy of RSNA.
 This color-enhanced image, taken by scanning electron microscopy, shows huge quantities of SARS-CoV-2 particles (purple) that have burst out of kidney cells (green), which the virus hijacked for replication. The the bulging, spherical cells in the upper right and bottom left corners are distorted and about to burst from the viral particles inside, and are beginning to self-destruct. Image from NIAID Integrated Research Facility. Read more in the article Deconstructing the Infectious Machinery of SARS-CoV-2. This color-enhanced image, taken by scanning electron microscopy, shows huge quantities of SARS-CoV-2 particles (purple) that have burst out of kidney cells (green), which the virus hijacked for replication. The the bulging, spherical cells in the upper right and bottom left corners are distorted and about to burst from the viral particles inside, and are beginning to self-destruct. Image from NIAID Integrated Research Facility. Read more in the article Deconstructing the Infectious Machinery of SARS-CoV-2.
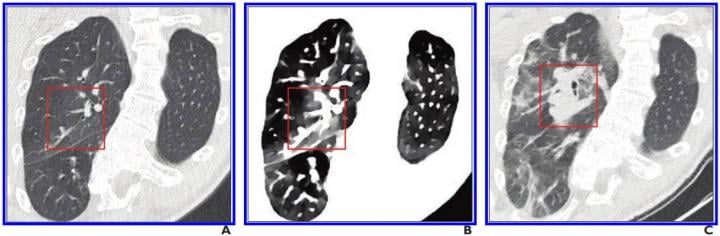
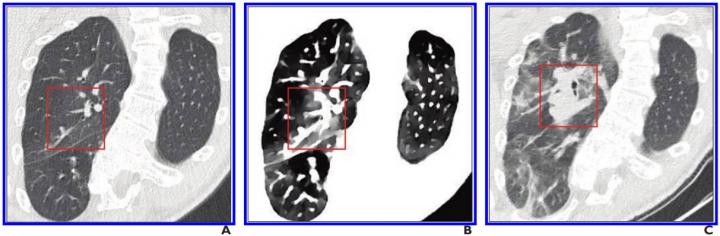
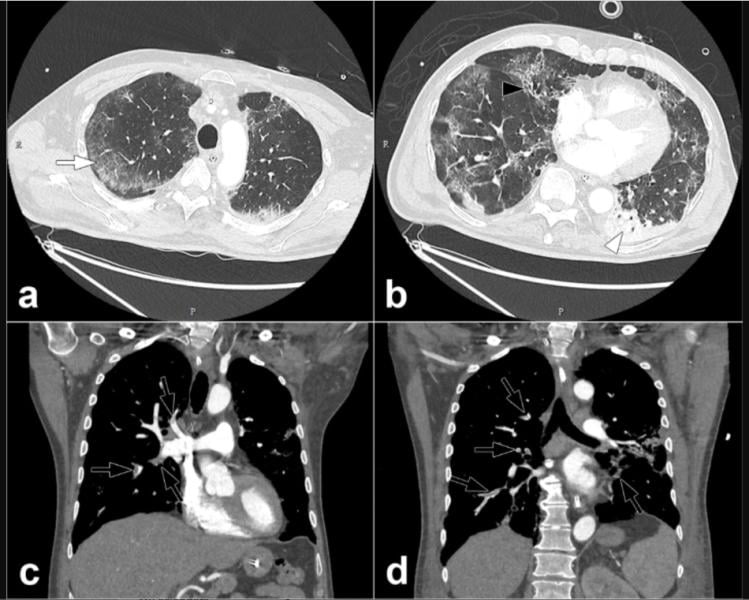
 A, Initial conventional axial CT image shows no noticeable lung damage (within red box) in right upper lobe. B, Electron density spectral CT image obtained at same time as image in A shows lesions (within red box) in right upper lobe. C, Follow-up conventional axial chest CT image obtained 5 days after images in A and B confirm presence of lesions (within red box) in right upper lobe. Read more. Image courtesy of the American Roentgen Ray Society (ARRS), American Journal of Roentgenology (AJR) A, Initial conventional axial CT image shows no noticeable lung damage (within red box) in right upper lobe. B, Electron density spectral CT image obtained at same time as image in A shows lesions (within red box) in right upper lobe. C, Follow-up conventional axial chest CT image obtained 5 days after images in A and B confirm presence of lesions (within red box) in right upper lobe. Read more. Image courtesy of the American Roentgen Ray Society (ARRS), American Journal of Roentgenology (AJR)
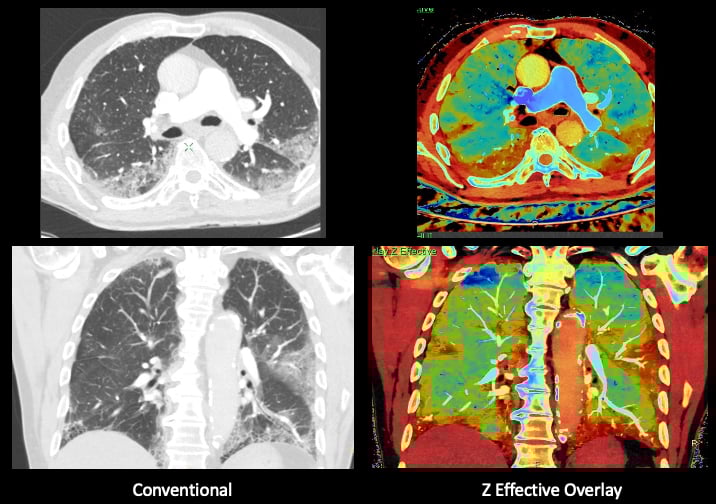
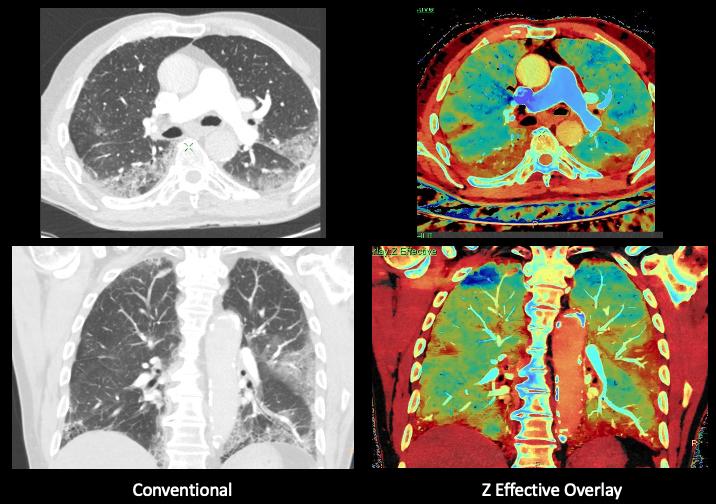 Elderly patient admitted with symptoms consistent with COVID-19. Due to the patient having a dry cough and shortness of breath, a CT was ordered. Images was performed on a Philips IQon spectral CT scanner. The pages show the conventional CT on the left and the Z effective spectral imaging on the same slice, showing areas of COVID pneumonia, including in areas that are not evident on the conventional CT. Image from Philips Healthcare. Elderly patient admitted with symptoms consistent with COVID-19. Due to the patient having a dry cough and shortness of breath, a CT was ordered. Images was performed on a Philips IQon spectral CT scanner. The pages show the conventional CT on the left and the Z effective spectral imaging on the same slice, showing areas of COVID pneumonia, including in areas that are not evident on the conventional CT. Image from Philips Healthcare.
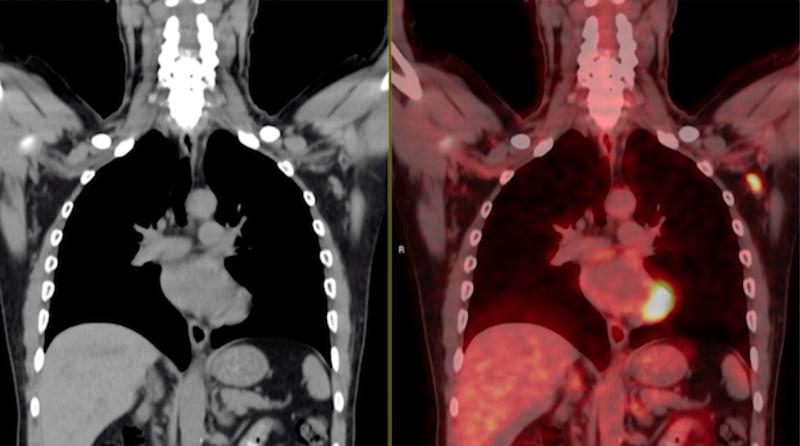
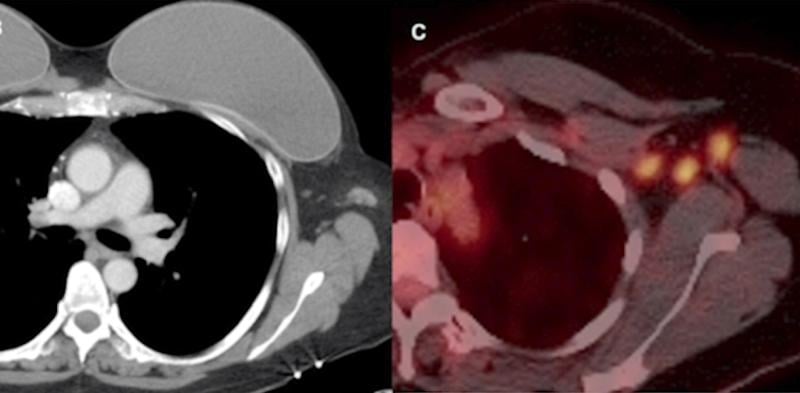 Example of vaccine-caused axillary adenopathy. A 46-year-old female with triple negative left breast cancer, disease free for three years. Left, surveillance contrast enhanced axial chest CT showed new left axillary lymphadenopathy with fat stranding 15 days after the first COVID-19 vaccine. Right, further evaluation with PET/CT six days after the 2nd dose of vaccine, demonstrated multiple enlarged hypermetabolic left axillary lymph nodes. Read more in the original study. Image courtesy of RSNA. Example of vaccine-caused axillary adenopathy. A 46-year-old female with triple negative left breast cancer, disease free for three years. Left, surveillance contrast enhanced axial chest CT showed new left axillary lymphadenopathy with fat stranding 15 days after the first COVID-19 vaccine. Right, further evaluation with PET/CT six days after the 2nd dose of vaccine, demonstrated multiple enlarged hypermetabolic left axillary lymph nodes. Read more in the original study. Image courtesy of RSNA.
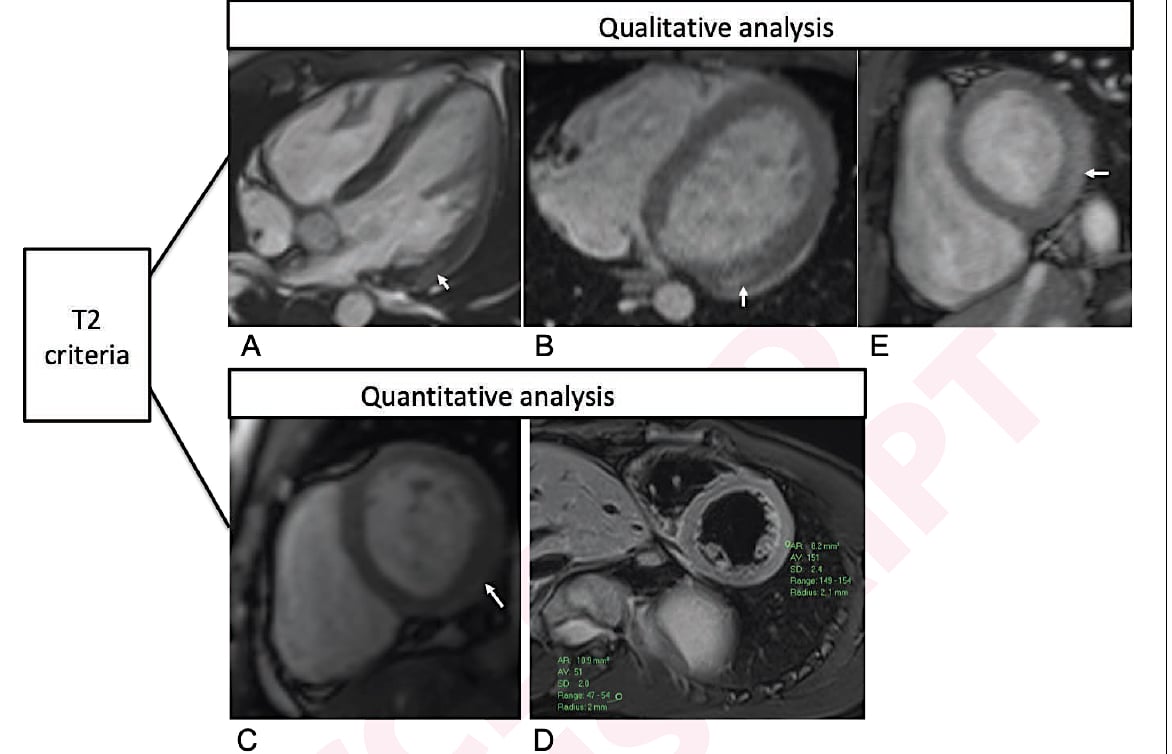
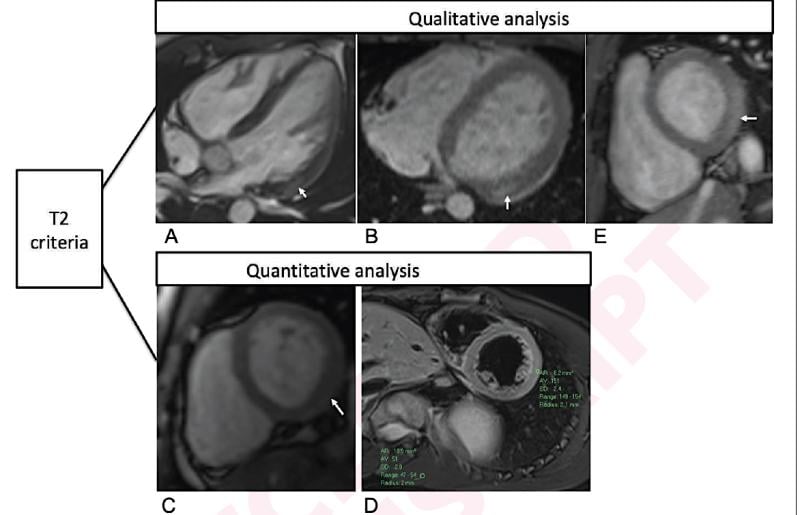 Qualitative and quantitative cardiac MRI T2-based criteria for myocarditis in patients caused by a recent COVID-19 mRNA vaccination. Qualitative criterion was focal myocardial edema and is shown on 4-chamber precontrast SSFP image (arrow) in 16-year-old male (A) and 17-year-old male (B). Quantitative criteria included T2 parametric mapping and quantification of myocardial signal intensity ratios. Focal subepicardial edema of the basilar left ventricular inferior wall (arrow) is shown on source image from T2 mapping in 17-year-old male (C). Increased myocardial signal intensity ratio of 3.0 at mid-cavity is shown in 19-year-old male (D). Qualitative focal myocardial edema is also shown on short-axis precontrast SSFP image (arrow) in 17-year-old male (E). Patients in A-E correspond with patients A-E in Table 1, respectively. Chelala, et al. AJR article. Read more on this study. Qualitative and quantitative cardiac MRI T2-based criteria for myocarditis in patients caused by a recent COVID-19 mRNA vaccination. Qualitative criterion was focal myocardial edema and is shown on 4-chamber precontrast SSFP image (arrow) in 16-year-old male (A) and 17-year-old male (B). Quantitative criteria included T2 parametric mapping and quantification of myocardial signal intensity ratios. Focal subepicardial edema of the basilar left ventricular inferior wall (arrow) is shown on source image from T2 mapping in 17-year-old male (C). Increased myocardial signal intensity ratio of 3.0 at mid-cavity is shown in 19-year-old male (D). Qualitative focal myocardial edema is also shown on short-axis precontrast SSFP image (arrow) in 17-year-old male (E). Patients in A-E correspond with patients A-E in Table 1, respectively. Chelala, et al. AJR article. Read more on this study.
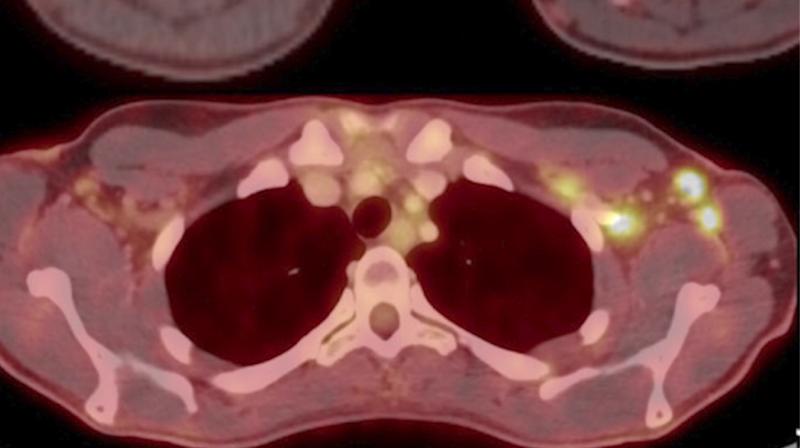 Thirty-two-year-old female cancer patient 18-FDG PET/CT axial fused images at the axilla level shows multiple new hypermetabolic lymph nodes due to COVID-19 vaccine. Read more in the original study. Image courtesy of RSNA. Thirty-two-year-old female cancer patient 18-FDG PET/CT axial fused images at the axilla level shows multiple new hypermetabolic lymph nodes due to COVID-19 vaccine. Read more in the original study. Image courtesy of RSNA.
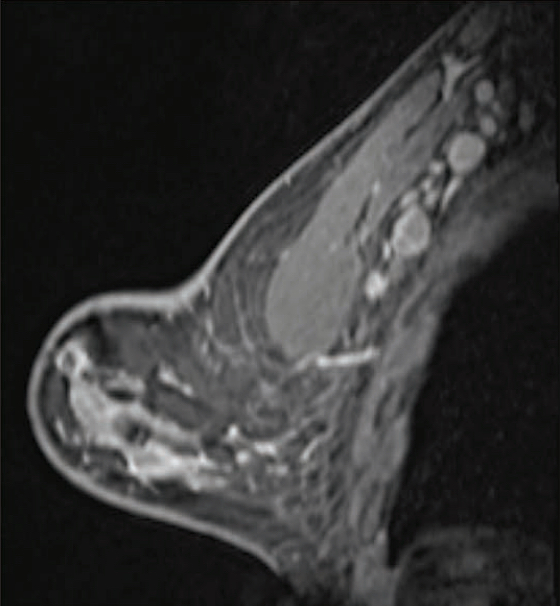
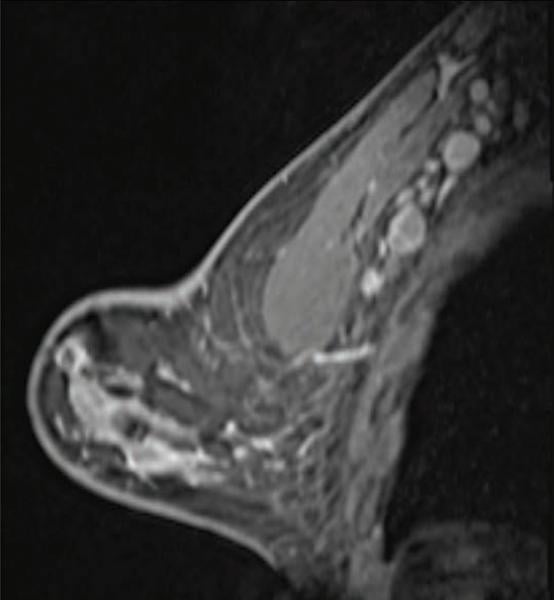 The COVID-19 vaccines have been found to cause adenopathy, inflammation of glandular tissue or lymph nodes, which can show up as a concern on screening mammography. This image shows a 41-year-old woman who underwent high-risk screening breast MRI 15 days after first COVID-19 vaccination dose. Sagittal T1-weighted fat-saturated contrast-enhanced MRI shows extensive unilateral left level I-II axillary adenopathy. BI-RADS 3 was assigned. Read more from this February 2021 study. The COVID-19 vaccines have been found to cause adenopathy, inflammation of glandular tissue or lymph nodes, which can show up as a concern on screening mammography. This image shows a 41-year-old woman who underwent high-risk screening breast MRI 15 days after first COVID-19 vaccination dose. Sagittal T1-weighted fat-saturated contrast-enhanced MRI shows extensive unilateral left level I-II axillary adenopathy. BI-RADS 3 was assigned. Read more from this February 2021 study.
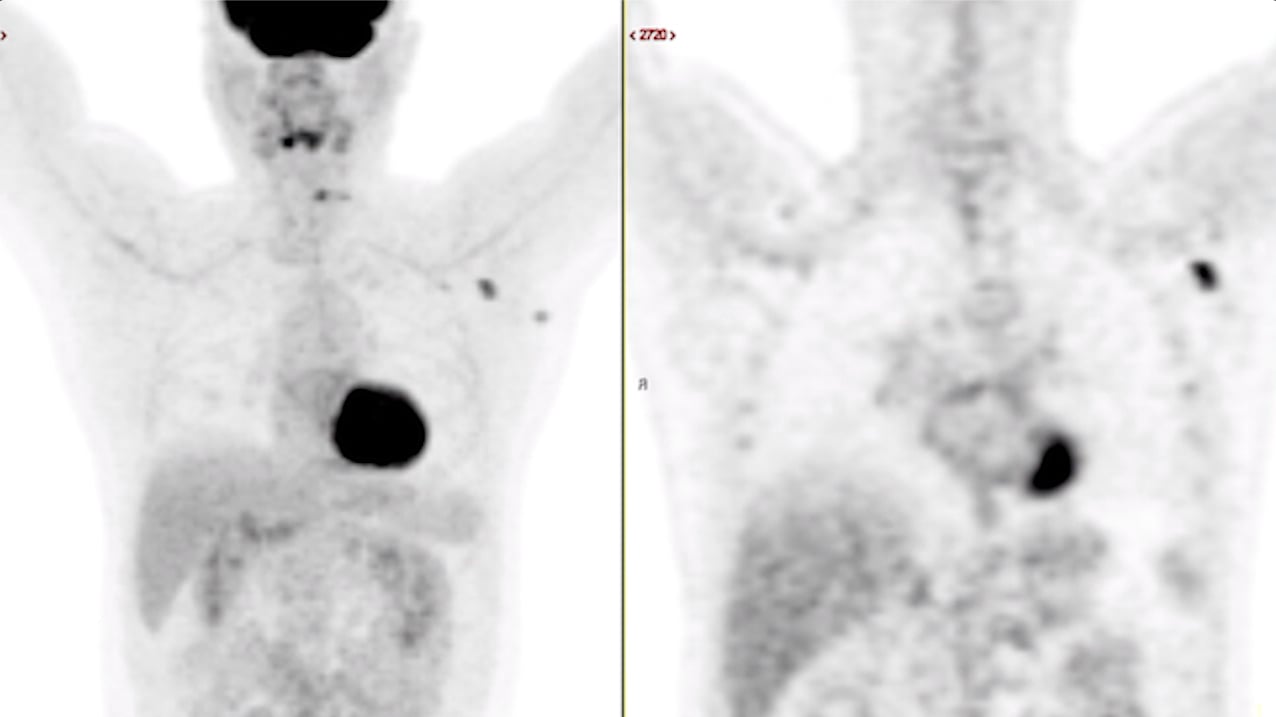
 A 63-year-old multiple myeloma patient with skeletal pain showing new FDG PET-CT avid axillary lymphadenopathy 62 days (9 weeks) after second COVID-19 mRNA vaccination dose. The uptake in the lymph node is typical of vaccinated patients, with the adenopathy occuring on the side with the arm that was vaccinated. Read more in the original study. Image courtesy of RSNA. A 63-year-old multiple myeloma patient with skeletal pain showing new FDG PET-CT avid axillary lymphadenopathy 62 days (9 weeks) after second COVID-19 mRNA vaccination dose. The uptake in the lymph node is typical of vaccinated patients, with the adenopathy occuring on the side with the arm that was vaccinated. Read more in the original study. Image courtesy of RSNA.
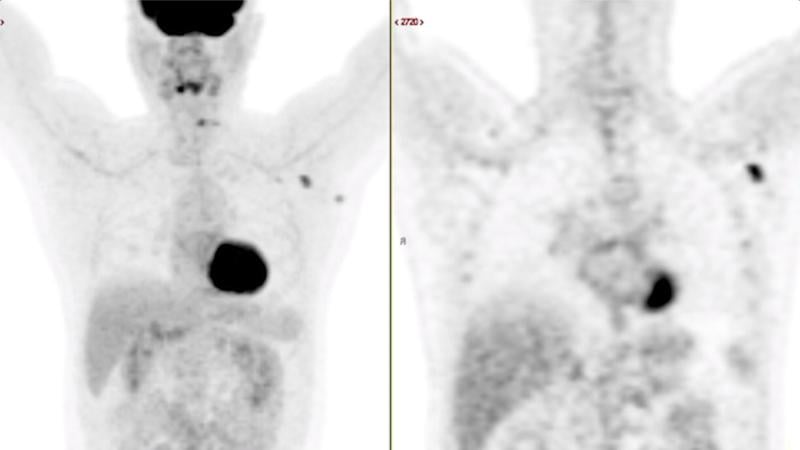 A 63-year-old multiple myeloma patient with skeletal pain showing new FDG PET-CT avid axillary lymphadenopathy 62 days (9 weeks) after second COVID-19 mRNA vaccination dose. The uptake in the lymph node is typical of vaccinated patients, with the adenopathy occuring on the side with the arm that was vaccinated. Read more in the original study. Image courtesy of RSNA. A 63-year-old multiple myeloma patient with skeletal pain showing new FDG PET-CT avid axillary lymphadenopathy 62 days (9 weeks) after second COVID-19 mRNA vaccination dose. The uptake in the lymph node is typical of vaccinated patients, with the adenopathy occuring on the side with the arm that was vaccinated. Read more in the original study. Image courtesy of RSNA.
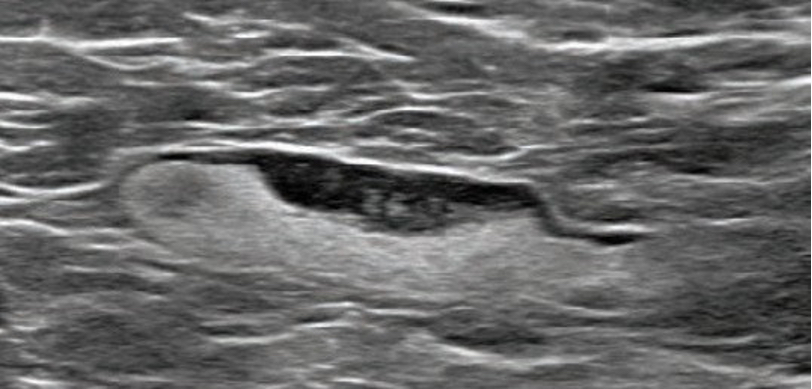
 The COVID-19 vaccines have been found to cause adenopathy, inflammation of glandular tissue or lymph nodes, which can show up as a concern on screening mammography. This image shows a 55-year-old woman who underwent screening mammogram and ultrasound 7 days after first COVID-19 vaccination dose. Mammogram and ultrasound demonstrated unilateral left axillary lymph node with cortical thickness of 5 mm on ultrasound (not shown). BI-RADS category 0 was assigned. Ultrasound from diagnostic work-up performed 7 days later showed no change in lymph node size. BI-RADS 3 was assigned. Read more from this February 2021 study. The COVID-19 vaccines have been found to cause adenopathy, inflammation of glandular tissue or lymph nodes, which can show up as a concern on screening mammography. This image shows a 55-year-old woman who underwent screening mammogram and ultrasound 7 days after first COVID-19 vaccination dose. Mammogram and ultrasound demonstrated unilateral left axillary lymph node with cortical thickness of 5 mm on ultrasound (not shown). BI-RADS category 0 was assigned. Ultrasound from diagnostic work-up performed 7 days later showed no change in lymph node size. BI-RADS 3 was assigned. Read more from this February 2021 study.
 COVID-19 caused pulmonary edema in a 50-year-old woman with a history of end-stage renal disease who underwent hemodialysis and who was admitted to the hospital for hypoxia and pneumonia. Axial contrast-enhanced chest CT obtained after 1 month for persistent hypoxemia show pulmonary edema, increasing small bilateral pleural effusions, cardiomegaly, prominent interlobular septal (arrowheads) and peribronchovascular (arrow) thickening, and diffuse ground-glass opacities. Pulmonary edema superimposed on the typical COVID-19 pneumonia. Rezvin et al. Radiogrophics COVID-19 caused pulmonary edema in a 50-year-old woman with a history of end-stage renal disease who underwent hemodialysis and who was admitted to the hospital for hypoxia and pneumonia. Axial contrast-enhanced chest CT obtained after 1 month for persistent hypoxemia show pulmonary edema, increasing small bilateral pleural effusions, cardiomegaly, prominent interlobular septal (arrowheads) and peribronchovascular (arrow) thickening, and diffuse ground-glass opacities. Pulmonary edema superimposed on the typical COVID-19 pneumonia. Rezvin et al. Radiogrophics
 MRI scan of heart damaged by COVID, which can cause myocarditis, infarction and/or ischemia. Blue means reduced blood flow, orange is good blood flow. In this figure the inferior part of the heart shows dark blue, so the myocardial blood flow is very reduced. The angiogram shows the coronary artery which supplies the blood to this part of the heart is occluded. The three colored MRI images show different slices of the heart — the basal mid and apical slices. Read more. Image courtesy of European Heart Journal MRI scan of heart damaged by COVID, which can cause myocarditis, infarction and/or ischemia. Blue means reduced blood flow, orange is good blood flow. In this figure the inferior part of the heart shows dark blue, so the myocardial blood flow is very reduced. The angiogram shows the coronary artery which supplies the blood to this part of the heart is occluded. The three colored MRI images show different slices of the heart — the basal mid and apical slices. Read more. Image courtesy of European Heart Journal
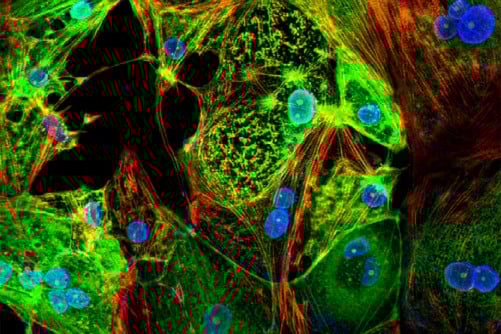
 A study from Washington University School of Medicine in St. Louis provides evidence that the coronavirus can invade and replicate inside heart muscle cells, causing cell death and interfering with heart muscle contraction. The image of engineered heart tissue shows human heart muscle cells (red) infected with COVID-19 (SARS-CoV-2) (green). Read more. Image by Lina Greenberg. A study from Washington University School of Medicine in St. Louis provides evidence that the coronavirus can invade and replicate inside heart muscle cells, causing cell death and interfering with heart muscle contraction. The image of engineered heart tissue shows human heart muscle cells (red) infected with COVID-19 (SARS-CoV-2) (green). Read more. Image by Lina Greenberg.
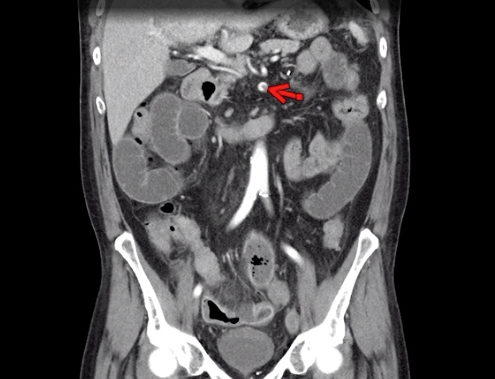
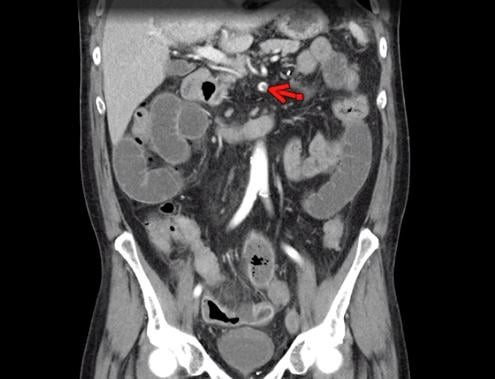
 Example of kidney infarct organ damage caused by COVID-caused clotting in a 57-year-old man with COVID-19 who presented with abdominal pain. Image courtesy of Margarita Rezvin et al. Read more on the trials examining the use of anticoagulation to treat COVID clotting. Example of kidney infarct organ damage caused by COVID-caused clotting in a 57-year-old man with COVID-19 who presented with abdominal pain. Image courtesy of Margarita Rezvin et al. Read more on the trials examining the use of anticoagulation to treat COVID clotting.
 COVID-19 causes blood clots throughout the body in patients with moderate to severe disease. This is a thrombus formation in the aortic arch in a 46-year-old COVID patients in the ICU. Three trials are underway in late to find which anticoagulant strategy is best to treat moderate and critically ill patients where COVID-causes venous thrombo-embolism (VTE) is a major cause of complications. Read more on the trials. Image courtesy of Margarita Revzin et al. COVID-19 causes blood clots throughout the body in patients with moderate to severe disease. This is a thrombus formation in the aortic arch in a 46-year-old COVID patients in the ICU. Three trials are underway in late to find which anticoagulant strategy is best to treat moderate and critically ill patients where COVID-causes venous thrombo-embolism (VTE) is a major cause of complications. Read more on the trials. Image courtesy of Margarita Revzin et al.
 A saddle embolus in a CT scan of a 52-year-old male patient presenting in the emergency department with hypoxia and tachycardia. Image courtesy of Margarita Revzin et al. A saddle embolus in a CT scan of a 52-year-old male patient presenting in the emergency department with hypoxia and tachycardia. Image courtesy of Margarita Revzin et al.
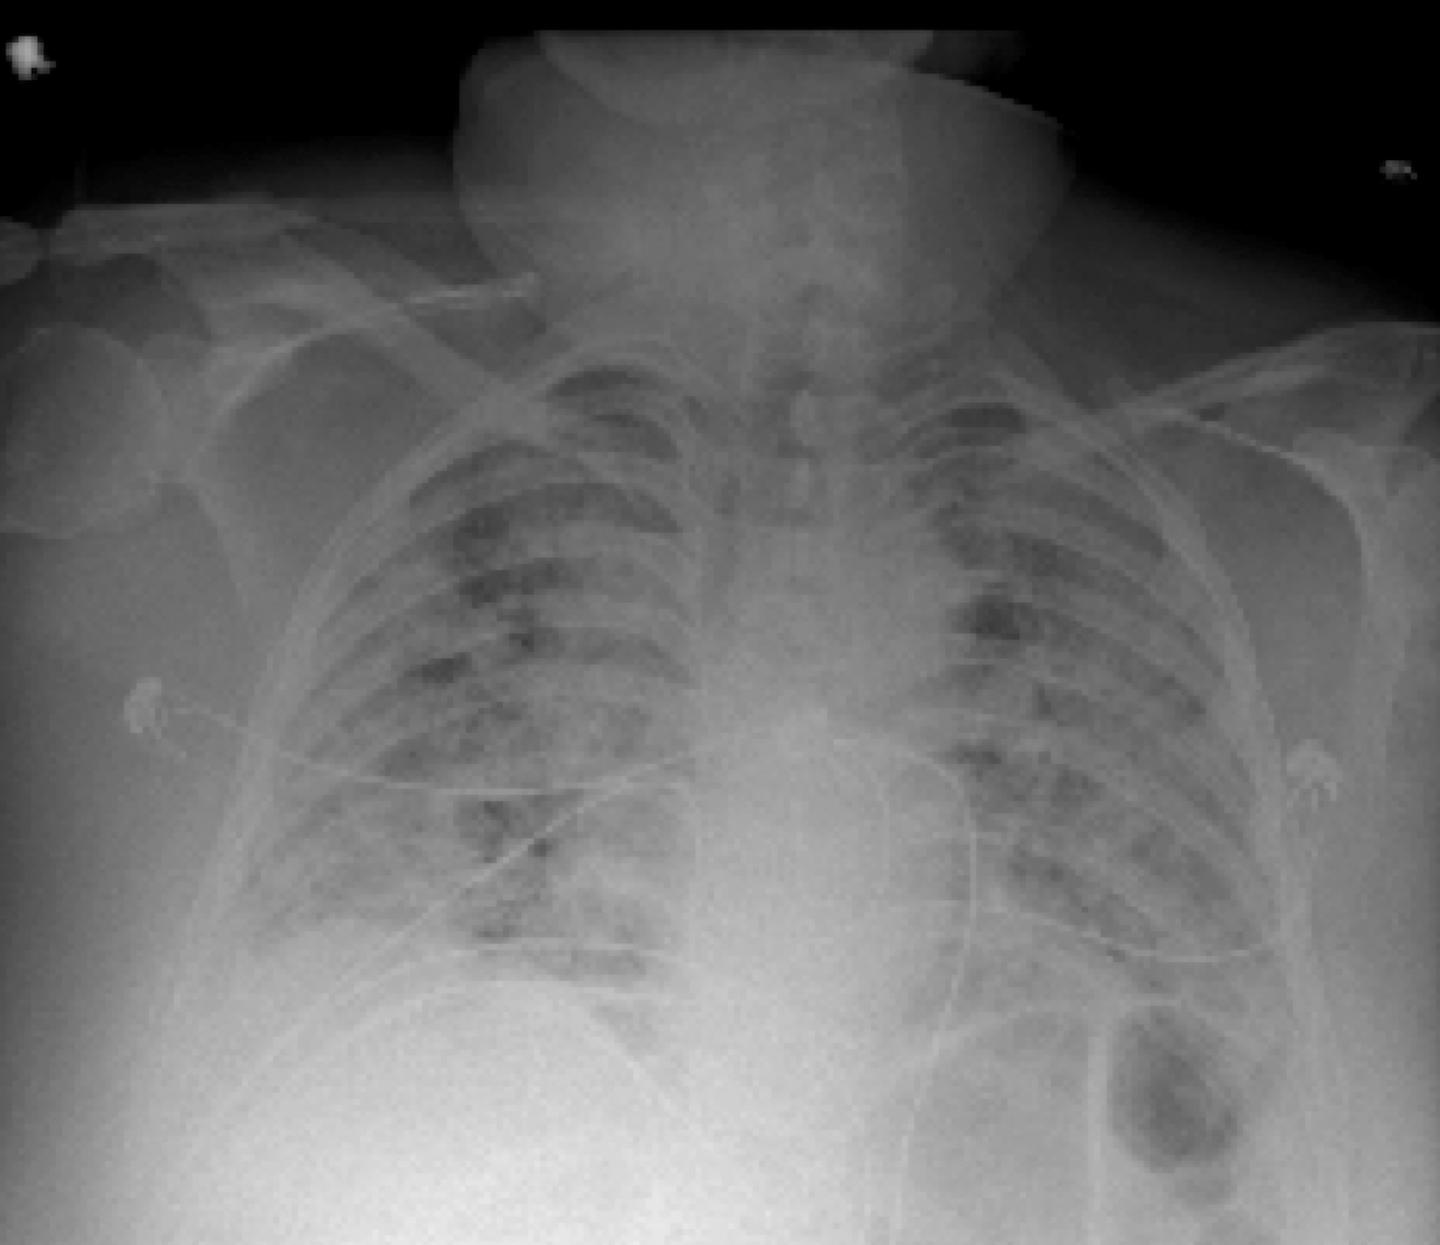
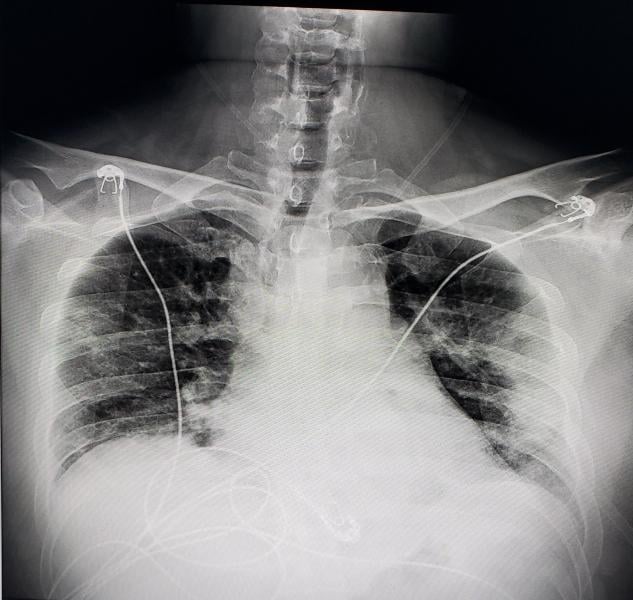
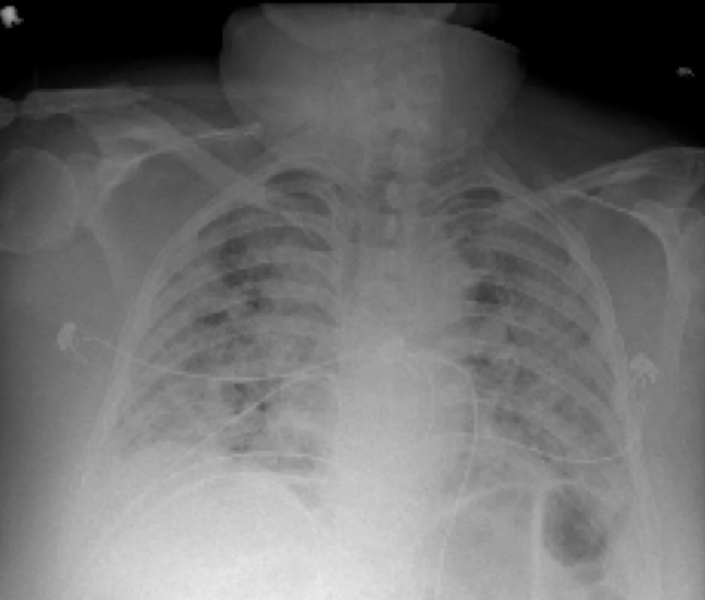
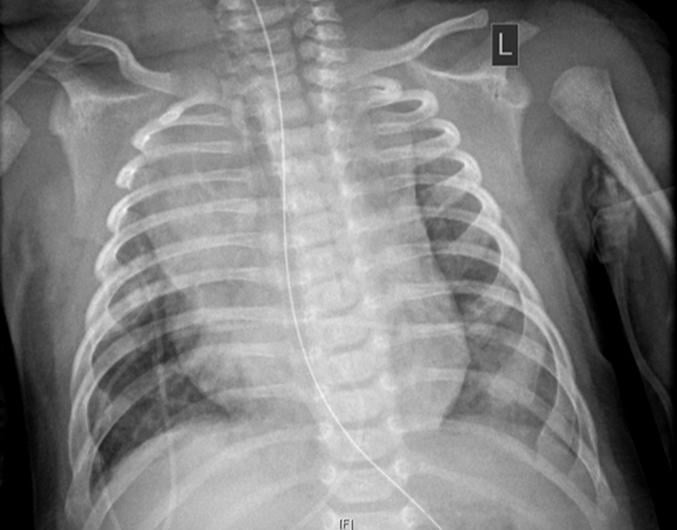 Chest X-ray of a 2-month-old infant diagnosed with COVID-19 showing an enlarged heart, bibasilar opacities caused by collapse of the lower sections of lungs, and right upper lobe atelectasis (lung collapse). Find more information and figures on this patient case. Chest X-ray of a 2-month-old infant diagnosed with COVID-19 showing an enlarged heart, bibasilar opacities caused by collapse of the lower sections of lungs, and right upper lobe atelectasis (lung collapse). Find more information and figures on this patient case.
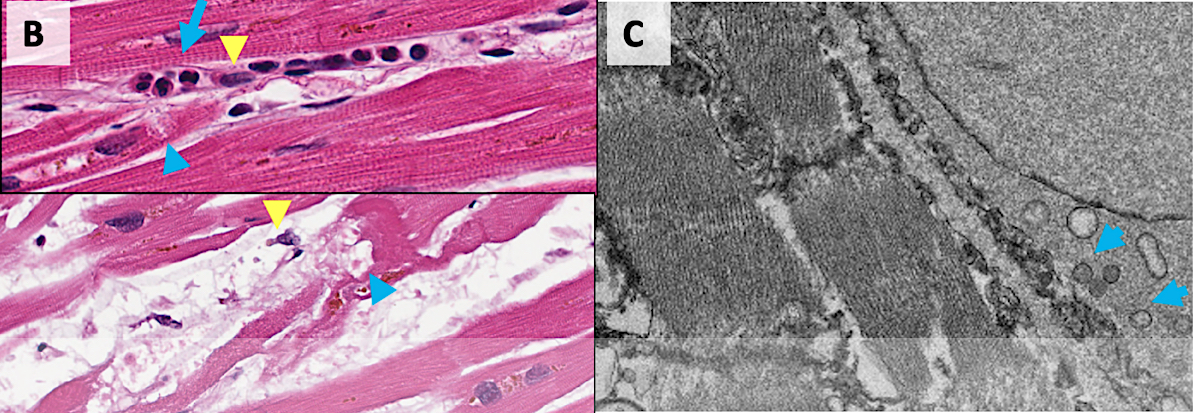
 Damage from COVID to myocardial cells in the hearts of patients who died of the virus. COVID-19 kills cardiomyocytes in random patterns. This may be the cause of some heart issues during COVID infection, but the long term consequences are not yet known in long-hauler COVID patients. Read more. Image from Circulation. Damage from COVID to myocardial cells in the hearts of patients who died of the virus. COVID-19 kills cardiomyocytes in random patterns. This may be the cause of some heart issues during COVID infection, but the long term consequences are not yet known in long-hauler COVID patients. Read more. Image from Circulation.
 Digital radiography (DR) chest X-ray of a COVID-19 patient from Texas, showing COVID pneumonia along the sides of the chest walls. Photo from radiologist John Kim, M.D. Digital radiography (DR) chest X-ray of a COVID-19 patient from Texas, showing COVID pneumonia along the sides of the chest walls. Photo from radiologist John Kim, M.D.
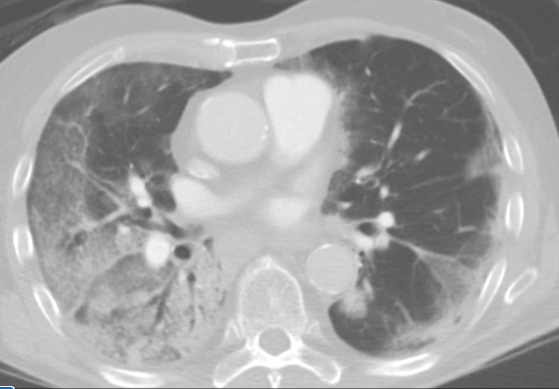
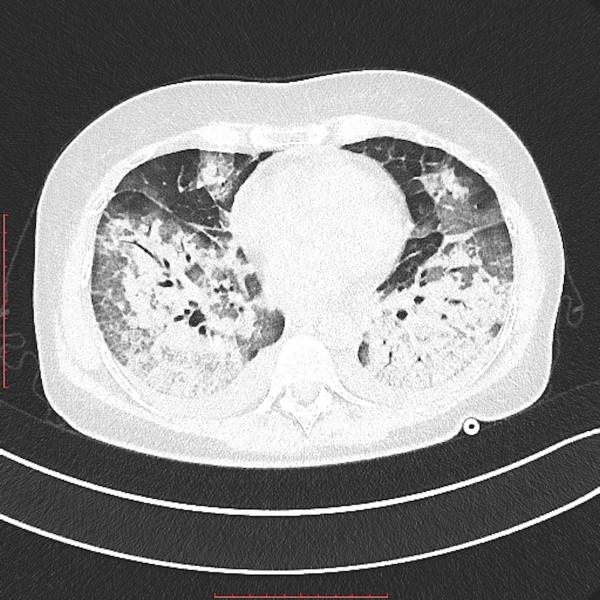 Transverse view of as lung CT showing heavy areas of COVID pneumonia in the lungs. The heart is in the center on the image. Getty Images Transverse view of as lung CT showing heavy areas of COVID pneumonia in the lungs. The heart is in the center on the image. Getty Images
 Brachial artery thrombosis in a 51-year-old man who presented to the emergency department with acute left upper extremity pain and numbness. The patient had a 2-week history of cough and fever and was confirmed to be COVID-19 positive. (a) Coronal left upper extremity CT angiographic image shows an abrupt segmental occlusion (arrow) of the distal left brachial artery, indicative of peripheral arterial thromboembolization. Coronal three-dimensional maximum intensity projection shows abrupt cutoff (arrow) of the left brachial artery. Image courtesy of Margarita Revzin et al. Brachial artery thrombosis in a 51-year-old man who presented to the emergency department with acute left upper extremity pain and numbness. The patient had a 2-week history of cough and fever and was confirmed to be COVID-19 positive. (a) Coronal left upper extremity CT angiographic image shows an abrupt segmental occlusion (arrow) of the distal left brachial artery, indicative of peripheral arterial thromboembolization. Coronal three-dimensional maximum intensity projection shows abrupt cutoff (arrow) of the left brachial artery. Image courtesy of Margarita Revzin et al.
 Image courtesy of Margarita Revzin et al. Image courtesy of Margarita Revzin et al.
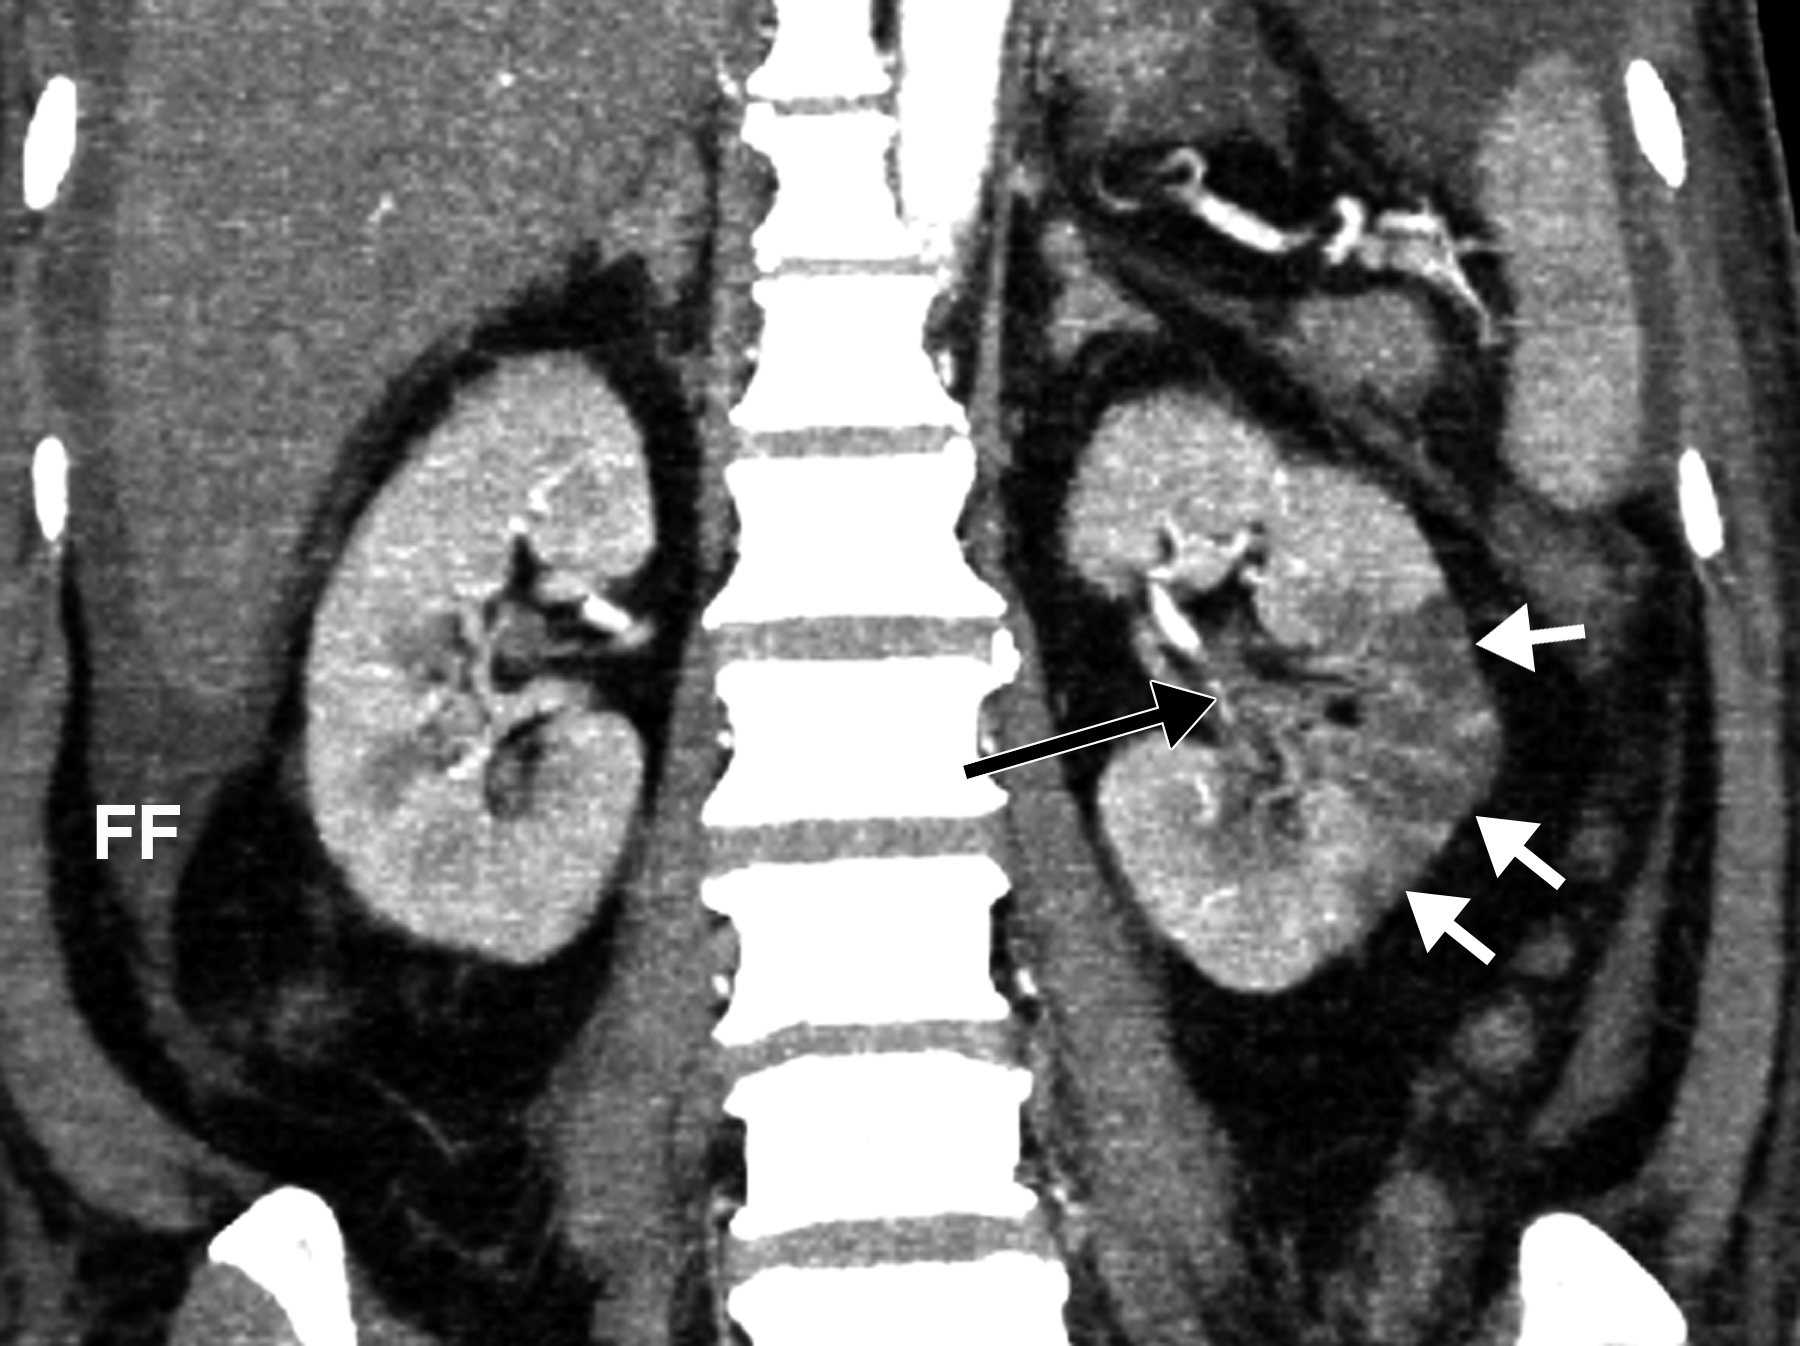
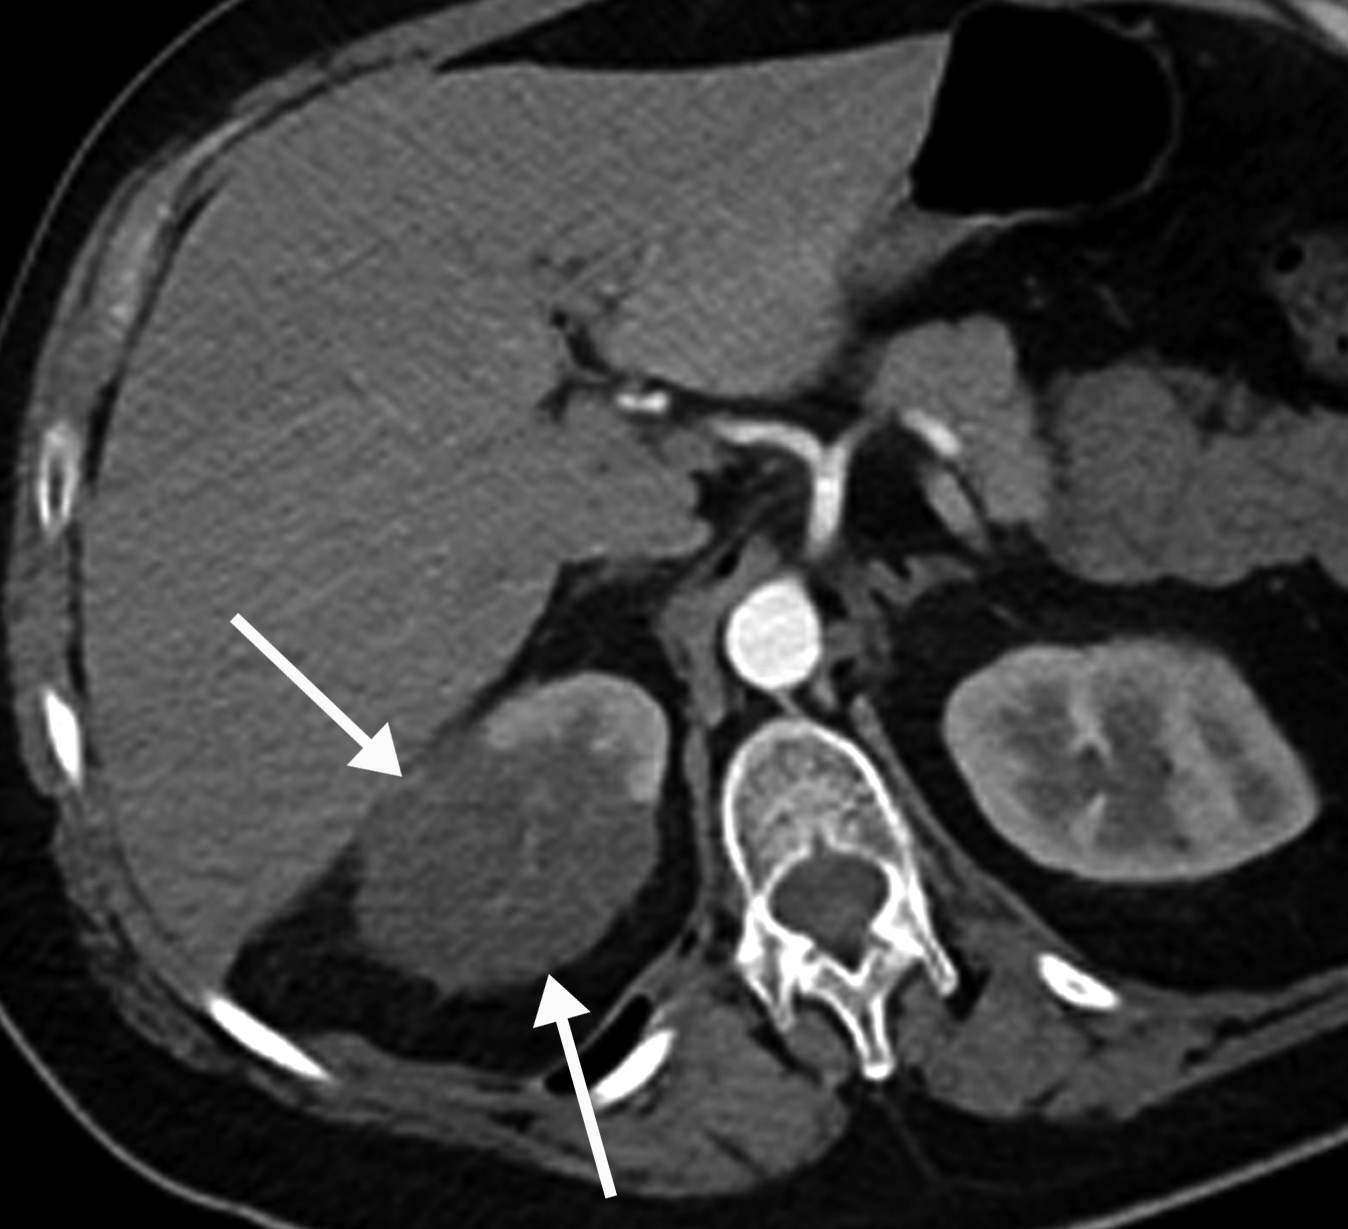
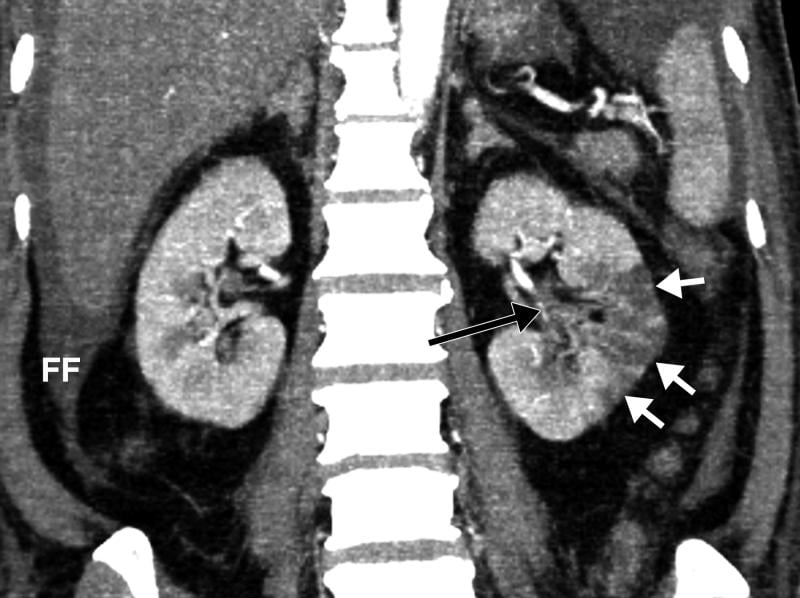
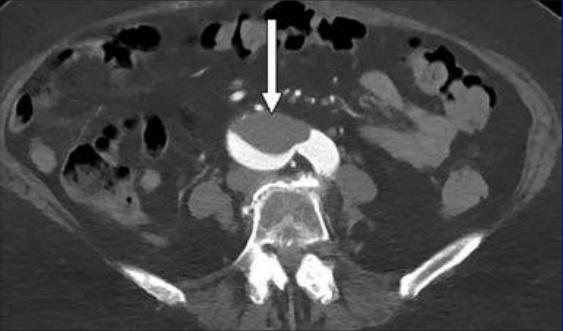
 Renal infarct in a 51-year-old man. The patient had a 2-week history of cough and fever and was confirmed to be COVID-19 positive. Axial chest CT angiographic images show the typical appearance of lung changes in COVID-19 pneumonia. Further review of the dataset showed a sharp well-defined area of nonenhancement in the partially imaged upper pole of the right kidney, a finding indicative of a renal infarct (arrows). COVID causes clot formation throughout the body in some patients, leading to organ infarcts like this, stroke and PE. Image courtesy of Margarita Revzin et al. Renal infarct in a 51-year-old man. The patient had a 2-week history of cough and fever and was confirmed to be COVID-19 positive. Axial chest CT angiographic images show the typical appearance of lung changes in COVID-19 pneumonia. Further review of the dataset showed a sharp well-defined area of nonenhancement in the partially imaged upper pole of the right kidney, a finding indicative of a renal infarct (arrows). COVID causes clot formation throughout the body in some patients, leading to organ infarcts like this, stroke and PE. Image courtesy of Margarita Revzin et al.
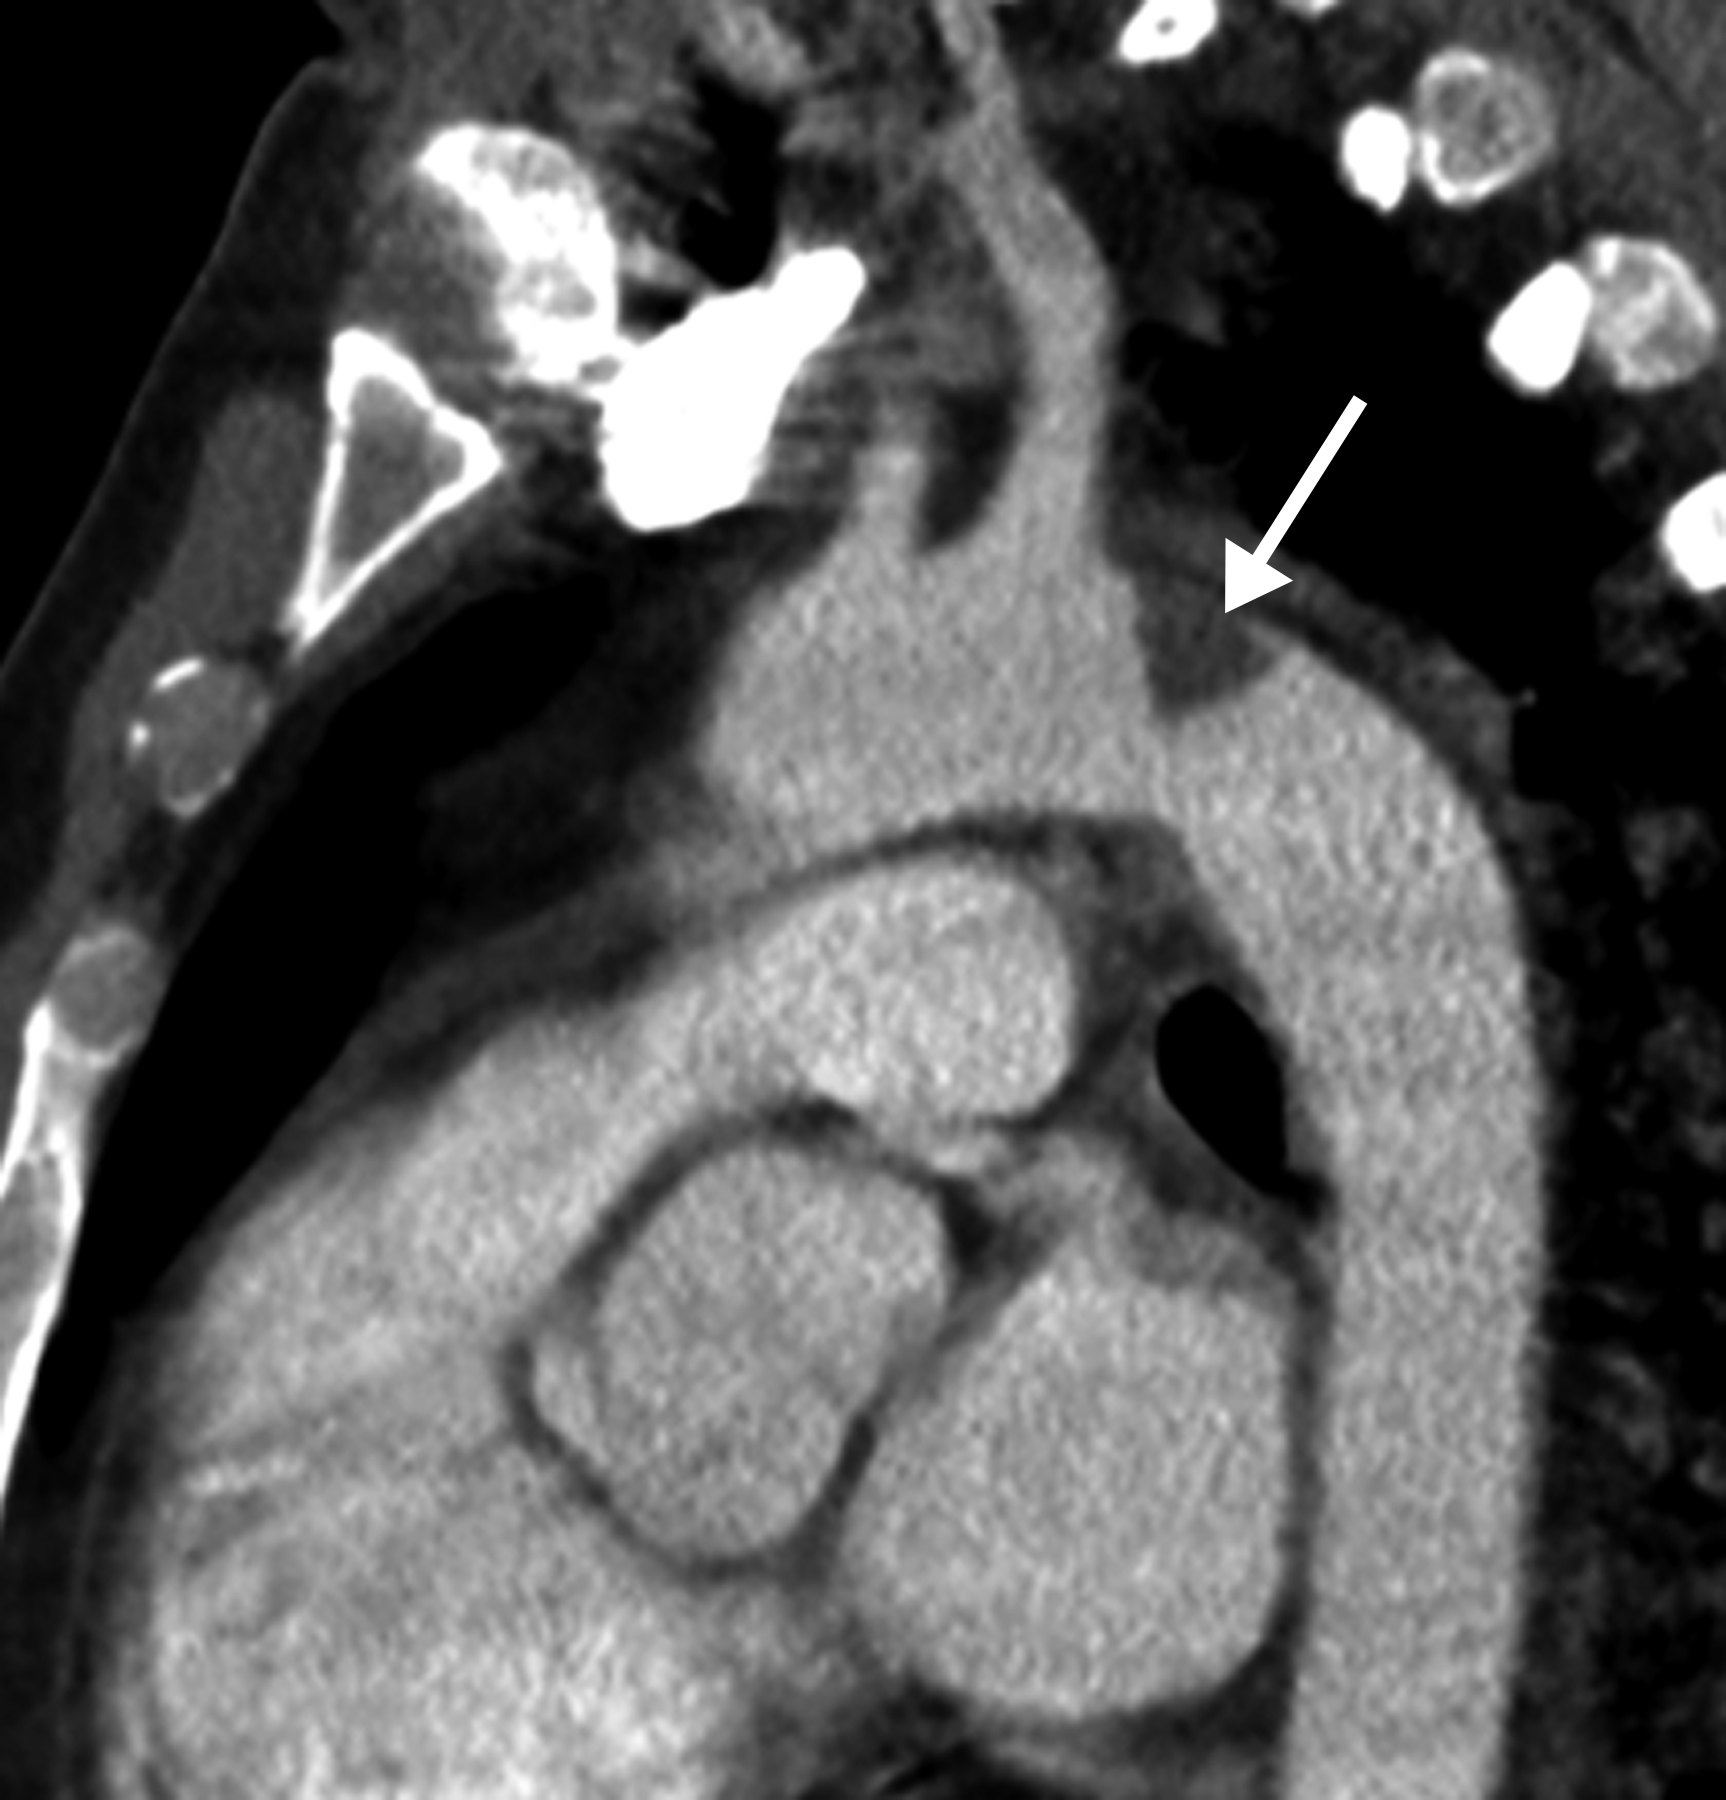
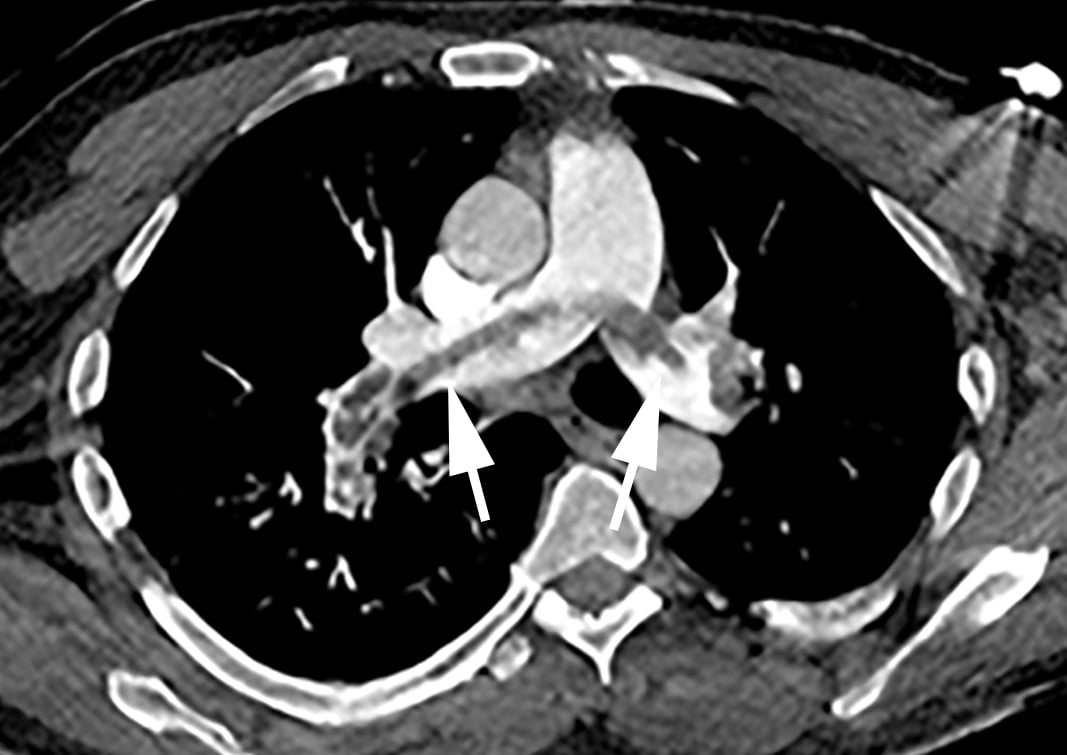
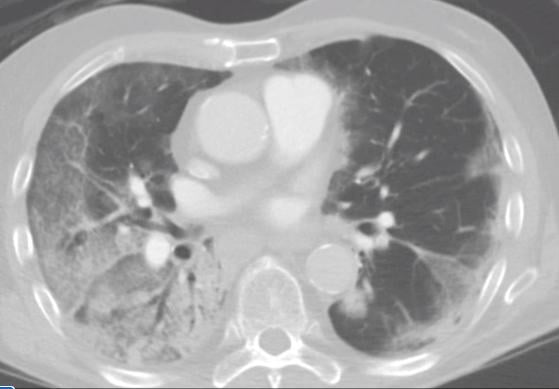
 COVID-19 complicated by pneumomediastinum in a 61-year-old man. Axial chest CT angiographic images show a typical appearance of COVID-19 pneumonia, including diffuse GGOs and interlobular septal thickening (black arrows). Air is depicted anterior to the pulmonary artery (white arrow) and adjacent to the main pulmonary artery and left atrial appendage, indicative of pneumomediastinum. Image courtesy of Margarita Revzin et al. COVID-19 complicated by pneumomediastinum in a 61-year-old man. Axial chest CT angiographic images show a typical appearance of COVID-19 pneumonia, including diffuse GGOs and interlobular septal thickening (black arrows). Air is depicted anterior to the pulmonary artery (white arrow) and adjacent to the main pulmonary artery and left atrial appendage, indicative of pneumomediastinum. Image courtesy of Margarita Revzin et al.
 Common carotid artery (CCA) occlusion in a 56-year-old woman with neurologic deficits who had been hospitalized with COVID-19. Coronal three-dimensional maximum intensity projection reformatted image of the head and neck show an abrupt cutoff at the origin of the CCA (black arrow). The left carotid vasculature is well opacified with intravenous contrast material (white arrow). Image courtesy of Margarita Revzin et al. Common carotid artery (CCA) occlusion in a 56-year-old woman with neurologic deficits who had been hospitalized with COVID-19. Coronal three-dimensional maximum intensity projection reformatted image of the head and neck show an abrupt cutoff at the origin of the CCA (black arrow). The left carotid vasculature is well opacified with intravenous contrast material (white arrow). Image courtesy of Margarita Revzin et al.
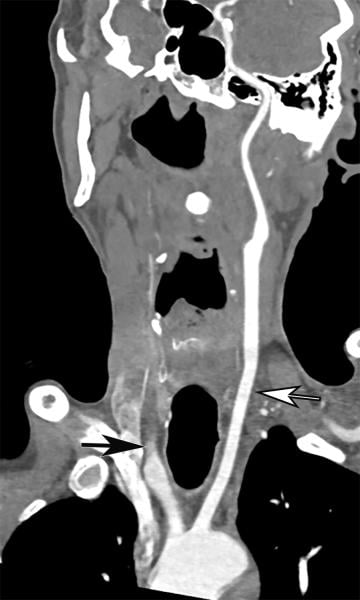
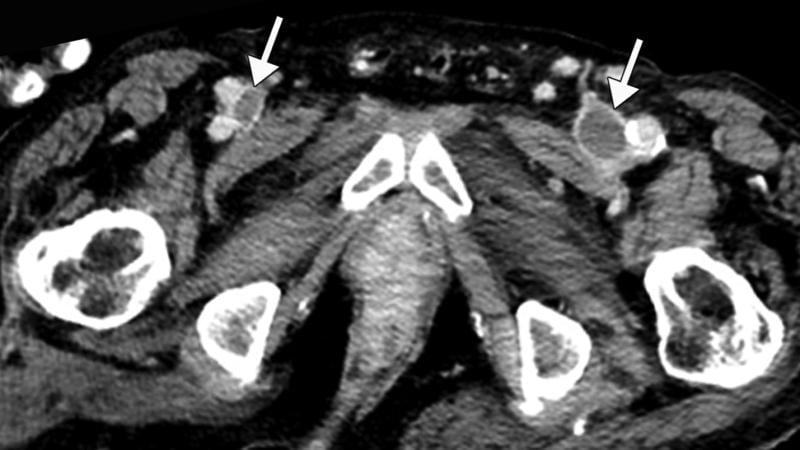 Inferior vena cava (IVC) and peripheral deep vein thrombosis (DVT) in a 78-year-old man with COVID-19 with leg swelling and abdominal pain. Axial contrast-enhanced CT images show filling defects in the bilateral common femoral veins (white arrows). Image courtesy of Margarita Revzin et al. Inferior vena cava (IVC) and peripheral deep vein thrombosis (DVT) in a 78-year-old man with COVID-19 with leg swelling and abdominal pain. Axial contrast-enhanced CT images show filling defects in the bilateral common femoral veins (white arrows). Image courtesy of Margarita Revzin et al.
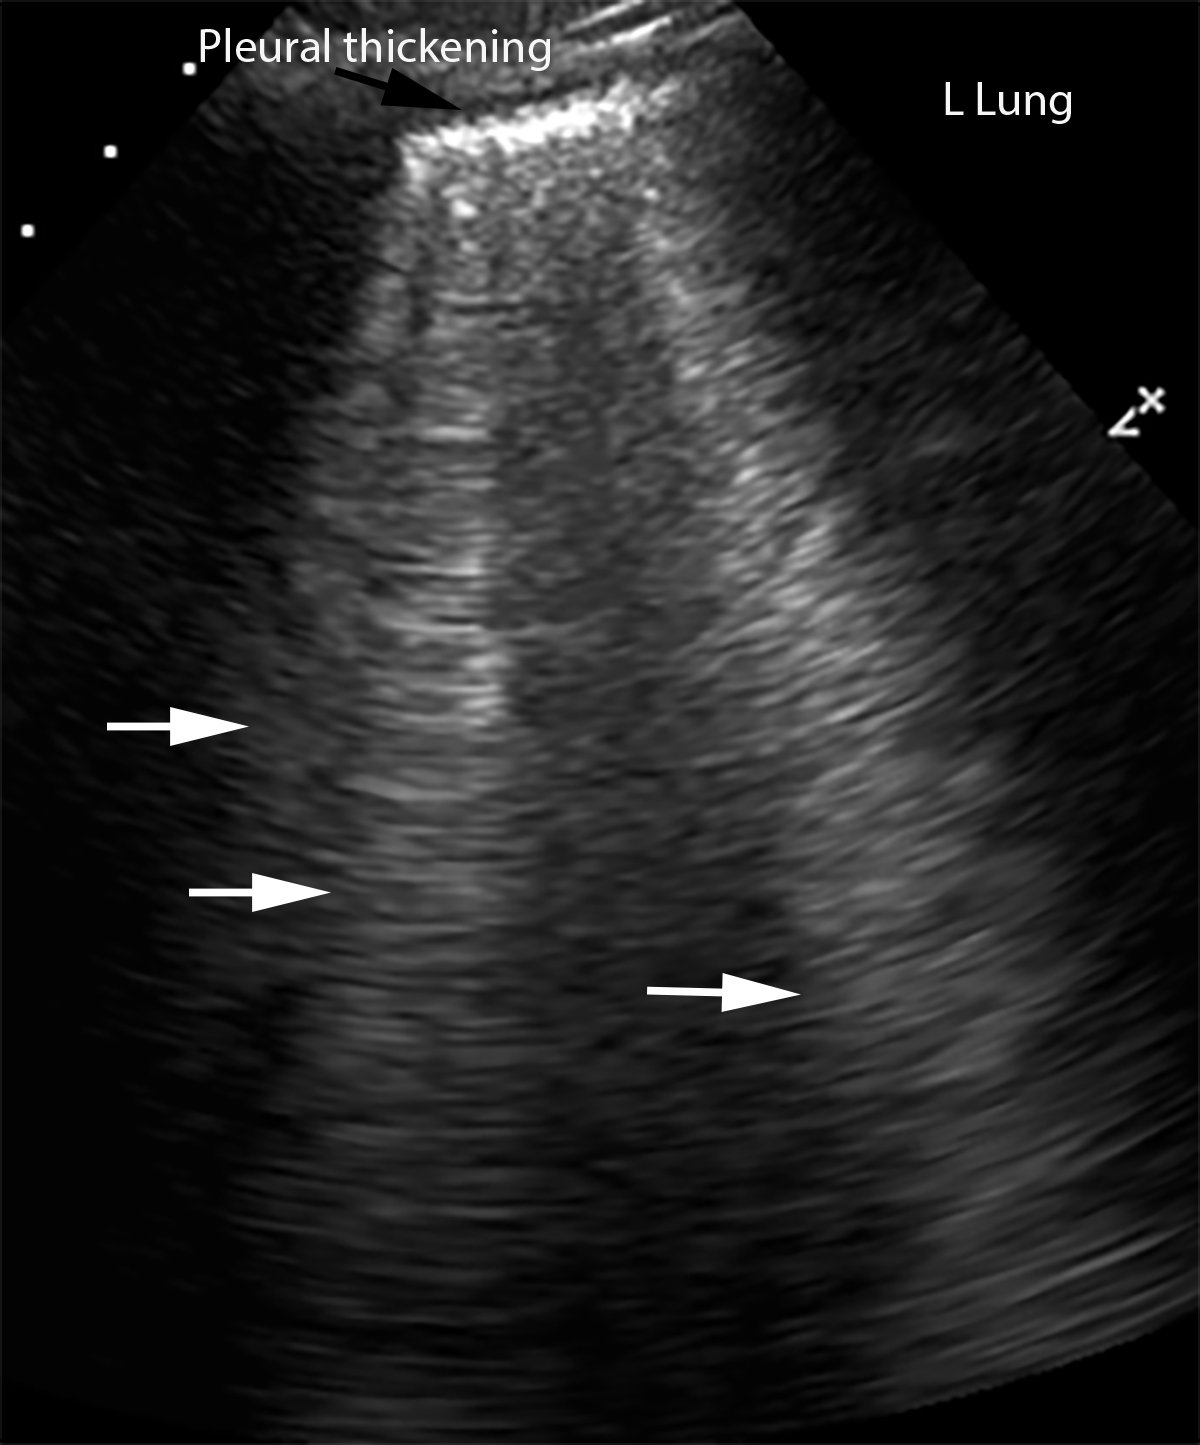
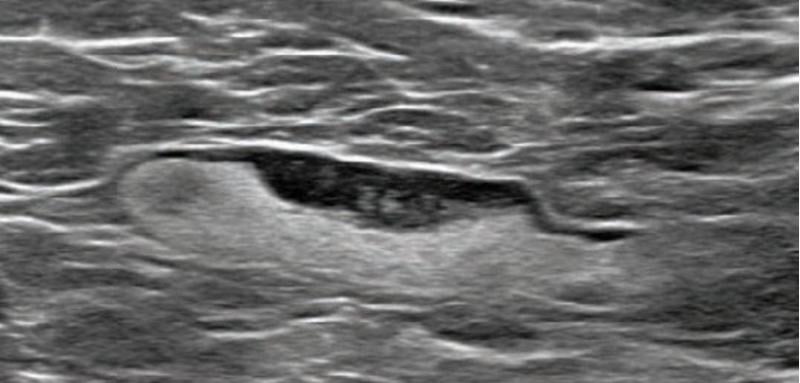
 Lung ultrasound showing interstitial edema and pleural thickening in a 40-year-old man with COVID-19 who presented to the emergency department with hypoxia and dyspnea. Ultrasound image obtained in the longitudinal plane over the left lower lobe shows multiple (more than three) vertical echogenic bands (white arrows) extending from the pleural surface to the deeper portions of the lung, consistent with B-line artifacts, indicating subpleural interstitial edema. Note that the lung pleura is thickened and irregular (black arrow). Image courtesy of Margarita Revzin et al. Lung ultrasound showing interstitial edema and pleural thickening in a 40-year-old man with COVID-19 who presented to the emergency department with hypoxia and dyspnea. Ultrasound image obtained in the longitudinal plane over the left lower lobe shows multiple (more than three) vertical echogenic bands (white arrows) extending from the pleural surface to the deeper portions of the lung, consistent with B-line artifacts, indicating subpleural interstitial edema. Note that the lung pleura is thickened and irregular (black arrow). Image courtesy of Margarita Revzin et al.
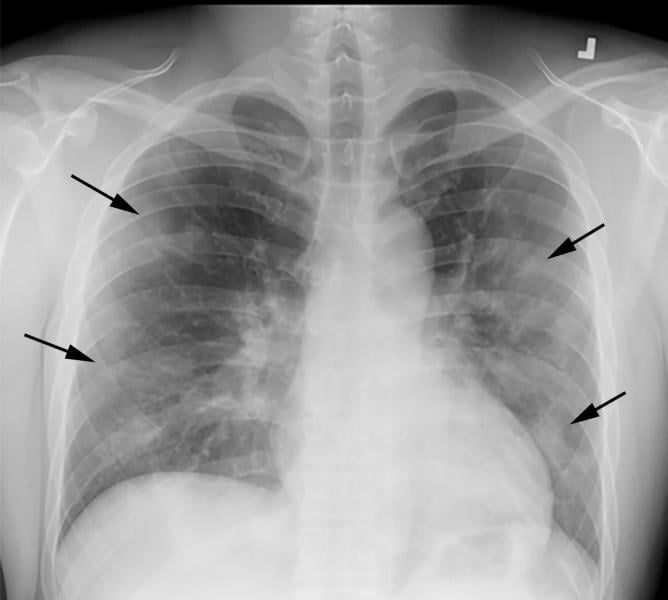 COVID-19 progression over 4 days in a 28-year-old man. This posteroranterior chest X-ray \ shows bilateral multiple peripheral and lower lobe ground glass opacities (GGOs) shown by the arrows. Image courtesy of Margarita Revzin et al. COVID-19 progression over 4 days in a 28-year-old man. This posteroranterior chest X-ray \ shows bilateral multiple peripheral and lower lobe ground glass opacities (GGOs) shown by the arrows. Image courtesy of Margarita Revzin et al.
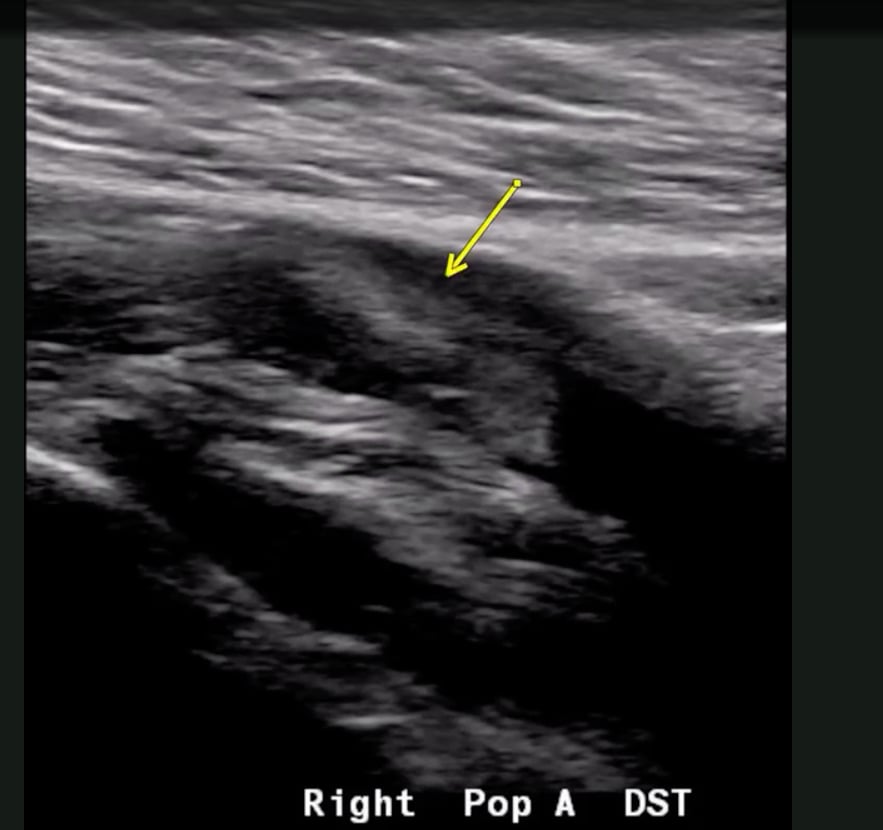
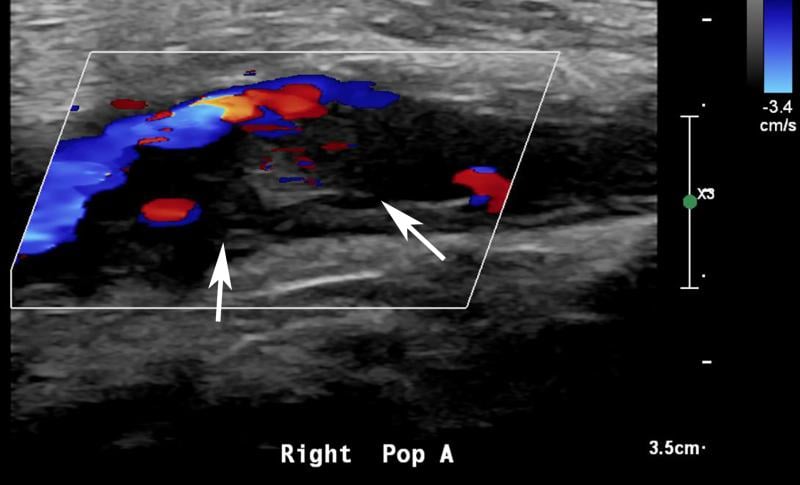 Ultrasound showing popliteal and posterior tibial artery thrombosis in a 58-year-old woman with COVID-19 in the ICU. Sagittal color and spectral Doppler ultrasound images show an echogenic heterogeneous thrombus (white arrows) distending the right popliteal artery. The characteristic knocking or “stump-thump” waveform with absence of diastolic flow and low amplitude imply the presence of occlusion just distal to the area of interrogation. Image courtesy of Margarita Revzin et al. Ultrasound showing popliteal and posterior tibial artery thrombosis in a 58-year-old woman with COVID-19 in the ICU. Sagittal color and spectral Doppler ultrasound images show an echogenic heterogeneous thrombus (white arrows) distending the right popliteal artery. The characteristic knocking or “stump-thump” waveform with absence of diastolic flow and low amplitude imply the presence of occlusion just distal to the area of interrogation. Image courtesy of Margarita Revzin et al.
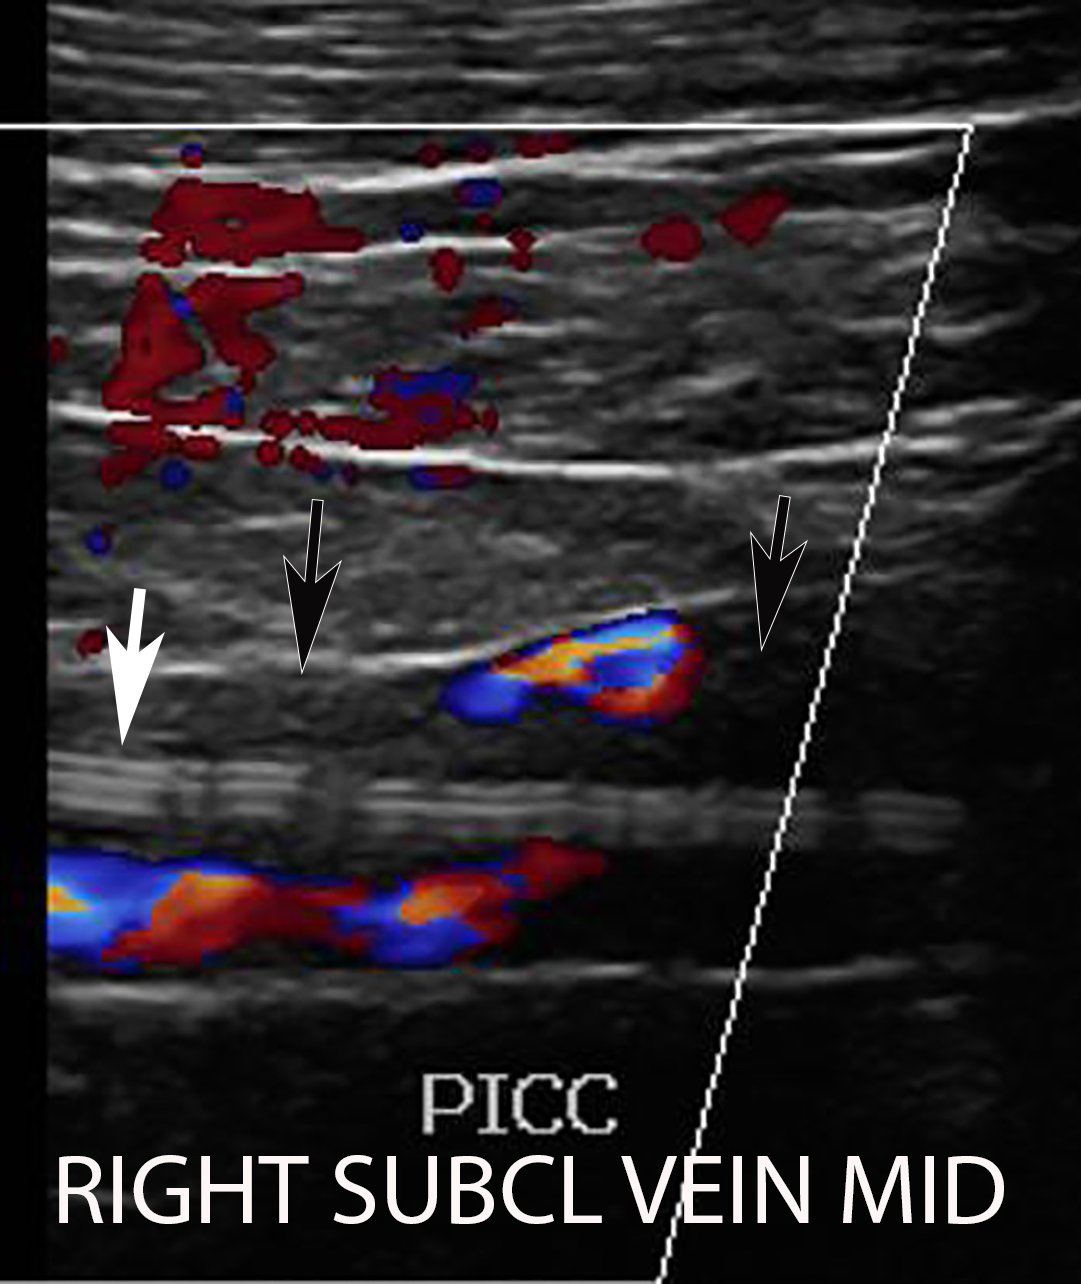
 Deep vein thrombosis (DVT) associated with a peripherally inserted central catheter (PICC) line in a 54-year-old man with COVID-19. Sagittal color Doppler ultrasound image shows an echogenic thrombus (black arrows) in the right subclavian vein, associated with the PICC line (white arrow). Image courtesy of Margarita Revzin et al. Deep vein thrombosis (DVT) associated with a peripherally inserted central catheter (PICC) line in a 54-year-old man with COVID-19. Sagittal color Doppler ultrasound image shows an echogenic thrombus (black arrows) in the right subclavian vein, associated with the PICC line (white arrow). Image courtesy of Margarita Revzin et al.
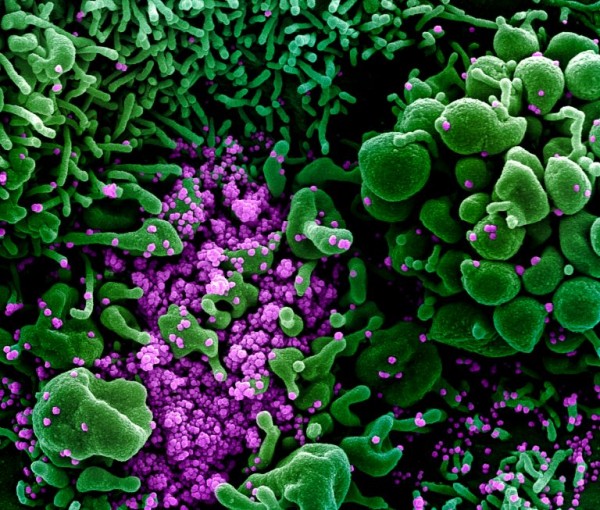
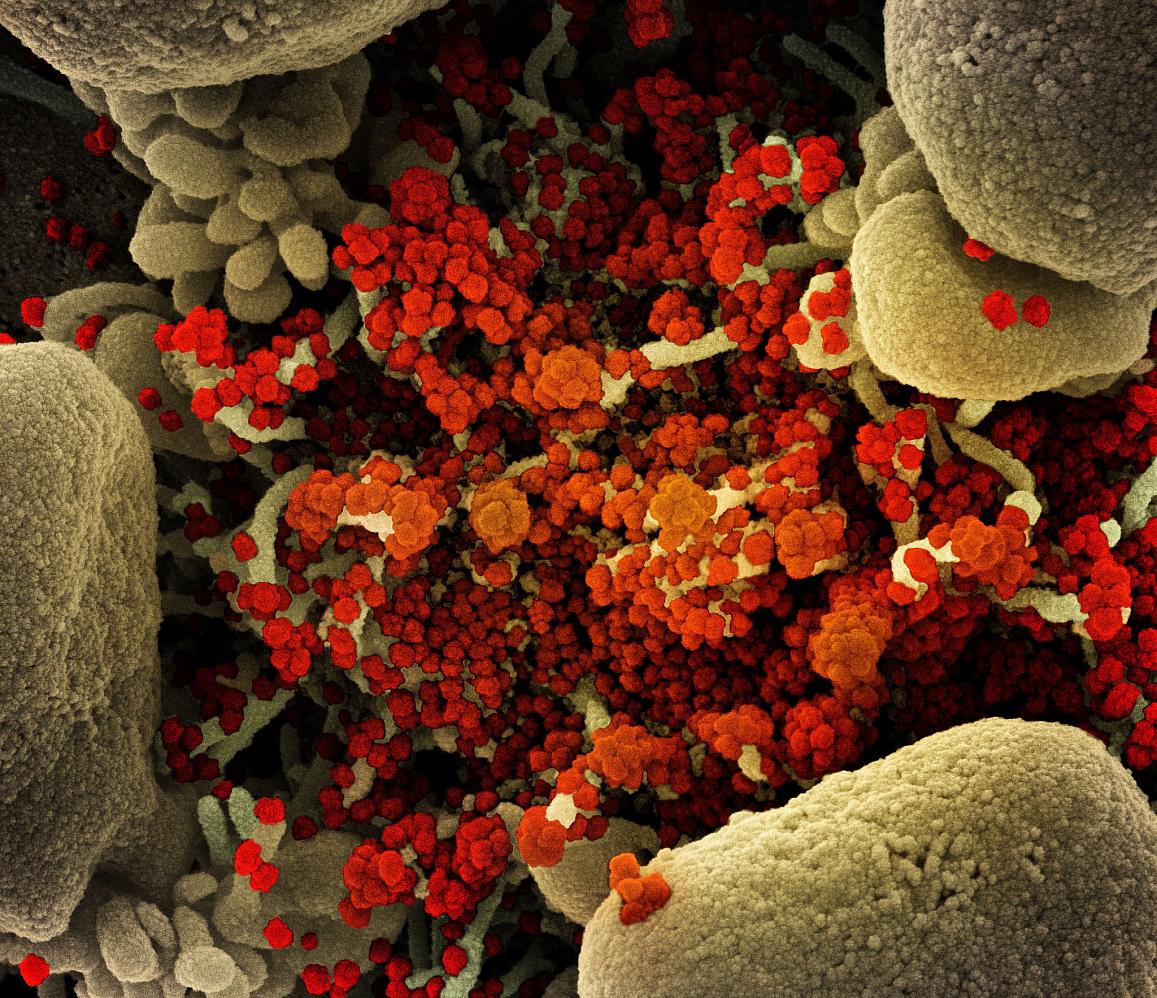
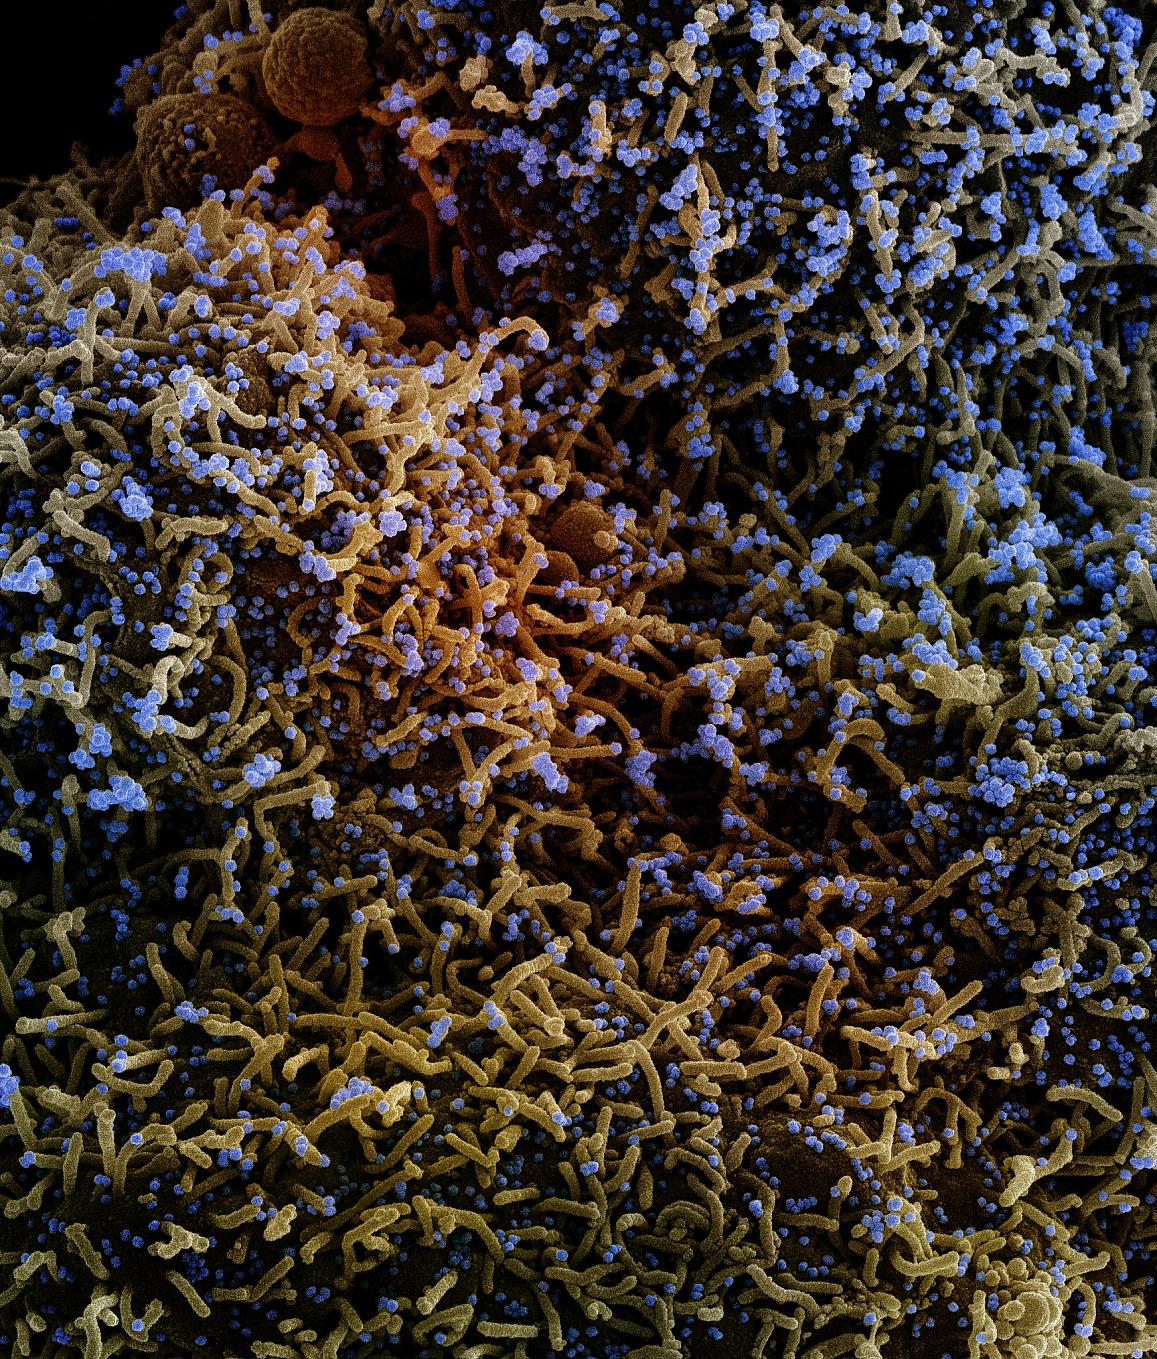
 Colorized scanning electron micrograph of an apoptotic cell (tan) heavily infected with SARS-CoV-2 virus particles (orange), isolated from a patient sample. Image captured at the National Institute of Allergy and Infectious Diseases (NIAID) Integrated Research Facility (IRF) in Fort Detrick, Maryland. Photo courtesy of NIAID Colorized scanning electron micrograph of an apoptotic cell (tan) heavily infected with SARS-CoV-2 virus particles (orange), isolated from a patient sample. Image captured at the National Institute of Allergy and Infectious Diseases (NIAID) Integrated Research Facility (IRF) in Fort Detrick, Maryland. Photo courtesy of NIAID
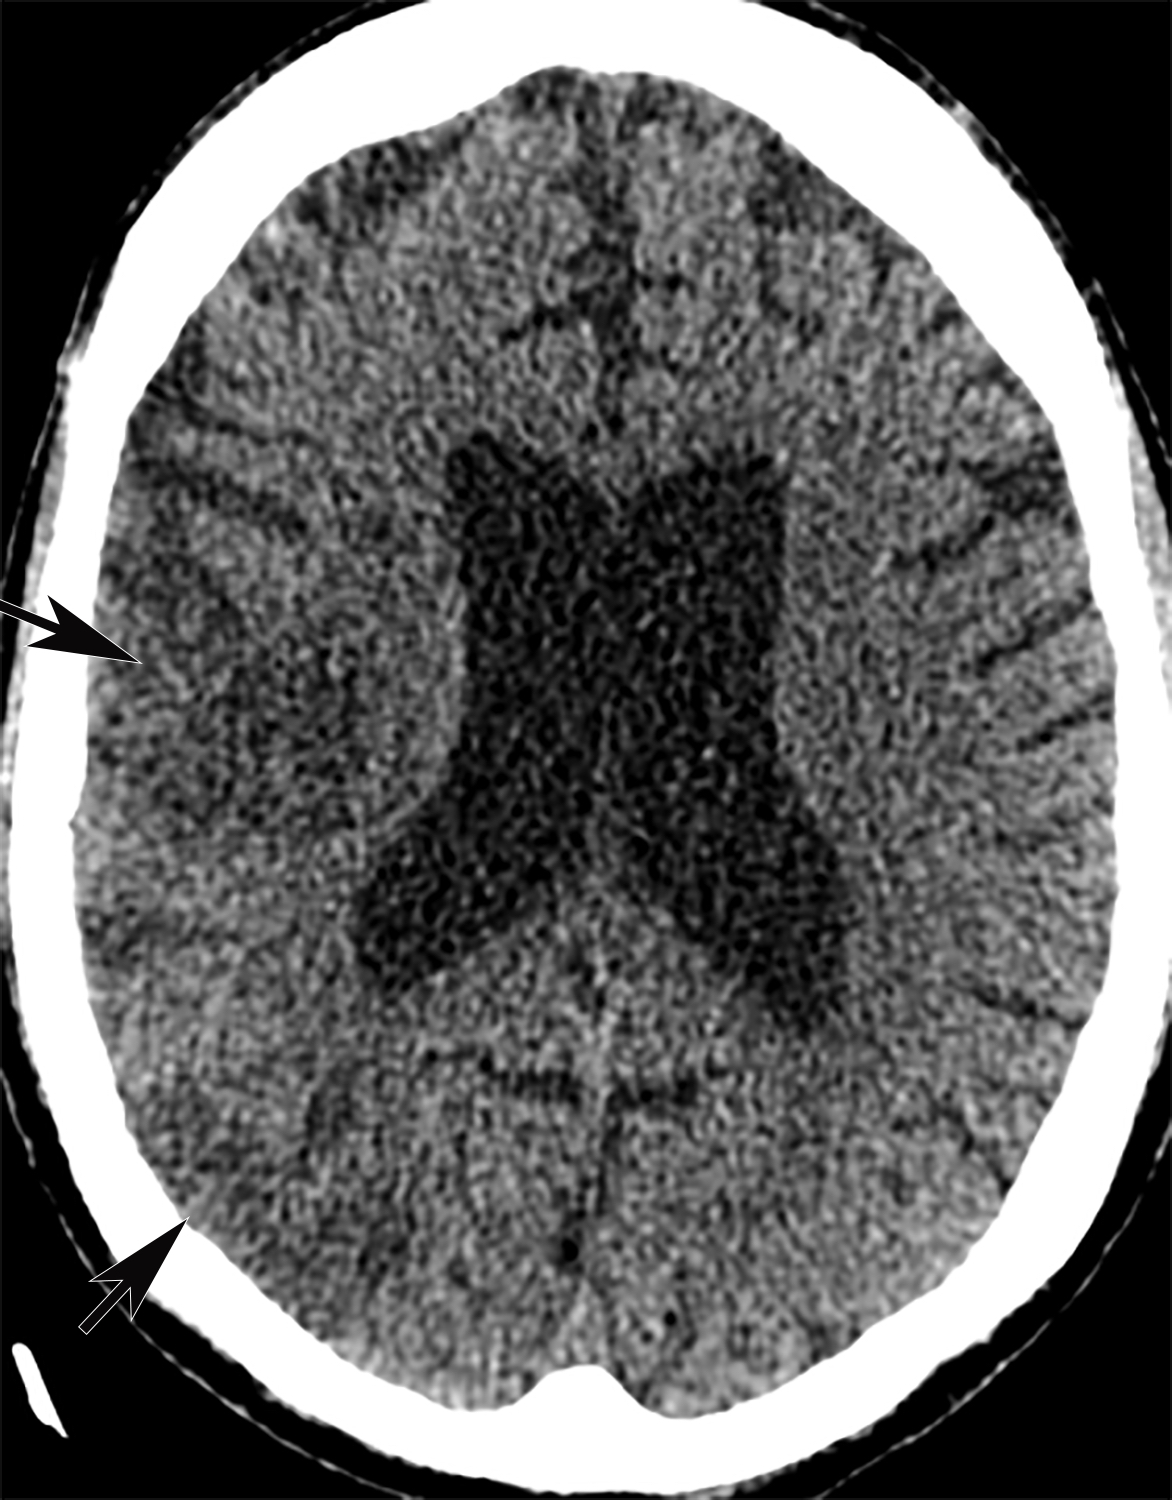
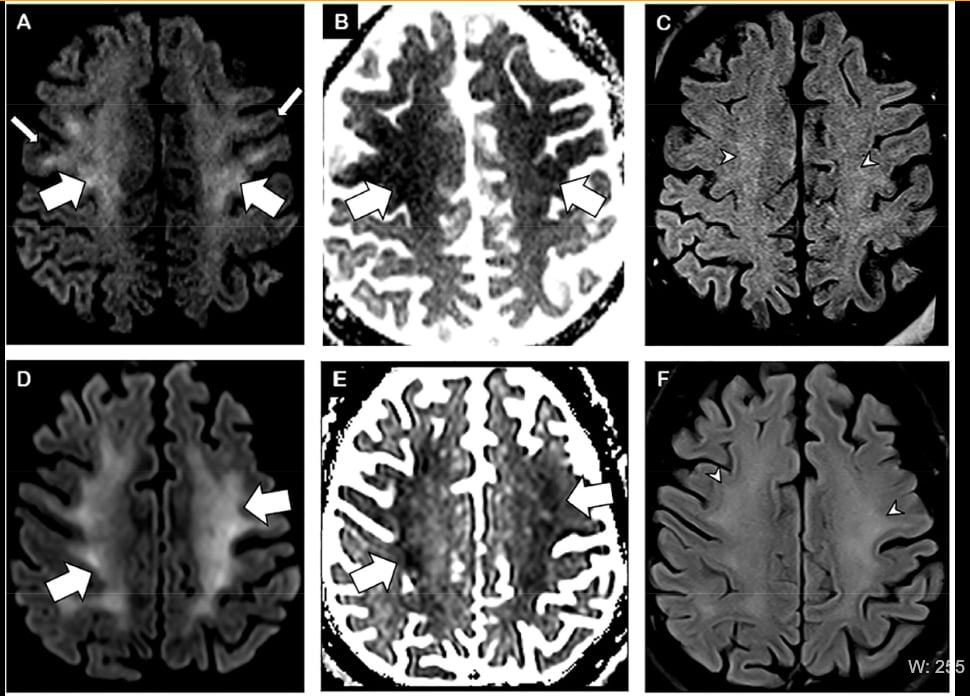
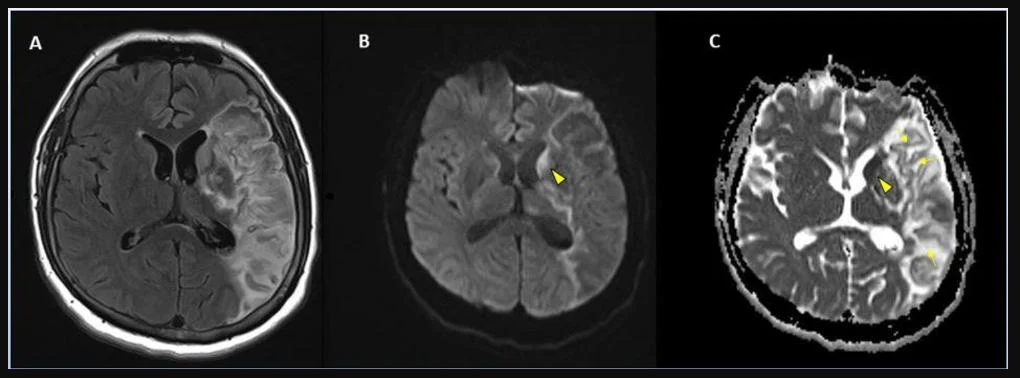
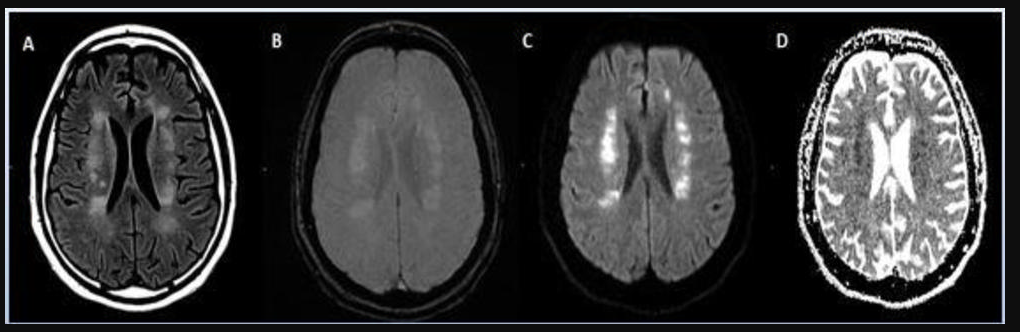
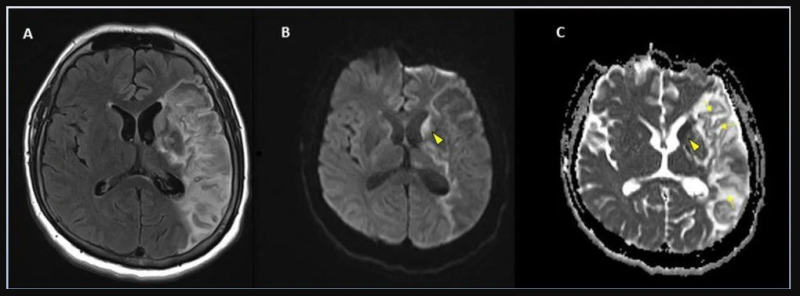
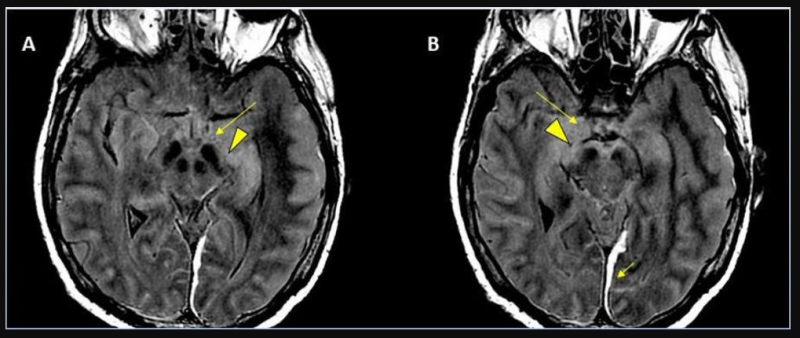
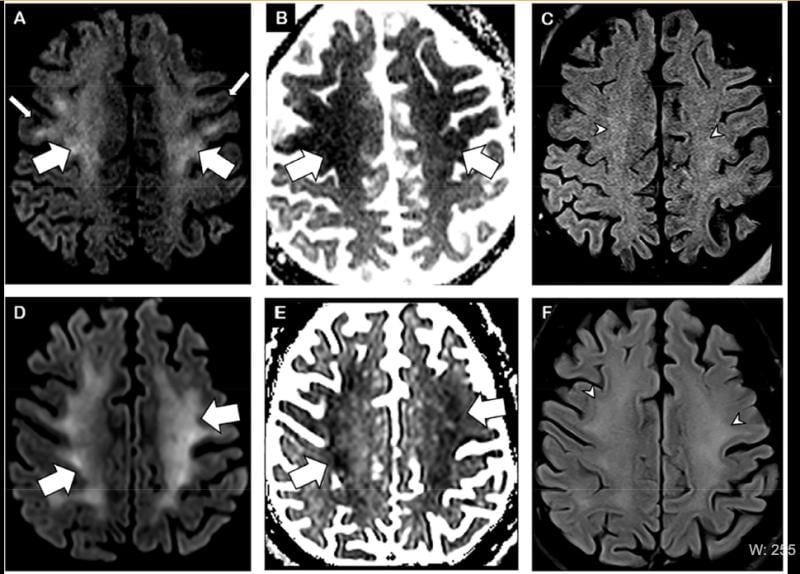 Figure 1 from the Radiology article. Brain MRI in two critically ill COVID-19 patients with persistently depressed mental status including a 56-year old man (A-C), and a 64-year old man (D-F). Axial diffusion-weighted (A, D), apparent diffusion coefficient (B, E) and FLAIR (C, F) images at the level of centrum semiovale in both patients demonstrate symmetric diffuse T2/FLAIR hyperintensity (arrowheads) and mild restricted diffusion (thick arrows) involving the deep and subcortical white matter with relative sparing of juxtacortical white matter (thin arrows) in both patients. The restricted diffusion is more conspicuous than the T2/FLAIR hyperintensity. Figure 1 from the Radiology article. Brain MRI in two critically ill COVID-19 patients with persistently depressed mental status including a 56-year old man (A-C), and a 64-year old man (D-F). Axial diffusion-weighted (A, D), apparent diffusion coefficient (B, E) and FLAIR (C, F) images at the level of centrum semiovale in both patients demonstrate symmetric diffuse T2/FLAIR hyperintensity (arrowheads) and mild restricted diffusion (thick arrows) involving the deep and subcortical white matter with relative sparing of juxtacortical white matter (thin arrows) in both patients. The restricted diffusion is more conspicuous than the T2/FLAIR hyperintensity.
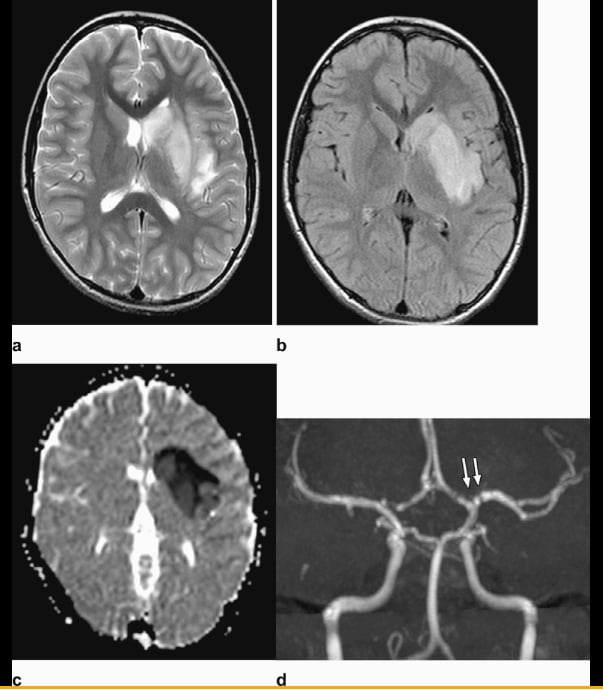
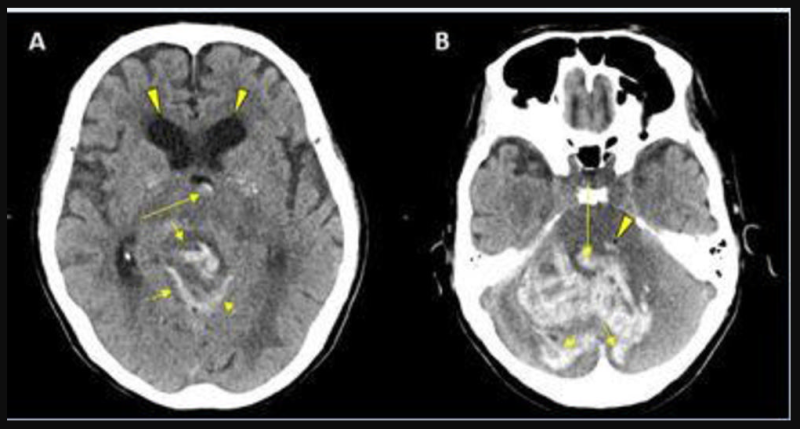
 From a Radiology article: Axial T2-weighted (a) and FLAIR (b) Magnetic resonance imaging show diffuse hyperintense signal and edema of the caudate nucleus head, putamen, anterior limb of the internal capsule, and parts of external capsule and insula on the left side, with corresponding low values on the axial apparent diffusion coefficient map, in keeping with an acute infarct. Time-of-flight magnetic resonance angiography maximal intensity projection reformatted image demonstrates focal irregular narrowing and banding of the proximal left M1 segment of the middle cerebral artery with a slightly reduced distal flow in the middle cerebral artery. From a Radiology article: Axial T2-weighted (a) and FLAIR (b) Magnetic resonance imaging show diffuse hyperintense signal and edema of the caudate nucleus head, putamen, anterior limb of the internal capsule, and parts of external capsule and insula on the left side, with corresponding low values on the axial apparent diffusion coefficient map, in keeping with an acute infarct. Time-of-flight magnetic resonance angiography maximal intensity projection reformatted image demonstrates focal irregular narrowing and banding of the proximal left M1 segment of the middle cerebral artery with a slightly reduced distal flow in the middle cerebral artery.
 COVID-19 has been found to cause clooting in some patients, causing strokes and pulmonary embiolism. This series of images show brain MRIs in two critically ill COVID-19 patients with persistently depressed mental status including a 56-year old man (A-C), and a 64-year old man (D-F). Axial diffusion-weighted (A, D), apparent diffusion coefficient (B, E), and FLAIR (C, F) images at the level of centrum semiovale in both patients demonstrate symmetric diffuse T2/FLAIR hyperintensity (arrowheads) and mild restricted diffusion (thick arrows) involving the deep and subcortical white matter with relative sparing of juxtacortical white matter (thin arrows) in both patients. The restricted diffusion is more conspicuous than the T2/FLAIR hyperintensity. Courtesy of the RSNA journal Radiology. COVID-19 has been found to cause clooting in some patients, causing strokes and pulmonary embiolism. This series of images show brain MRIs in two critically ill COVID-19 patients with persistently depressed mental status including a 56-year old man (A-C), and a 64-year old man (D-F). Axial diffusion-weighted (A, D), apparent diffusion coefficient (B, E), and FLAIR (C, F) images at the level of centrum semiovale in both patients demonstrate symmetric diffuse T2/FLAIR hyperintensity (arrowheads) and mild restricted diffusion (thick arrows) involving the deep and subcortical white matter with relative sparing of juxtacortical white matter (thin arrows) in both patients. The restricted diffusion is more conspicuous than the T2/FLAIR hyperintensity. Courtesy of the RSNA journal Radiology.
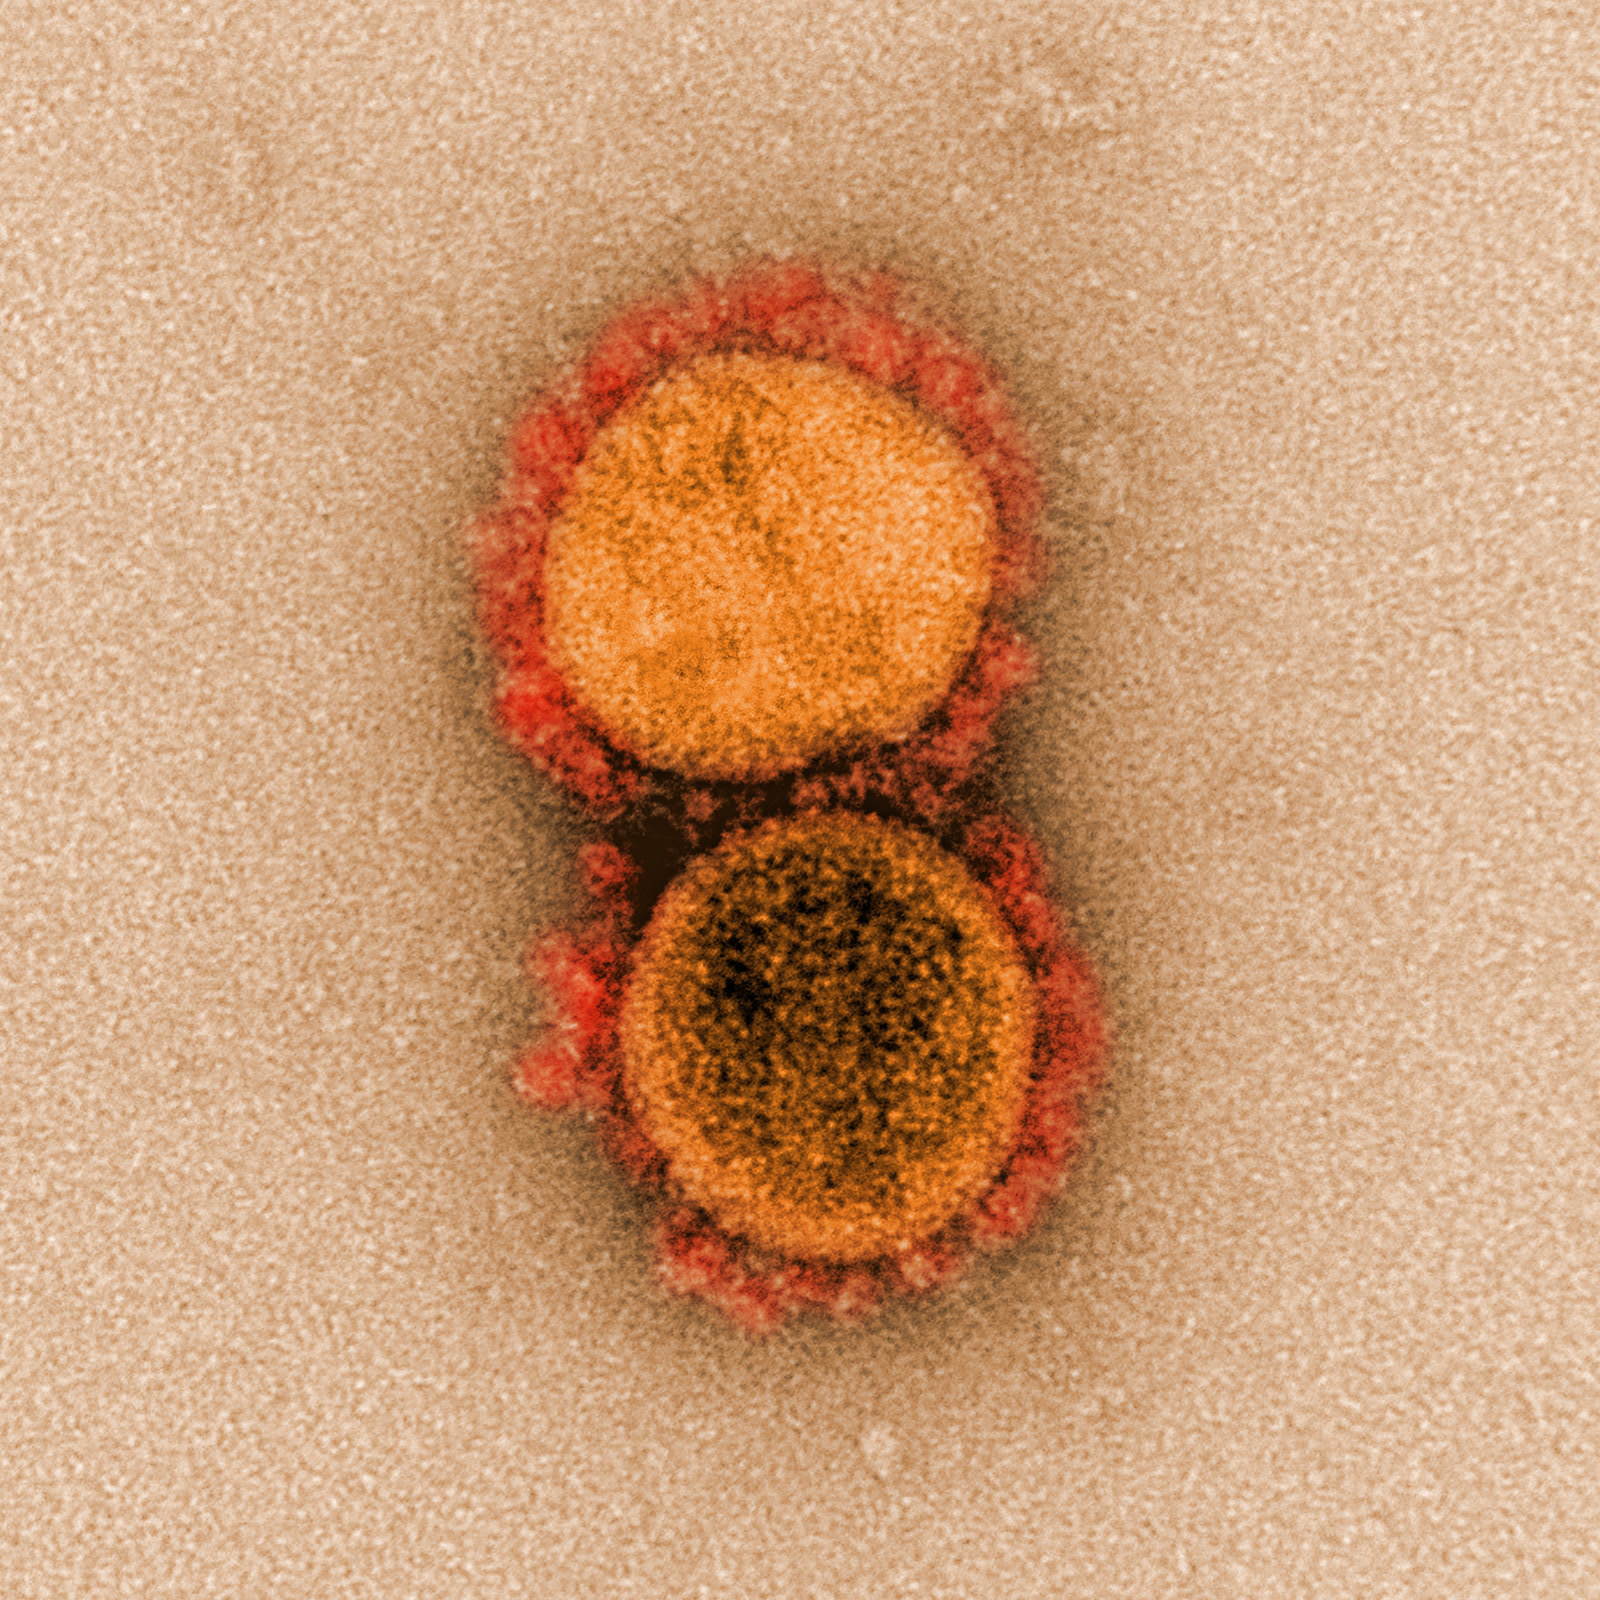
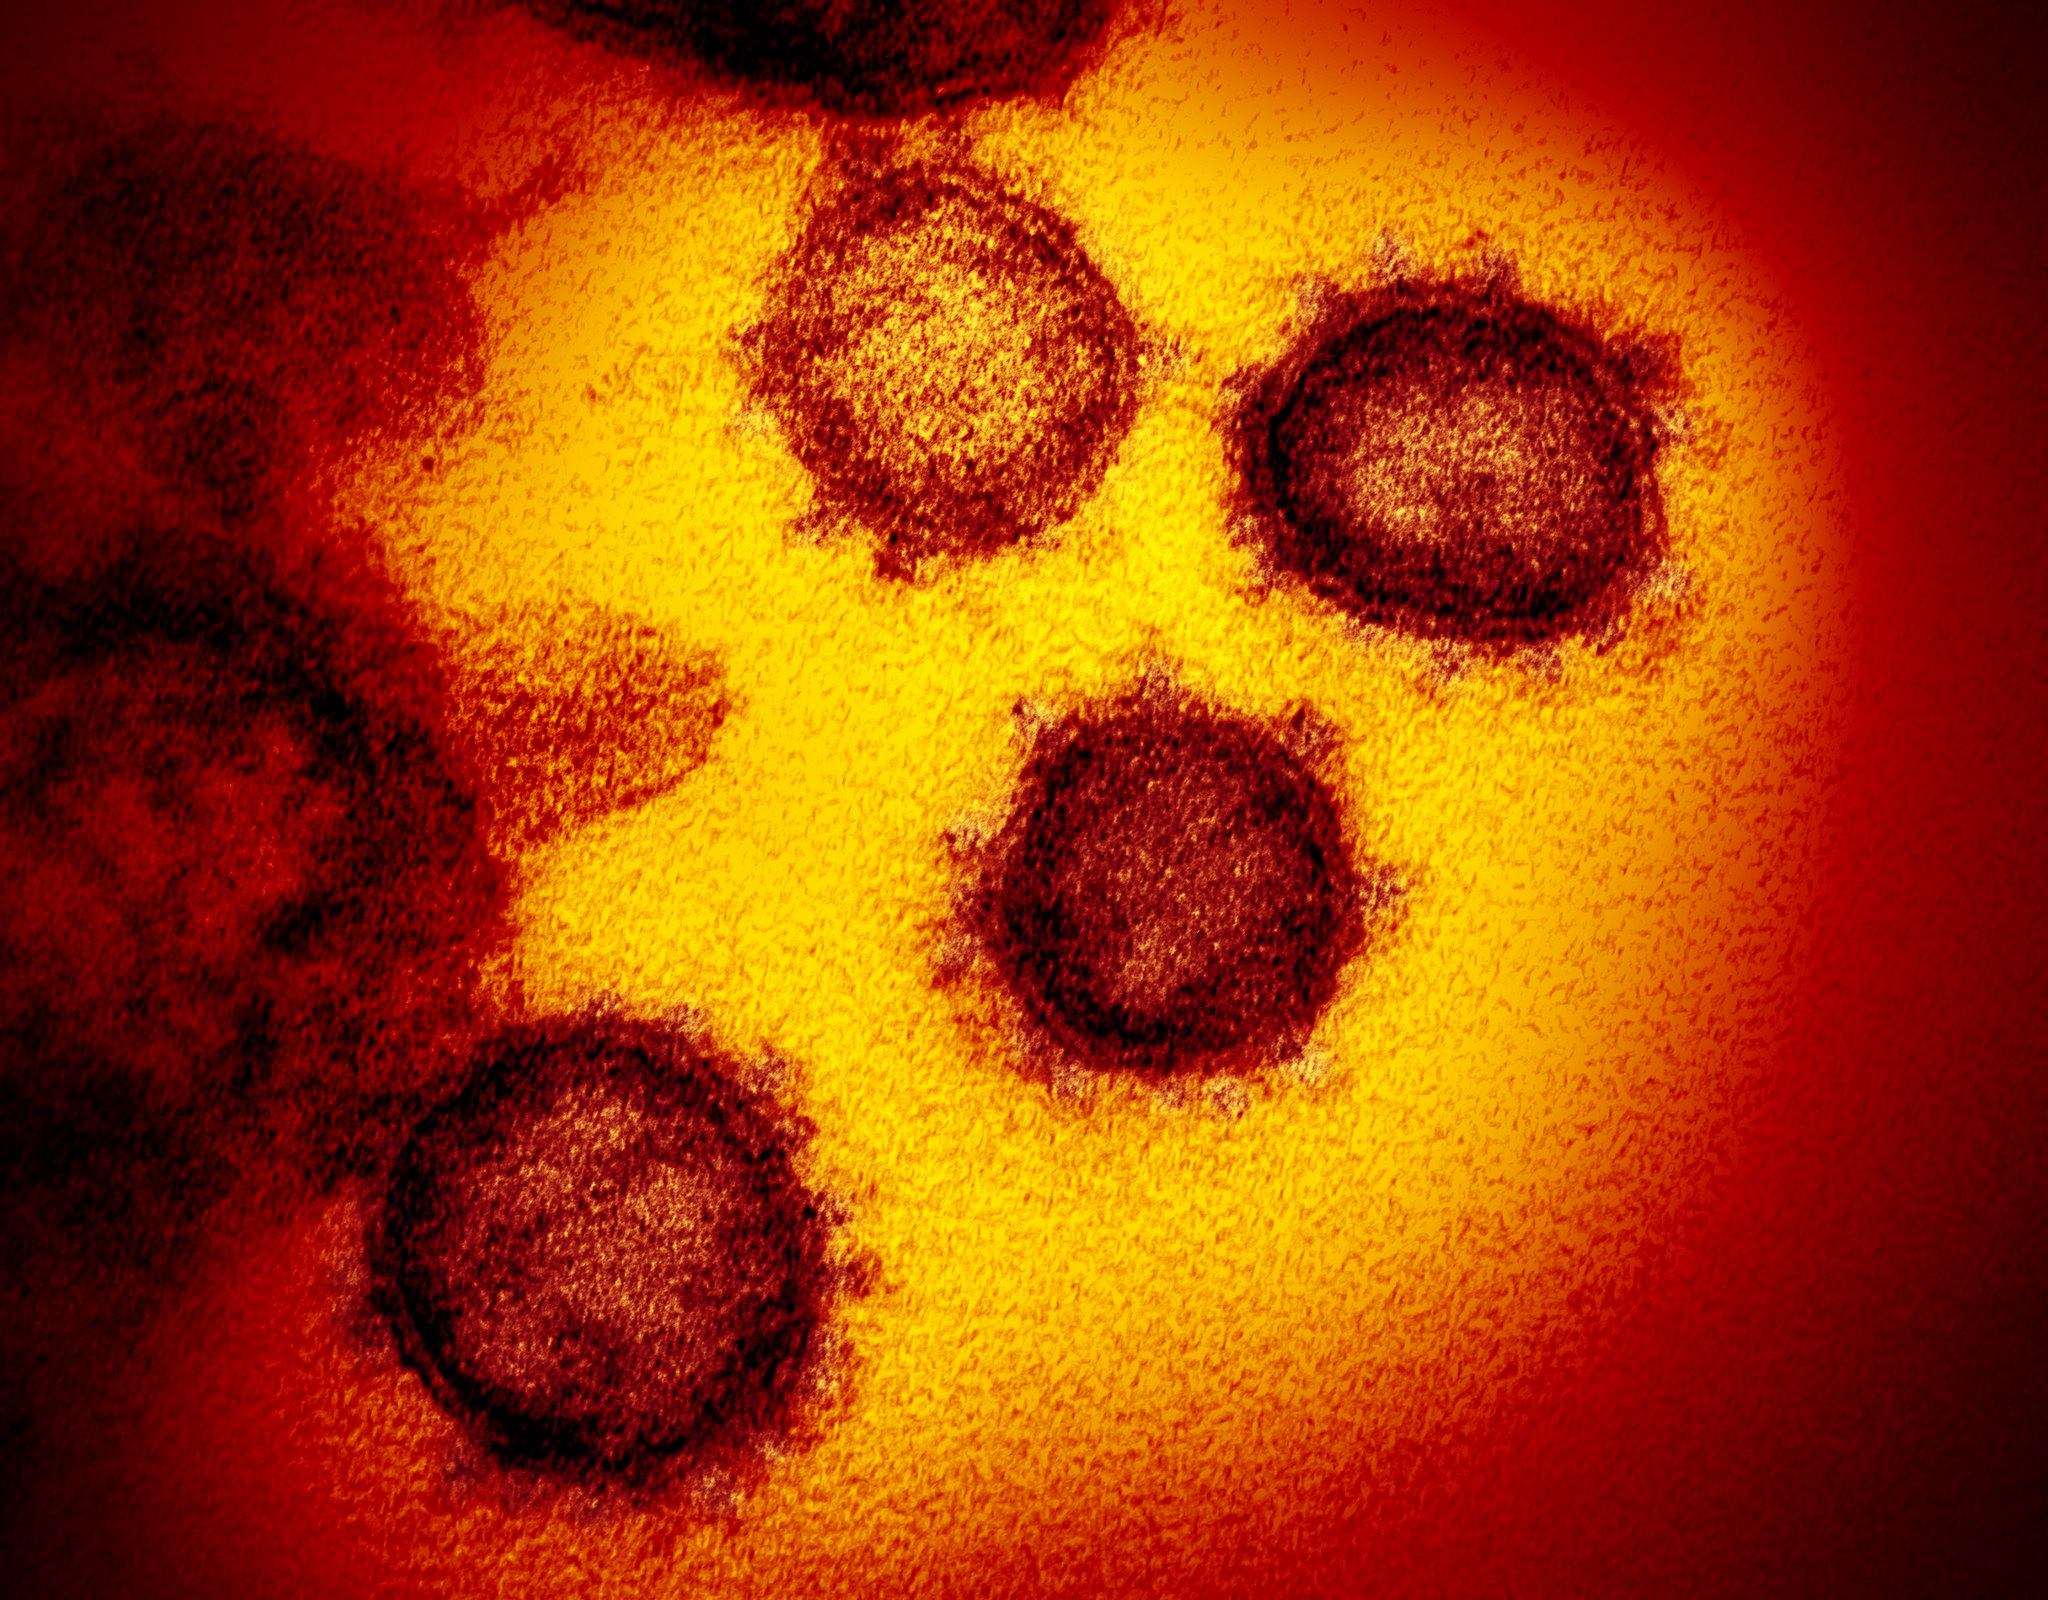
 A National Institutes of Health (NIH) image of two coronaviruses (COVID-19) from high-powered microscopy. A National Institutes of Health (NIH) image of two coronaviruses (COVID-19) from high-powered microscopy.
 A National Institutes of Health (NIH) image of two coronaviruses (COVID-19) from high-powered microscopy. A National Institutes of Health (NIH) image of two coronaviruses (COVID-19) from high-powered microscopy.
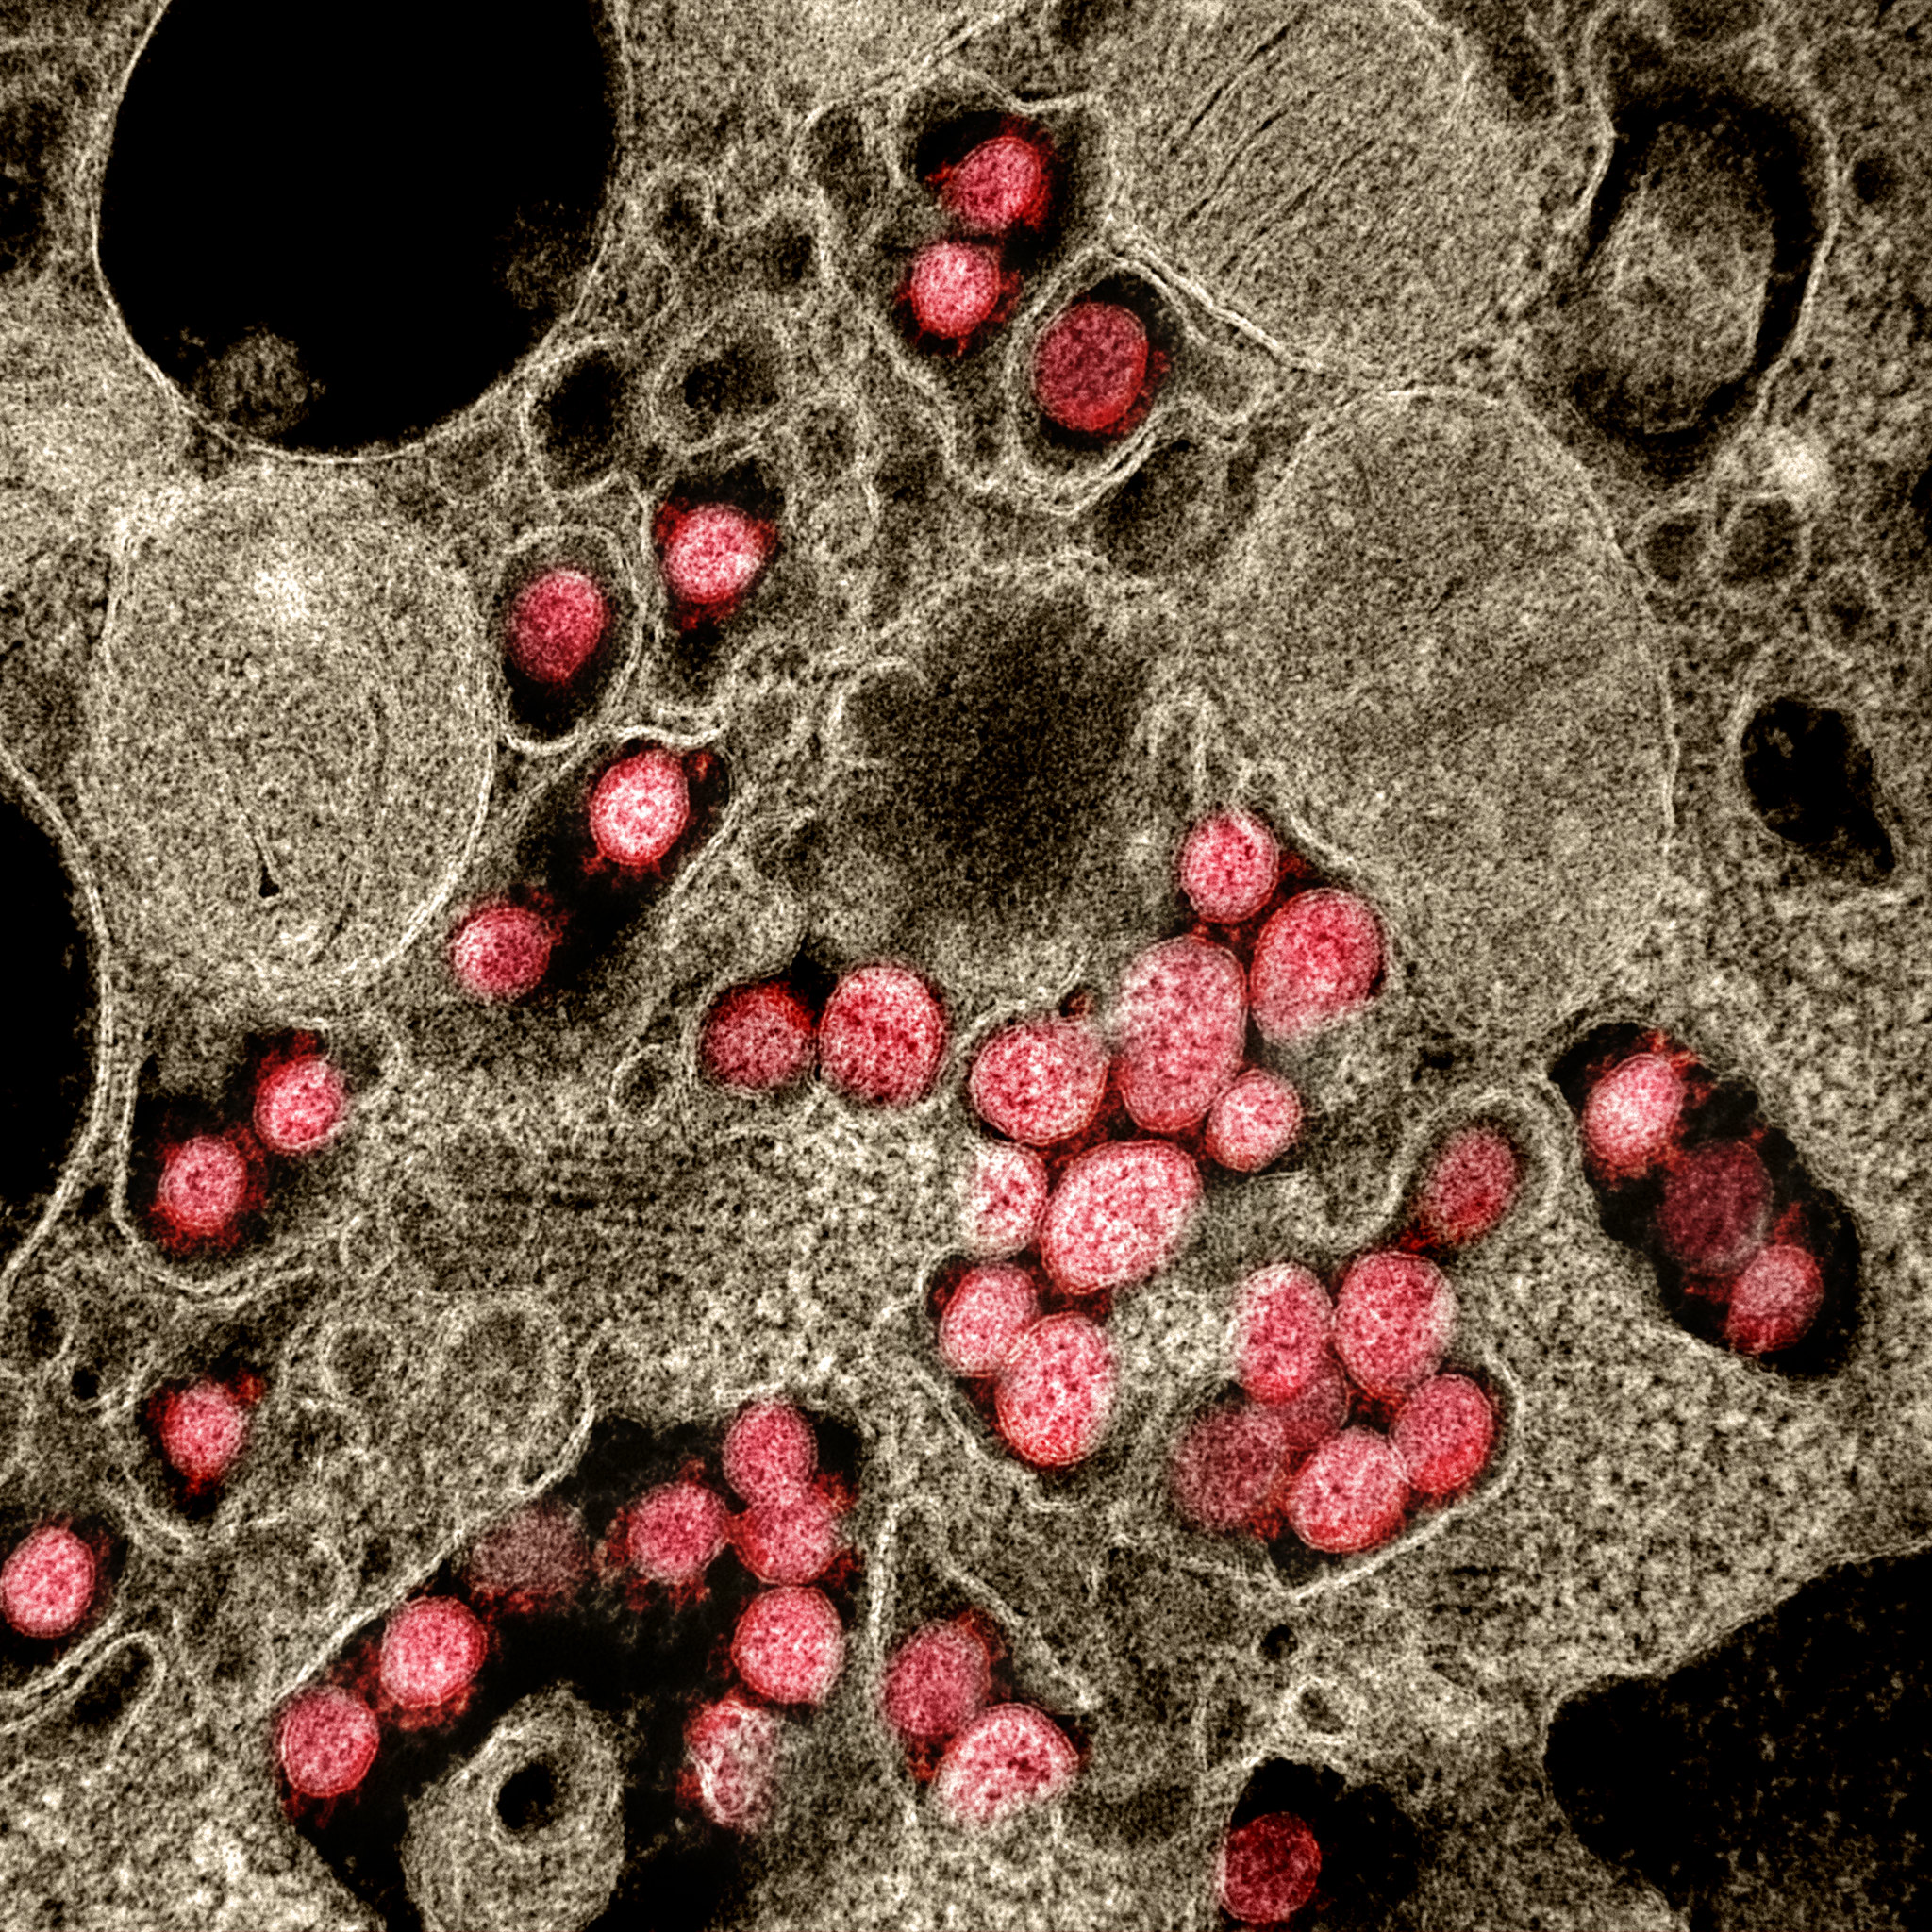
 A National Institutes of Health (NIH) image of coronavirus (COVID-19) attached to a host cell. A National Institutes of Health (NIH) image of coronavirus (COVID-19) attached to a host cell.
 Cardiac MRI for four children with clinical diagnosis of acute myocarditis in the setting of COVID-19–related Kawasaki-like symptoms of multisystem inflammatory syndrome in children (MIS-C). This severe autoimmune response that occurs a couple weeks after exposure to the SARS-CoV-2 virus. While COVID is largely asymptomatic in pediatric patients, MIS-C is a rare and severe reaction to the virus, which has occurred in more than 1,000 U.S. children as of late October 2020, including several fatalities. Read the article Cardiac MRI Aids Evaluation of Children With Multisystem Inflammatory Syndrome (MIS-C) Associated With COVID-19 Cardiac MRI for four children with clinical diagnosis of acute myocarditis in the setting of COVID-19–related Kawasaki-like symptoms of multisystem inflammatory syndrome in children (MIS-C). This severe autoimmune response that occurs a couple weeks after exposure to the SARS-CoV-2 virus. While COVID is largely asymptomatic in pediatric patients, MIS-C is a rare and severe reaction to the virus, which has occurred in more than 1,000 U.S. children as of late October 2020, including several fatalities. Read the article Cardiac MRI Aids Evaluation of Children With Multisystem Inflammatory Syndrome (MIS-C) Associated With COVID-19
 COVID-19 causes blood to clot in some patients, which can lead to pulmonary embolisms, as seen here in this COVID patient, from the journal Radiology. Read more about this COVID complication and find more information on these images. COVID-19 causes blood to clot in some patients, which can lead to pulmonary embolisms, as seen here in this COVID patient, from the journal Radiology. Read more about this COVID complication and find more information on these images.
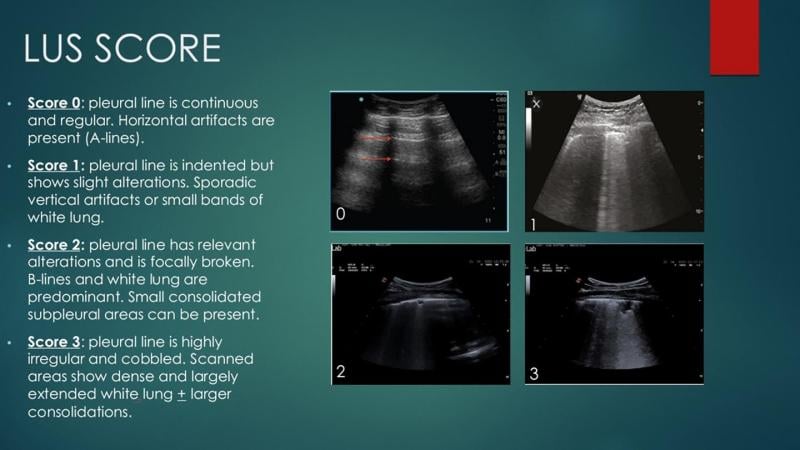 A lung ultrasound scoring system to help quanitify the severity of COVID pneumonia in the lungs. Using 14 points in the lungs, researchers looked for abnormalities and assigned each spot a score out of 3 based on its severity. Adding up all the points, they found the total lung ultrasound score was higher for those who had a worsening outcome of COVID-19. Read more. Image courtesy of Umberto Sabatini A lung ultrasound scoring system to help quanitify the severity of COVID pneumonia in the lungs. Using 14 points in the lungs, researchers looked for abnormalities and assigned each spot a score out of 3 based on its severity. Adding up all the points, they found the total lung ultrasound score was higher for those who had a worsening outcome of COVID-19. Read more. Image courtesy of Umberto Sabatini
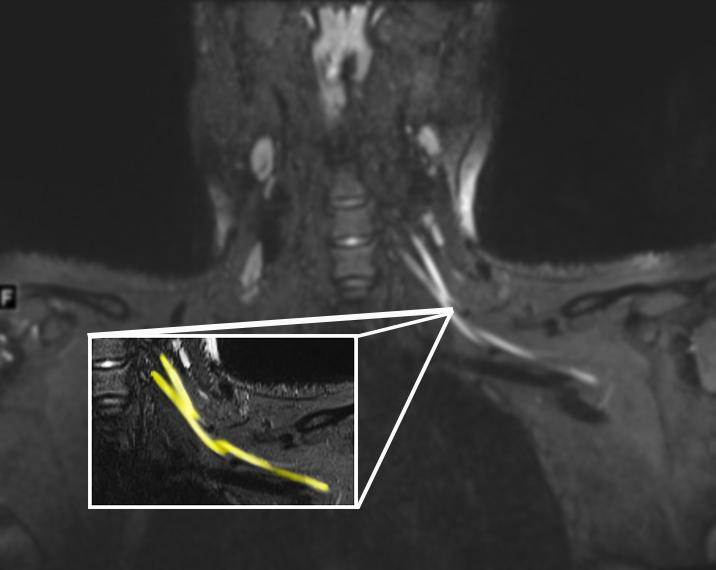
 An MR image of a patient in their early 20s shows nerve injury (highlighted in yellow) of the left brachial plexus in the neck. The patient experienced left arm weakness and pain after recovering from COVID-19 respiratory illness, which prompted them to see their primary care physician. As a result of the MRI findings, the patient was referred to the COVID-19 neurology clinic for treatment. Read more about this case. Image courtesy of Northwestern University An MR image of a patient in their early 20s shows nerve injury (highlighted in yellow) of the left brachial plexus in the neck. The patient experienced left arm weakness and pain after recovering from COVID-19 respiratory illness, which prompted them to see their primary care physician. As a result of the MRI findings, the patient was referred to the COVID-19 neurology clinic for treatment. Read more about this case. Image courtesy of Northwestern University
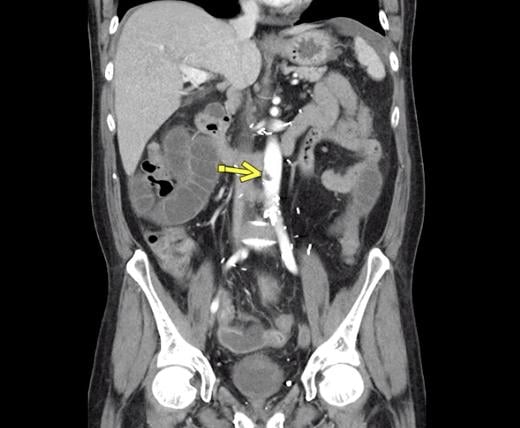
 Superior mesenteric artery thrombosis (Red arrow) complicated by bowel ischemia and perforation in a 54-year-old man who presented to the emergency department with abdominal pain and was diagnosed with COVID-19. Contrast-enhanced CT images of the abdomen and pelvis show mucosal hyperenhancement involving the small bowel. Scroll through this dataset. Image courtesy of Margarita Revzin et al. Superior mesenteric artery thrombosis (Red arrow) complicated by bowel ischemia and perforation in a 54-year-old man who presented to the emergency department with abdominal pain and was diagnosed with COVID-19. Contrast-enhanced CT images of the abdomen and pelvis show mucosal hyperenhancement involving the small bowel. Scroll through this dataset. Image courtesy of Margarita Revzin et al.
 Aortic thrombosis from COVID at the level of the inferior superior mesenteric artery. The patient also had superior mesenteric artery thrombosis complicated by bowel ischemia and perforation in this 54-year-old man who presented to the emergency department with abdominal pain and was diagnosed with COVID-19. Scroll through this dataset. Image courtesy of Margarita Revzin et al. Aortic thrombosis from COVID at the level of the inferior superior mesenteric artery. The patient also had superior mesenteric artery thrombosis complicated by bowel ischemia and perforation in this 54-year-old man who presented to the emergency department with abdominal pain and was diagnosed with COVID-19. Scroll through this dataset. Image courtesy of Margarita Revzin et al.
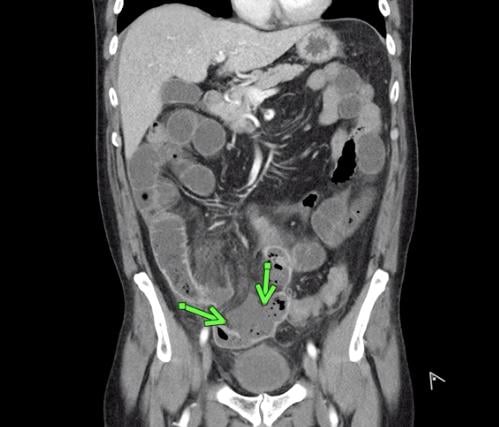 Superior mesenteric artery thrombosis complicated by bowel ischemia and perforation in a 54-year-old man who presented to the emergency department with abdominal pain and was diagnosed with COVID-19. Contrast-enhanced CT images of the abdomen and pelvis show mucosal hyperenhancement involving the small bowel (green arrows). Scroll through this dataset. Image courtesy of Margarita Revzin et al. Superior mesenteric artery thrombosis complicated by bowel ischemia and perforation in a 54-year-old man who presented to the emergency department with abdominal pain and was diagnosed with COVID-19. Contrast-enhanced CT images of the abdomen and pelvis show mucosal hyperenhancement involving the small bowel (green arrows). Scroll through this dataset. Image courtesy of Margarita Revzin et al.
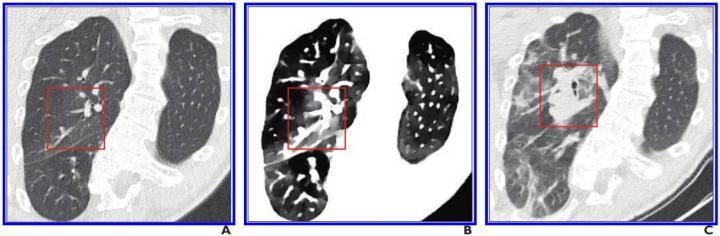 The use of spectral CT imaging may help with earlier identification of COVID in the lungs. A, Initial conventional axial CT image shows no noticeable lung damage (within red box) in right upper lobe. B, Electron density spectral CT image obtained at same time as image in A shows lesions (within red box) in right upper lobe. C, Follow-up conventional axial chest CT image obtained 5 days after images in A and B confirm presence of lesions (within red box) in right upper lobe. Read more. Image courtesy of the American Roentgen Ray Society (ARRS), American Journal of Roentgenology (AJR) The use of spectral CT imaging may help with earlier identification of COVID in the lungs. A, Initial conventional axial CT image shows no noticeable lung damage (within red box) in right upper lobe. B, Electron density spectral CT image obtained at same time as image in A shows lesions (within red box) in right upper lobe. C, Follow-up conventional axial chest CT image obtained 5 days after images in A and B confirm presence of lesions (within red box) in right upper lobe. Read more. Image courtesy of the American Roentgen Ray Society (ARRS), American Journal of Roentgenology (AJR)
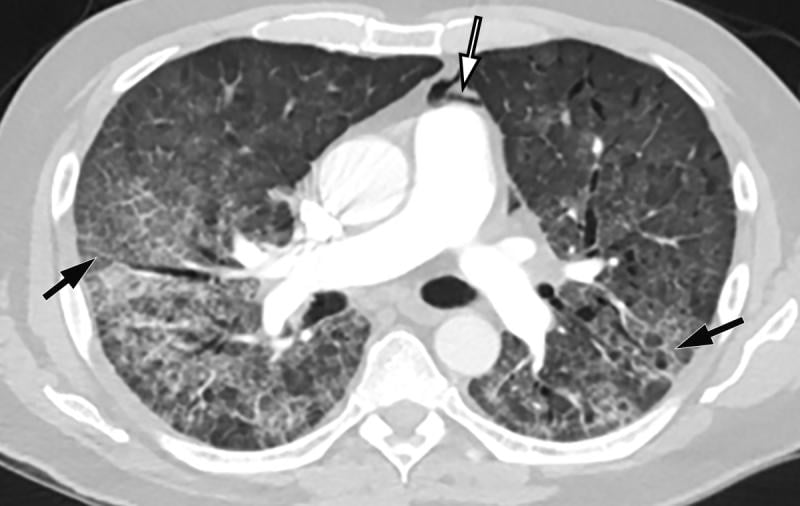
 Computed tomography (CT) showing COVID-19 pneumonia in the lungs with ground glass opacifies (GGOs) seen in typical COVID locations, clinging along the lower sections of the lung walls. See the entire CT dataset scroll through video. Image courtesy of Margarita Revzin et al. Computed tomography (CT) showing COVID-19 pneumonia in the lungs with ground glass opacifies (GGOs) seen in typical COVID locations, clinging along the lower sections of the lung walls. See the entire CT dataset scroll through video. Image courtesy of Margarita Revzin et al.
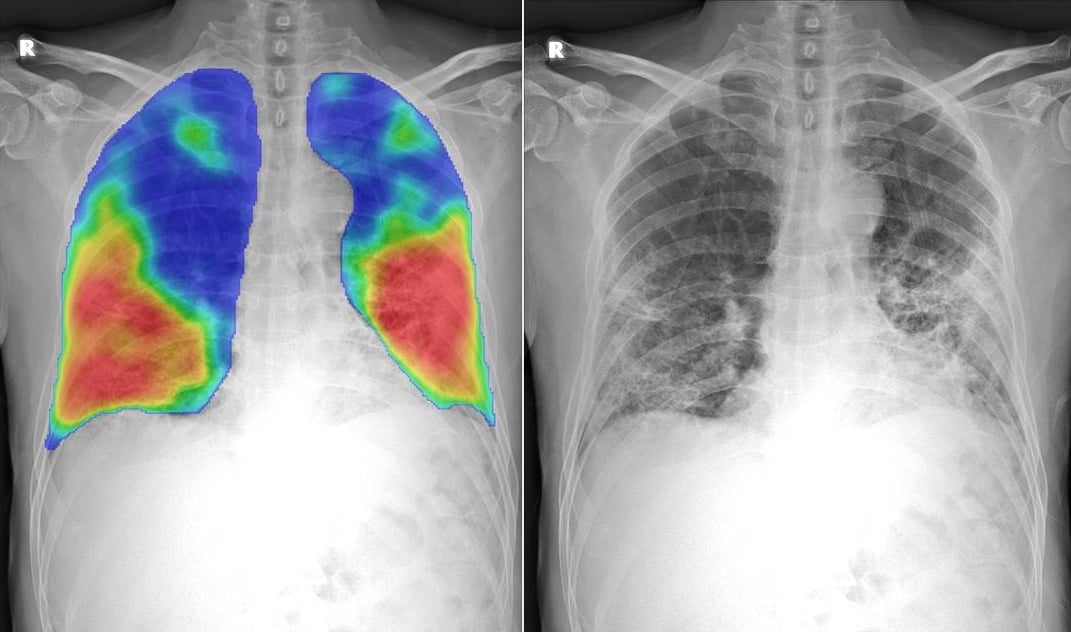
 Numerous vendors have developed artificial intelligence (AI) algorithms to automatically detect and score the severity of COVID-19 pneumonia in the lungs from CT or DR imaging. This chest X-ray shows the CAD4COVID AI software developed by Thirona and Delft Imaging. It will generate a score between 0 and 100 indicating the extent of COVID-19 related abnormalities, display such lung abnormalities through a heatmap and quantify the percentage of the lung that is affected. The COVID areas of the lung appear as wispy white sections in the lower lungs on the X-ray to the right. Read more. Numerous vendors have developed artificial intelligence (AI) algorithms to automatically detect and score the severity of COVID-19 pneumonia in the lungs from CT or DR imaging. This chest X-ray shows the CAD4COVID AI software developed by Thirona and Delft Imaging. It will generate a score between 0 and 100 indicating the extent of COVID-19 related abnormalities, display such lung abnormalities through a heatmap and quantify the percentage of the lung that is affected. The COVID areas of the lung appear as wispy white sections in the lower lungs on the X-ray to the right. Read more.
 Scientists from UCL and the European Synchrotron Research Facility (ESRF) used a new revolutionary imaging technology called Hierarchical Phase-Contrast Tomography (HiP-CT), to scan donated human organs, including lungs from a Covid-19 donor. Scientists from UCL and the European Synchrotron Research Facility (ESRF) used a new revolutionary imaging technology called Hierarchical Phase-Contrast Tomography (HiP-CT), to scan donated human organs, including lungs from a Covid-19 donor.
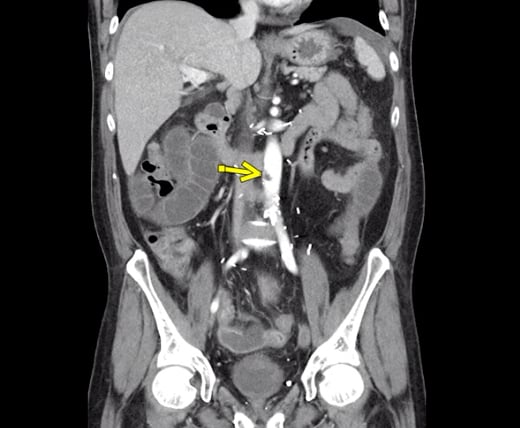
 COVID-19 causes hypercoagulability in many patients. A 76-year-old woman who presented to emergency department with upper back pain. Axial abdominopelvic CT angiogram shows nonocclusive acute aortic thrombus (arrow). Bilateral common iliac artery and left internal iliac artery thrombi (not shown) were also seen, as well as signs of chronic atherosclerotic disease. After findings of concurrently performed chest CT raised concerns, patient was determined to have COVID-19. Read more in the AJR article: ajronline.org COVID-19 causes hypercoagulability in many patients. A 76-year-old woman who presented to emergency department with upper back pain. Axial abdominopelvic CT angiogram shows nonocclusive acute aortic thrombus (arrow). Bilateral common iliac artery and left internal iliac artery thrombi (not shown) were also seen, as well as signs of chronic atherosclerotic disease. After findings of concurrently performed chest CT raised concerns, patient was determined to have COVID-19. Read more in the AJR article: ajronline.org
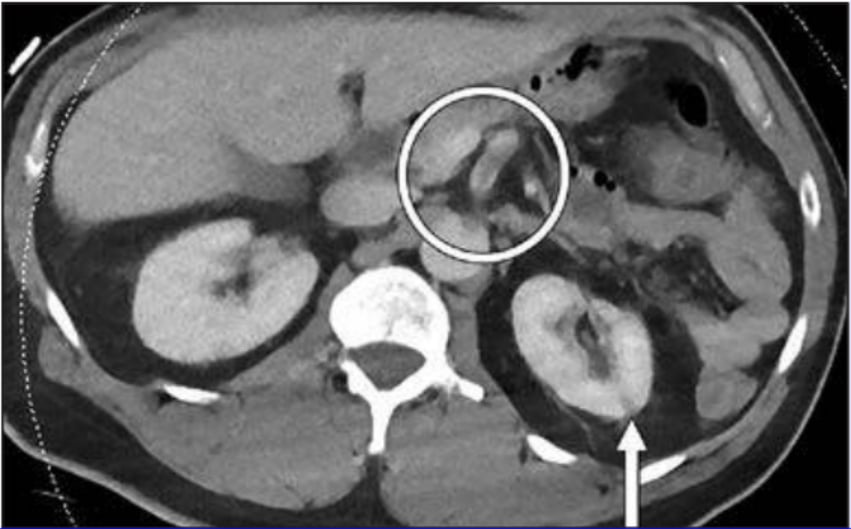
 COVID-19 causes hypercoagulability in many patients. This is a 46-year-old man who was COVID positive. He presented with fever, shortness of breath, epigastric pain, and weakness. Axial IV contrast-enhanced abdominopelvic CT image shows small left renal infarct (arrow) and nonocclusive aortic, celiac artery, and superior mesenteric artery thrombus (circle). Complete common hepatic artery thrombus (not shown) was also seen. Splenic and renal infarctions (not shown) were present, despite patent visualized associated arteries and veins. Concurrently performed IV contrast-enhanced chest CT angiogram (not shown) showed lobar and segmental pulmonary emboli; probable left lower lobe pulmonary infarction rather than pneumonia; and bilateral, multilobar, patchy but confluent ground-glass opacities typical of COVID-19. Read more in the AJR article: ajronline.org COVID-19 causes hypercoagulability in many patients. This is a 46-year-old man who was COVID positive. He presented with fever, shortness of breath, epigastric pain, and weakness. Axial IV contrast-enhanced abdominopelvic CT image shows small left renal infarct (arrow) and nonocclusive aortic, celiac artery, and superior mesenteric artery thrombus (circle). Complete common hepatic artery thrombus (not shown) was also seen. Splenic and renal infarctions (not shown) were present, despite patent visualized associated arteries and veins. Concurrently performed IV contrast-enhanced chest CT angiogram (not shown) showed lobar and segmental pulmonary emboli; probable left lower lobe pulmonary infarction rather than pneumonia; and bilateral, multilobar, patchy but confluent ground-glass opacities typical of COVID-19. Read more in the AJR article: ajronline.org
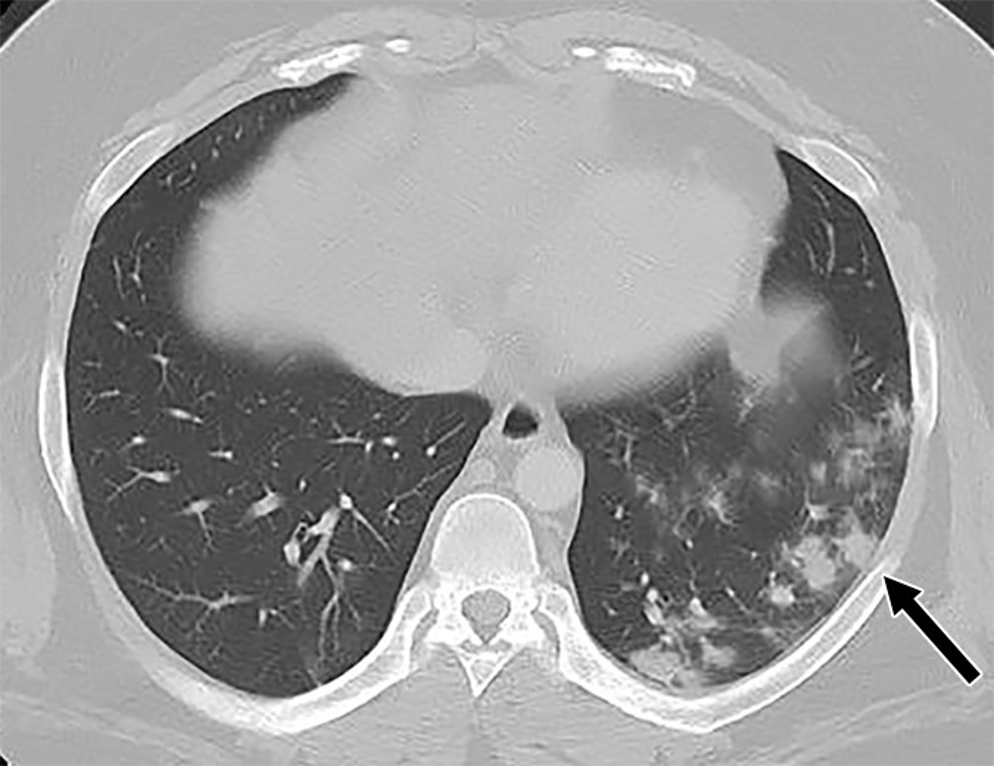
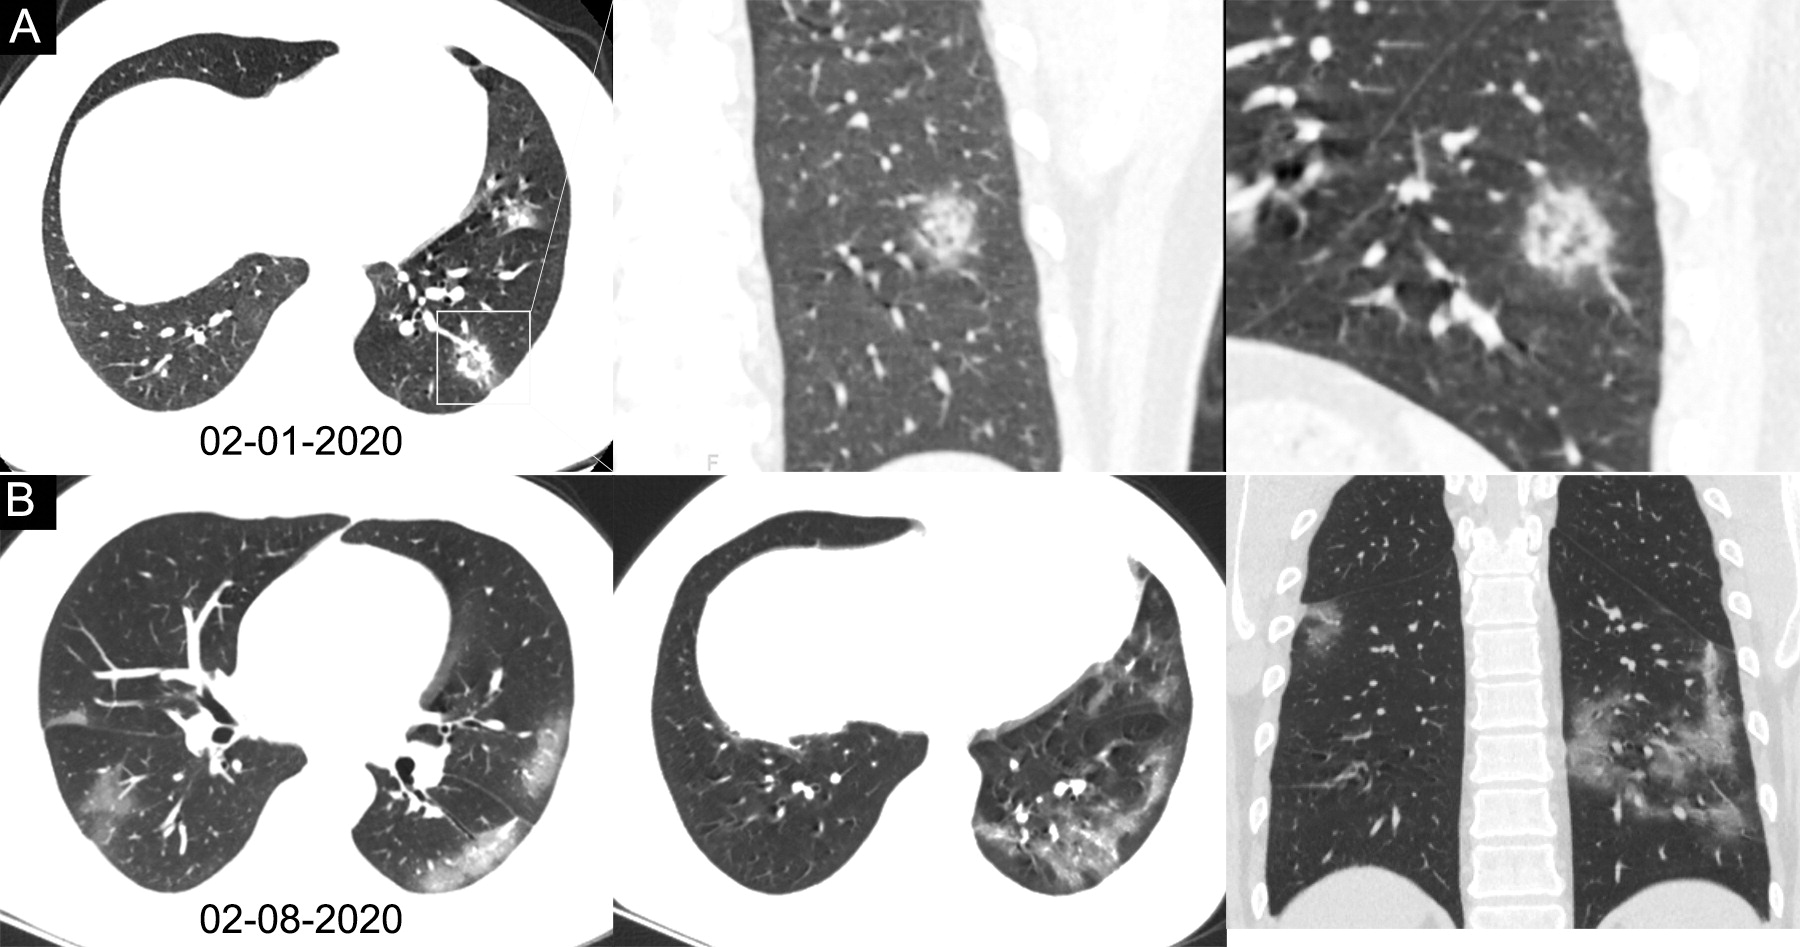
 Chest CT of a 34-year-old man with fever for 4 days. Positive COVIS PCR test was obtained on Feb 8, 2020. Dates of examination are shown on images. A, CT scan with magnification of lesions in coronal and sagittal planes shows a nodule with reversed halo sign in left lower lobe (box) at the early stage of the pneumonia. B, CT scans in different axial planes and coronal reconstruction show bilateral multifocal ground-glass opacities. The nodular opacity resolved. Read more Chest CT of a 34-year-old man with fever for 4 days. Positive COVIS PCR test was obtained on Feb 8, 2020. Dates of examination are shown on images. A, CT scan with magnification of lesions in coronal and sagittal planes shows a nodule with reversed halo sign in left lower lobe (box) at the early stage of the pneumonia. B, CT scans in different axial planes and coronal reconstruction show bilateral multifocal ground-glass opacities. The nodular opacity resolved. Read more
 Artificial intelligence algorithm automatically identifies areas of COVID-19 pneumonia on a lung and quanfities the lesions without huamn intervention to help speed workflow. Several vendors developed COVID-19 specific AI algorithms in 2020, including Siemens and Philips. This is Philips' CT Pulmo Auto Results CT. The software performs automatic lung segmentation and lesion segmentation, together with classification of ground glass opacities/consolidation. Its automatically generated reports include volume summaries and lesion distribution data to help in the quantitative assessment of pulmonary infiltrates, enhancing diagnostic confidence without increasing reading time. Read more Artificial intelligence algorithm automatically identifies areas of COVID-19 pneumonia on a lung and quanfities the lesions without huamn intervention to help speed workflow. Several vendors developed COVID-19 specific AI algorithms in 2020, including Siemens and Philips. This is Philips' CT Pulmo Auto Results CT. The software performs automatic lung segmentation and lesion segmentation, together with classification of ground glass opacities/consolidation. Its automatically generated reports include volume summaries and lesion distribution data to help in the quantitative assessment of pulmonary infiltrates, enhancing diagnostic confidence without increasing reading time. Read more
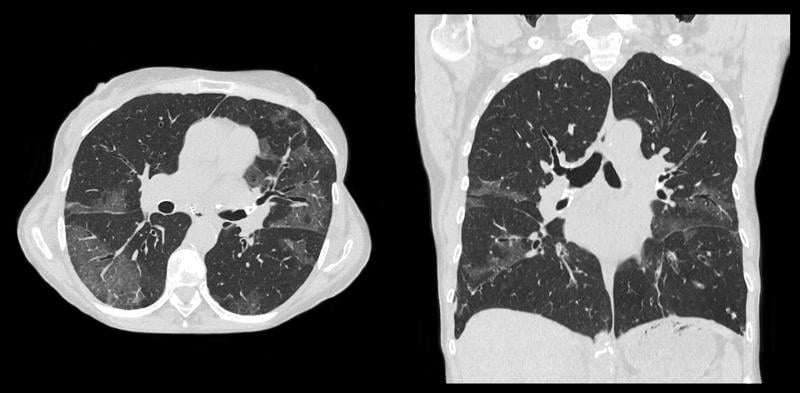 Example of a COVID-19 (SARS-CoV-2) positive patient's lung computed tomography (CT) scan. It shows the typical white, ground glass opacities (GGO) caused by COVID pneumonia. The pneumonia typically appears along the walls of each lobe of the lung, especially the chest wall and the lower portions of the lungs. This scan is from a Canon Aquilion Prime SP CT scanner and used Advanced intelligent Clear-IQ Engine (AiCE), an artificial intelligence-driven image reconstruction software to improve image quality of lower-dose scans. See a COVID lung CT scroll through video from this system. Example of a COVID-19 (SARS-CoV-2) positive patient's lung computed tomography (CT) scan. It shows the typical white, ground glass opacities (GGO) caused by COVID pneumonia. The pneumonia typically appears along the walls of each lobe of the lung, especially the chest wall and the lower portions of the lungs. This scan is from a Canon Aquilion Prime SP CT scanner and used Advanced intelligent Clear-IQ Engine (AiCE), an artificial intelligence-driven image reconstruction software to improve image quality of lower-dose scans. See a COVID lung CT scroll through video from this system.
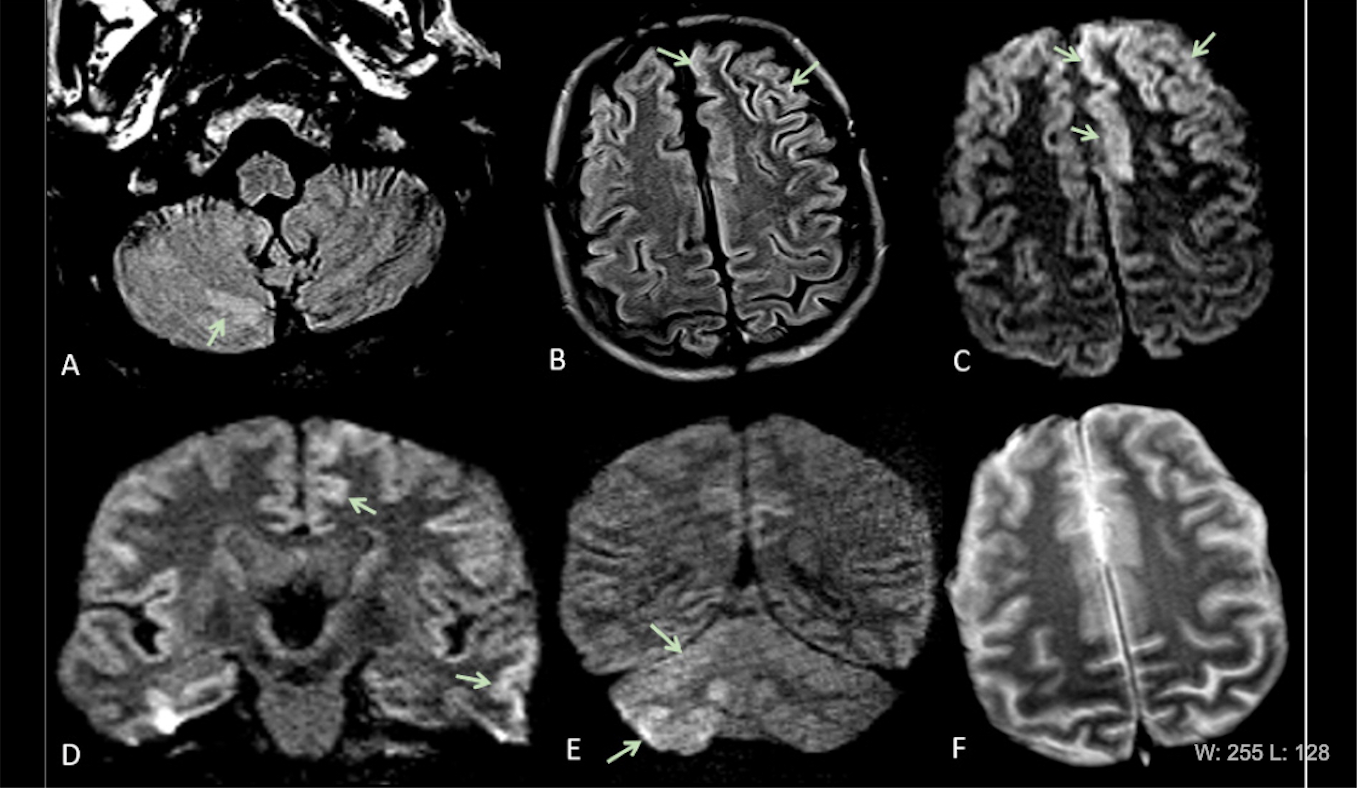
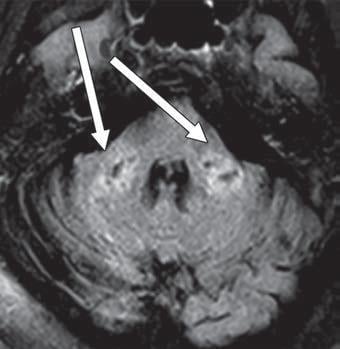
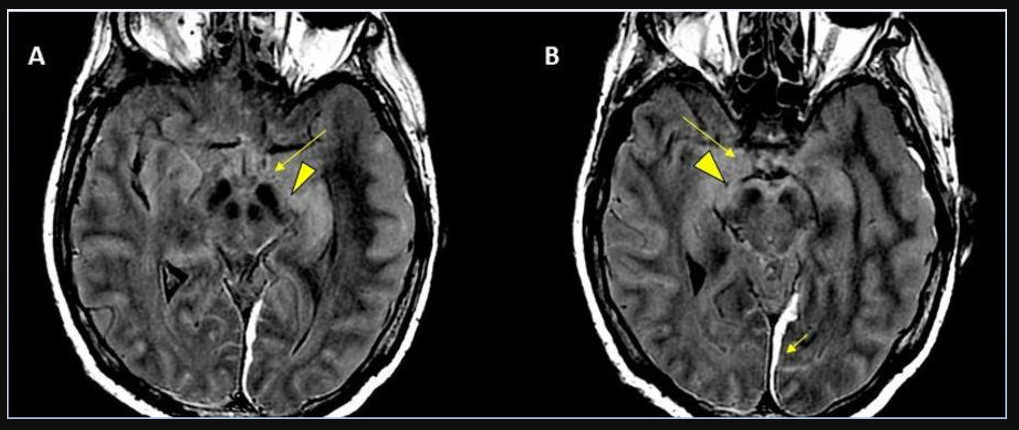
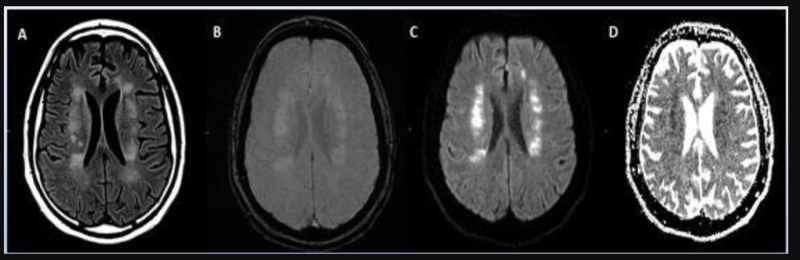
 COVID-19-related disseminated leukoencephalopathy (CRDL) represents an important, although uncommon, differential consideration in patients with neurologic manifestations of coronavirus. Axial FLAIR MR image shows T2 prolongation in bilateral middle cerebellar peduncles (arrows). Findings were associated with restricted diffusion and areas of T1 hypointense signal without enhancement or abnormal susceptibility. Image courtesy of American Roentgen Ray Society (ARRS), American Journal of Roentgenology (AJR). Read more. COVID-19-related disseminated leukoencephalopathy (CRDL) represents an important, although uncommon, differential consideration in patients with neurologic manifestations of coronavirus. Axial FLAIR MR image shows T2 prolongation in bilateral middle cerebellar peduncles (arrows). Findings were associated with restricted diffusion and areas of T1 hypointense signal without enhancement or abnormal susceptibility. Image courtesy of American Roentgen Ray Society (ARRS), American Journal of Roentgenology (AJR). Read more.
 Chest X-ray from patient severely ill from COVID-19, showing (in white patches) infected tissue spread across the lungs. Image courtesy of Nature Publishing or npj Digital Medicine Chest X-ray from patient severely ill from COVID-19, showing (in white patches) infected tissue spread across the lungs. Image courtesy of Nature Publishing or npj Digital Medicine
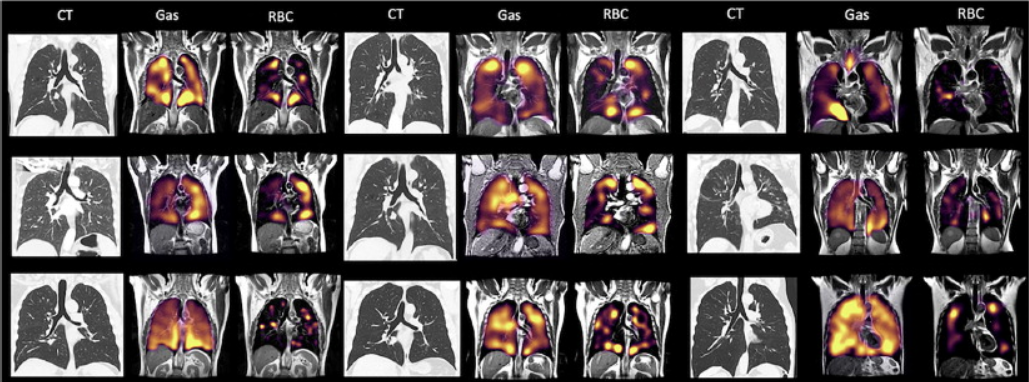
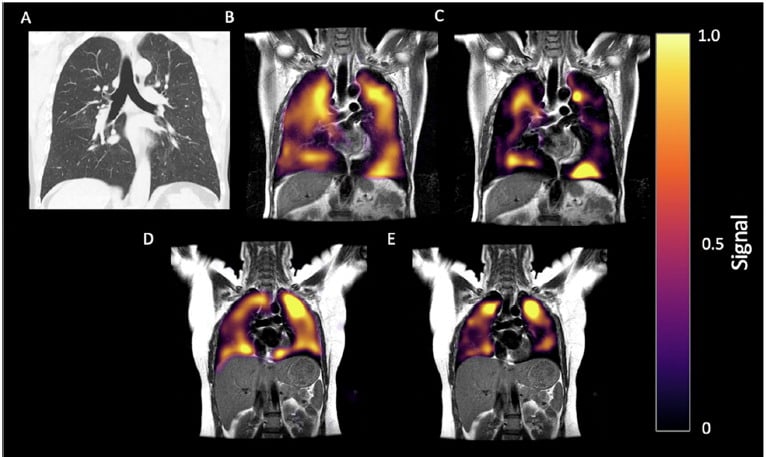
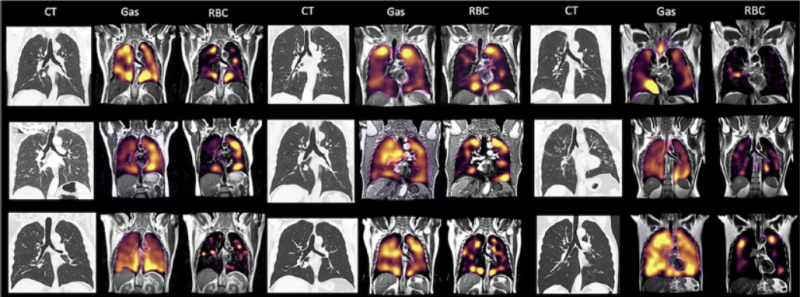
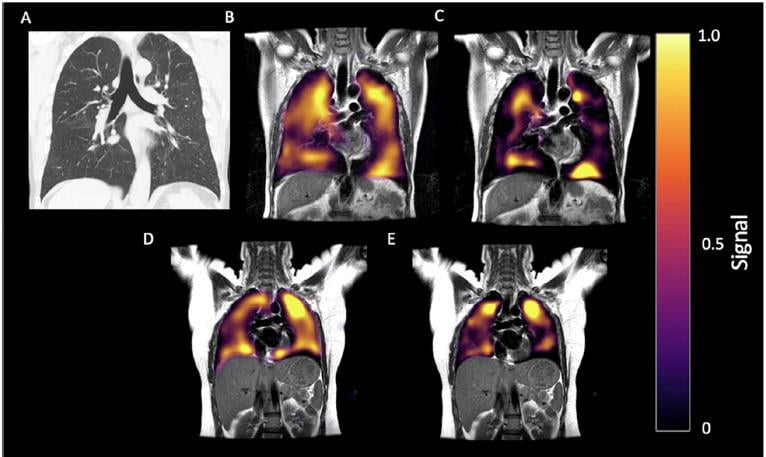 60-year-old man with long-COVID. History of post-COVID breathlessness, shown 172 days after discharge. (A) CT, (B) Xenon-129 MRI imaging of ventilation and (C) RBC phase imaging. (D) Xe-129 MRI gas and (E) RBC phase imaging for a healthy control. Xe-129 MRI images shown in the coronal view for both, with disrupted RBC in the patient due to micro-emboli the the capillaries in the lungs. Read more. Image courtesy of RSNA. 60-year-old man with long-COVID. History of post-COVID breathlessness, shown 172 days after discharge. (A) CT, (B) Xenon-129 MRI imaging of ventilation and (C) RBC phase imaging. (D) Xe-129 MRI gas and (E) RBC phase imaging for a healthy control. Xe-129 MRI images shown in the coronal view for both, with disrupted RBC in the patient due to micro-emboli the the capillaries in the lungs. Read more. Image courtesy of RSNA.
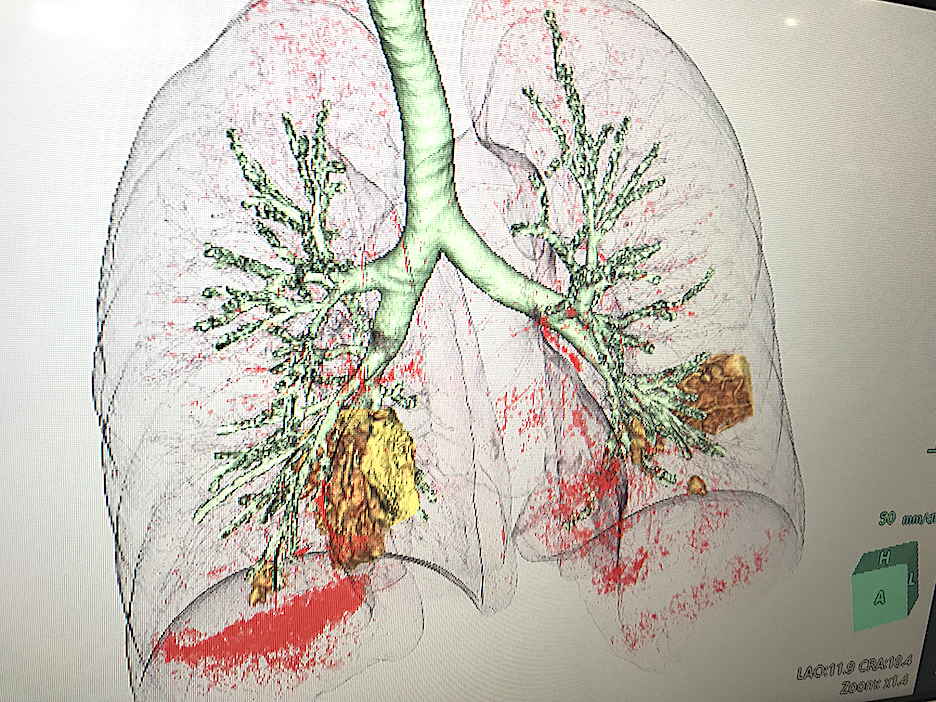
 COVID-19 pneumonia in yellow seen in a CT reconstruction software developed by Fujifilm on its Synapse 7X enterprise imaging system at the Healthcare Information Management Systems Society (HIMSS) 2021 meeting. The software separates are areas of diseased tissue based on the density determined from the CT Hounsfield units. COVID-19 pneumonia in yellow seen in a CT reconstruction software developed by Fujifilm on its Synapse 7X enterprise imaging system at the Healthcare Information Management Systems Society (HIMSS) 2021 meeting. The software separates are areas of diseased tissue based on the density determined from the CT Hounsfield units.
An example of COVID-19 (SARS-CoV-2) pneumonia lung consolidation on ultrasound. See this image moving in the VIDEO: COVID Pneumonia Lung Consolidation on Ultrasound. Image courtesy of Margarita Revzin et al.
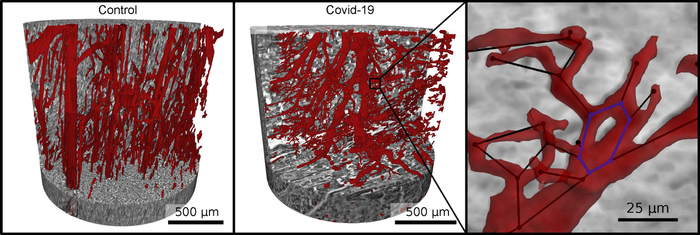
 Vascular network (red) in healthy heart tissue (left) and in severe Covid-19 (right). Due to faulty reforming of the network as a result of Covid-19, numerous branches, splits and even loops develop in the capillaries, which can be analyzed mathematically. Image courtesy of M. Reichardt, P. Møller Jensen, T. Salditt Vascular network (red) in healthy heart tissue (left) and in severe Covid-19 (right). Due to faulty reforming of the network as a result of Covid-19, numerous branches, splits and even loops develop in the capillaries, which can be analyzed mathematically. Image courtesy of M. Reichardt, P. Møller Jensen, T. Salditt
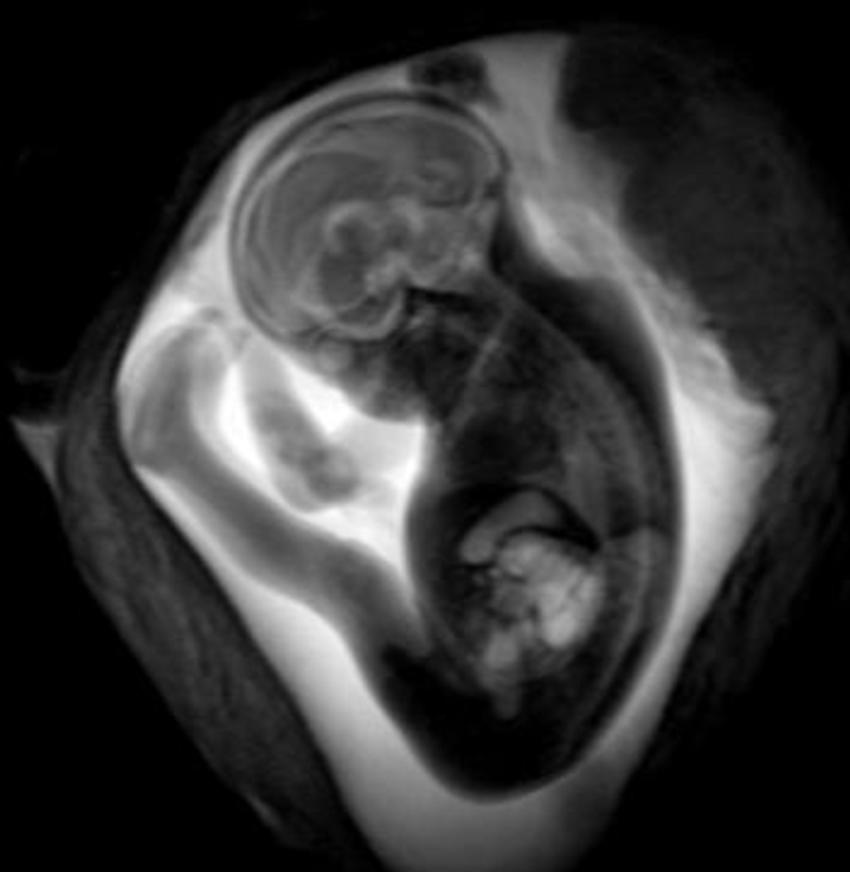
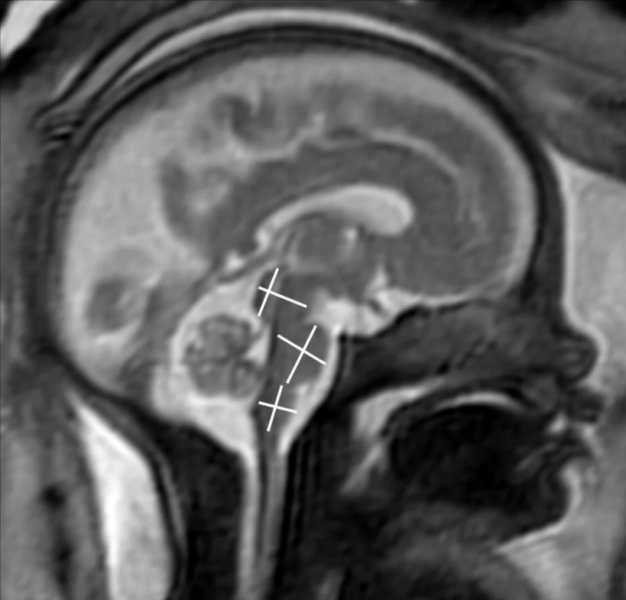 COVID-19 of mild to moderate severity in pregnant women appears to have no effect on the brain of the developing fetus, according to a study being presented today at the annual meeting of the Radiological Society of North America ( RSNA). COVID-19 of mild to moderate severity in pregnant women appears to have no effect on the brain of the developing fetus, according to a study being presented today at the annual meeting of the Radiological Society of North America ( RSNA).
 Two board-certified radiologists with several years of experience in fetal MRI evaluated MRI scans. They found that the brain development in the assessed areas was age-appropriate in all fetuses. There were no findings indicative of infection of the fetal brain. Two board-certified radiologists with several years of experience in fetal MRI evaluated MRI scans. They found that the brain development in the assessed areas was age-appropriate in all fetuses. There were no findings indicative of infection of the fetal brain.
 Stroke seen in a 41-year-old male patient with COVID-19 infection. More images from the study can be found at the bottom of this article. More information can be found here. Stroke seen in a 41-year-old male patient with COVID-19 infection. More images from the study can be found at the bottom of this article. More information can be found here.
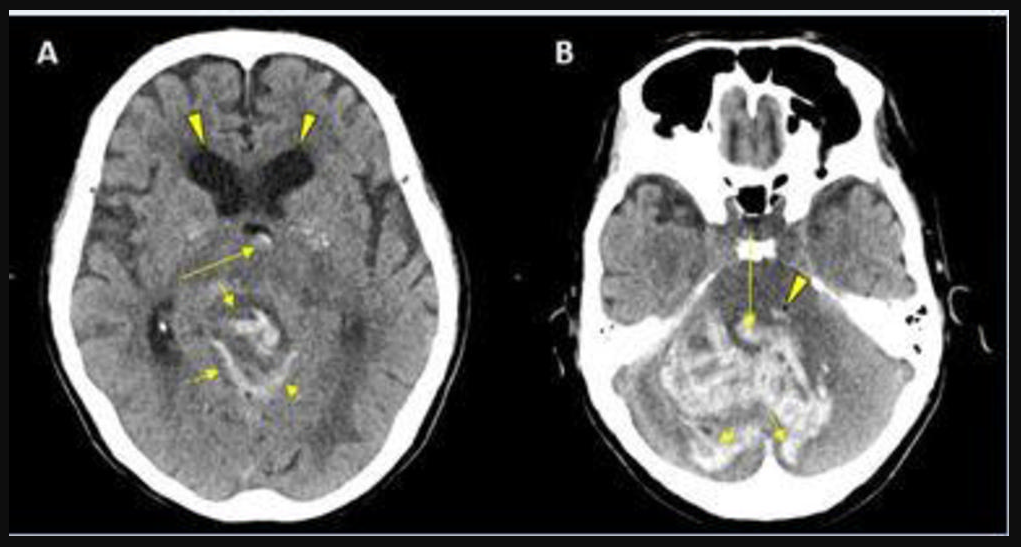
 Acute anterior cerebral artery/middle cerebral artery watershed infarction seen in a 47-year-old male patient who presented with COVID-19 pneumonia. Watershed infarctions occur at the border between cerebral vascular territories where the tissue is furthest from arterial supply and thus most vulnerable to reductions in perfusion, or passage of fluid. Read the full article here. Acute anterior cerebral artery/middle cerebral artery watershed infarction seen in a 47-year-old male patient who presented with COVID-19 pneumonia. Watershed infarctions occur at the border between cerebral vascular territories where the tissue is furthest from arterial supply and thus most vulnerable to reductions in perfusion, or passage of fluid. Read the full article here.
 CT showing hemorrhage in a 68-year-old male patient with COVID-19 infection. Read the full article here. CT showing hemorrhage in a 68-year-old male patient with COVID-19 infection. Read the full article here.
 62-year-old male with a past medical history of hypertension presenting with seizures. Read the full article here. 62-year-old male with a past medical history of hypertension presenting with seizures. Read the full article here.
 49-year-old female with past medical history of mitral valve disease and tricuspid valve regurgitation who developed headache followed by cough and fever presented to the ER with right upper eyelid ptosis (drooping). Read the full article here. 49-year-old female with past medical history of mitral valve disease and tricuspid valve regurgitation who developed headache followed by cough and fever presented to the ER with right upper eyelid ptosis (drooping). Read the full article here.
 MRI shows late gadolinium enhancement (LGE) at the right ventricular attachment (arrow) of a 19-year-old male. Note: this image is for illustrative purposes only and is not associated with the Big Ten study group. Image courtesy of Radiology. Read the full article here. MRI shows late gadolinium enhancement (LGE) at the right ventricular attachment (arrow) of a 19-year-old male. Note: this image is for illustrative purposes only and is not associated with the Big Ten study group. Image courtesy of Radiology. Read the full article here.
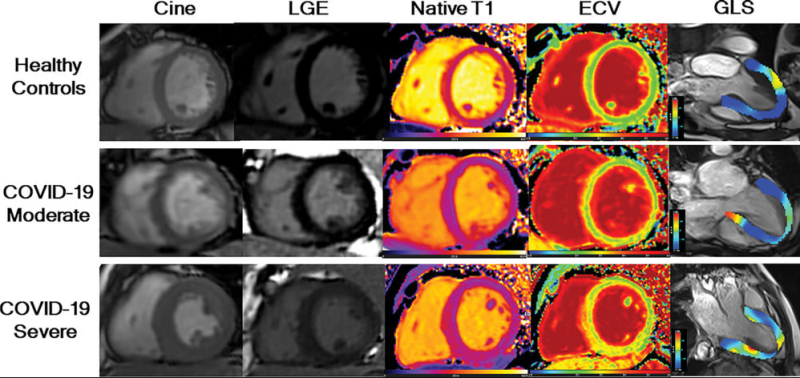 LGE images, native T1 maps, extracellular volume maps, and global longitudinal strain (GLS) show myocardial abnormalities in adults recovering from moderate and severe COVID-19. Note: this image is for illustrative purposes only and is not associated with the Big Ten study group. Image courtesy of Radiology. Related video can be seen here. LGE images, native T1 maps, extracellular volume maps, and global longitudinal strain (GLS) show myocardial abnormalities in adults recovering from moderate and severe COVID-19. Note: this image is for illustrative purposes only and is not associated with the Big Ten study group. Image courtesy of Radiology. Related video can be seen here.
 MRI shows Prominent LGE involving more than 50% of the myocardium in the basal inferolateral and inferior segments of the left ventricle and in the anterolateral, inferolateral, and inferior segments of the left ventricle at the midventricular level in adolescent female. Note: this image is for illustrative purposes only and is not associated with the Big Ten study group. Image courtesy of Radiology: Cardiothoracic Imaging. MRI shows Prominent LGE involving more than 50% of the myocardium in the basal inferolateral and inferior segments of the left ventricle and in the anterolateral, inferolateral, and inferior segments of the left ventricle at the midventricular level in adolescent female. Note: this image is for illustrative purposes only and is not associated with the Big Ten study group. Image courtesy of Radiology: Cardiothoracic Imaging.
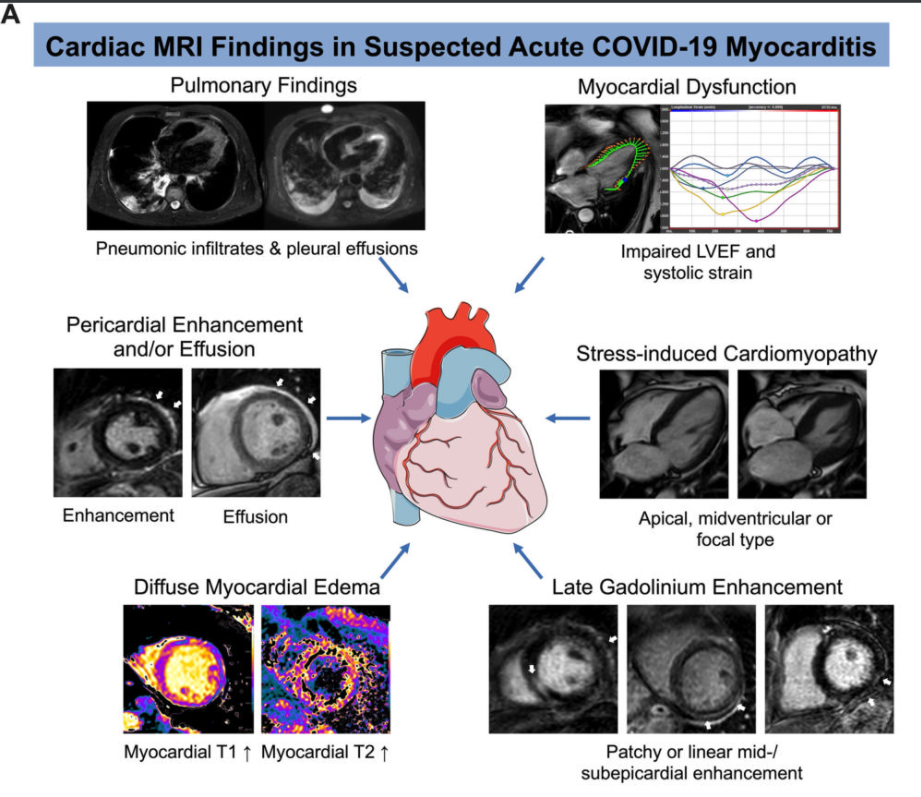
 Example of cardiac MRI findings in suspected acute COVID-19 myocarditis. Note: this image is for illustrative purposes only and is not associated with the Big Ten study group. Image courtesy of Radiology: Cardiothoracic Imaging. Read the full article here. Example of cardiac MRI findings in suspected acute COVID-19 myocarditis. Note: this image is for illustrative purposes only and is not associated with the Big Ten study group. Image courtesy of Radiology: Cardiothoracic Imaging. Read the full article here.
 Colorized scanning electron micrograph of a cell infected with a variant strain of SARS-CoV-2 virus particles (blue), isolated from a patient sample. Image courtesy of NIAID. Read the full article here. Colorized scanning electron micrograph of a cell infected with a variant strain of SARS-CoV-2 virus particles (blue), isolated from a patient sample. Image courtesy of NIAID. Read the full article here.
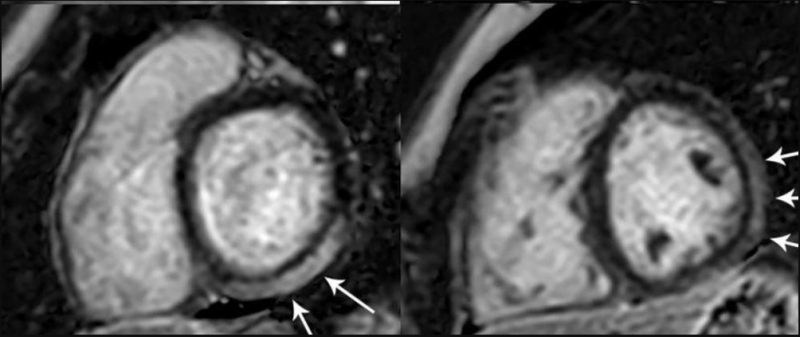
 T1-Based Criteria for Myocarditis on Cardiac MRI in Patients With Recent COVID-19 mRNA Vaccination: Early gadolinium enhancement (EGE) compared with precontrast SSFP sequence (not shown) is observed on early postcontrast short-axis SSFP images in (A) 16-year-old male, (B) 17-year-old male, (C) 16-year-old male, and (D) 19-year-old male, and on early postcontrast short-axis perfusion image in (E) 17-year-old male (arrow, A-E). Late gadolinium enhancement (LGE) is also present (arrows) in all 5 patients (F, G, H, I, and J; same patients as in A, B, C, D, and E, respectively). EGE and LGE predominantly affect subepicardium of the inferior, inferolateral, or anterolateral walls. EGE extends beyond confines of LGE in patient shown in (A) and (F) and in (B) and (G). Basilar LV involvement is present in patient shown in (A) and (F), (B) and (G), and (C) and (H). Mid-cavity LV involvement is present in patient shown in (D) and (I) and in (E) and (J). T1-Based Criteria for Myocarditis on Cardiac MRI in Patients With Recent COVID-19 mRNA Vaccination: Early gadolinium enhancement (EGE) compared with precontrast SSFP sequence (not shown) is observed on early postcontrast short-axis SSFP images in (A) 16-year-old male, (B) 17-year-old male, (C) 16-year-old male, and (D) 19-year-old male, and on early postcontrast short-axis perfusion image in (E) 17-year-old male (arrow, A-E). Late gadolinium enhancement (LGE) is also present (arrows) in all 5 patients (F, G, H, I, and J; same patients as in A, B, C, D, and E, respectively). EGE and LGE predominantly affect subepicardium of the inferior, inferolateral, or anterolateral walls. EGE extends beyond confines of LGE in patient shown in (A) and (F) and in (B) and (G). Basilar LV involvement is present in patient shown in (A) and (F), (B) and (G), and (C) and (H). Mid-cavity LV involvement is present in patient shown in (D) and (I) and in (E) and (J).
 18F-FDG PET in patients with long-COVID syndrome. A and B: Transaxial sections of group averaged, spatially normalized 18F-FDG PET scans in patients with long-COVID syndrome (A) and control patients (B). C: The pattern expression score (PES; *adjusted for age and sex, for illustration purposes) of the previously established COVID-19-related spatial covariance pattern was not significantly different between patients with long-COVID syndrome and control patients. Boxplots (grey), as well as individual values for COVID-19 patients (red) and the control cohort (green), are displayed. Image created by Dressing et al., Medical Center – University of Freiburg, Faculty of Medicine, University of Freiburg, Freiburg, Germany. 18F-FDG PET in patients with long-COVID syndrome. A and B: Transaxial sections of group averaged, spatially normalized 18F-FDG PET scans in patients with long-COVID syndrome (A) and control patients (B). C: The pattern expression score (PES; *adjusted for age and sex, for illustration purposes) of the previously established COVID-19-related spatial covariance pattern was not significantly different between patients with long-COVID syndrome and control patients. Boxplots (grey), as well as individual values for COVID-19 patients (red) and the control cohort (green), are displayed. Image created by Dressing et al., Medical Center – University of Freiburg, Faculty of Medicine, University of Freiburg, Freiburg, Germany.
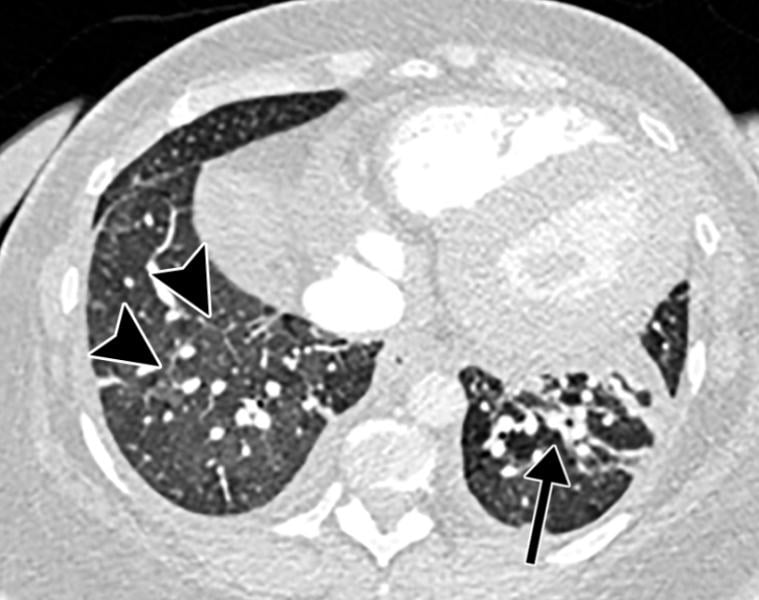
 In the STOIC study, readers classified CT exams as COVID positive, COVID negative or normal. The readers had access to the CT scans using a 3-D image visualization web application, allowing scrolling through the entire lung volume in the coronal, sagittal or axial transverse plane. The CT scan shown here has been classified as COVID positive due to the presence of bilateral ground glass opacities and absence of features such as mucoid impaction, bronchiolar nodules, segmental or lobar consolidation. Image courtesy of RSNA In the STOIC study, readers classified CT exams as COVID positive, COVID negative or normal. The readers had access to the CT scans using a 3-D image visualization web application, allowing scrolling through the entire lung volume in the coronal, sagittal or axial transverse plane. The CT scan shown here has been classified as COVID positive due to the presence of bilateral ground glass opacities and absence of features such as mucoid impaction, bronchiolar nodules, segmental or lobar consolidation. Image courtesy of RSNA
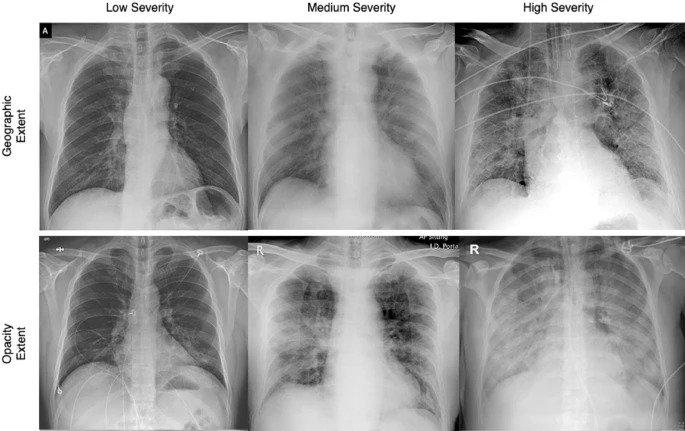
 Chest X-rays used in the COVID-Net study show differing infection extent and opacity in the lungs of COVID-19 patients. Image courtesy of University of Waterloo Chest X-rays used in the COVID-Net study show differing infection extent and opacity in the lungs of COVID-19 patients. Image courtesy of University of Waterloo
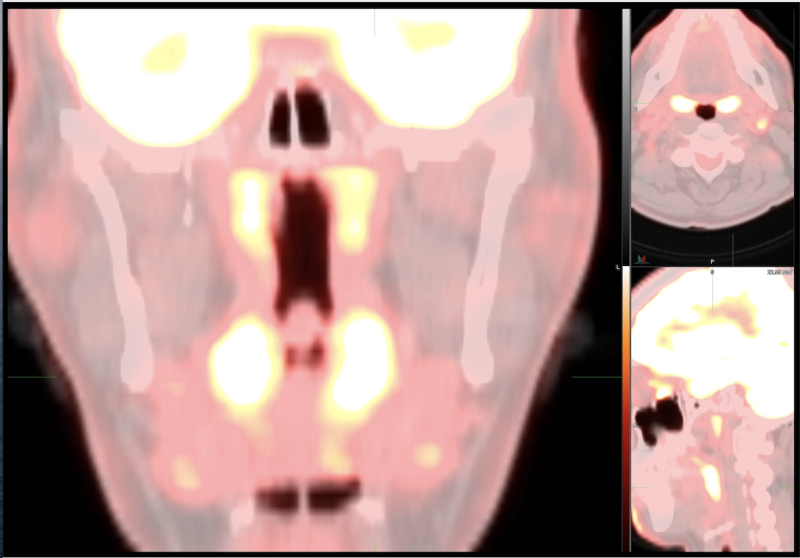
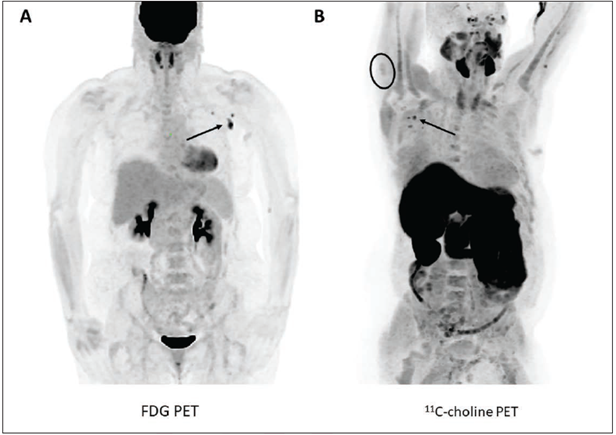 According to an open-access article in ARRS’ American Journal of Roentgenology (AJR), increased axillary lymph node or ipsilateral deltoid uptake is occasionally observed on FDG or 11C-choline PET performed after Pfizer-BioNTech or Moderna COVID-19 vaccination. According to an open-access article in ARRS’ American Journal of Roentgenology (AJR), increased axillary lymph node or ipsilateral deltoid uptake is occasionally observed on FDG or 11C-choline PET performed after Pfizer-BioNTech or Moderna COVID-19 vaccination.
(A) 57-year-old woman with right upper arm melanoma who received the first dose of the COVID-19 vaccine (Pfizer-BioNTech) in the left deltoid 15 days prior to FDG PET/CT. FDG uptake is observed within left axillary lymph nodes (arrow, SUVmax = 9.3).
(B) 62-year-old man with metastatic prostate carcinoma who received the second dose of COVID-19 vaccine (Pfizer-BioNTech) in the right deltoid 7 days prior to 11C-choline PET/CT. 11C-choline uptake is observed within right axillary lymph nodes (arrows, SUVmax = 3.1) as well as the right deltoid muscle (circle, SUVmax = 1.7).
 Chest X-ray from patient severely ill from COVID-19, showing (in white patches) infected tissue spread across the lungs. Image courtesy of Nature Publishing or npj Digital Medicine Chest X-ray from patient severely ill from COVID-19, showing (in white patches) infected tissue spread across the lungs. Image courtesy of Nature Publishing or npj Digital Medicine
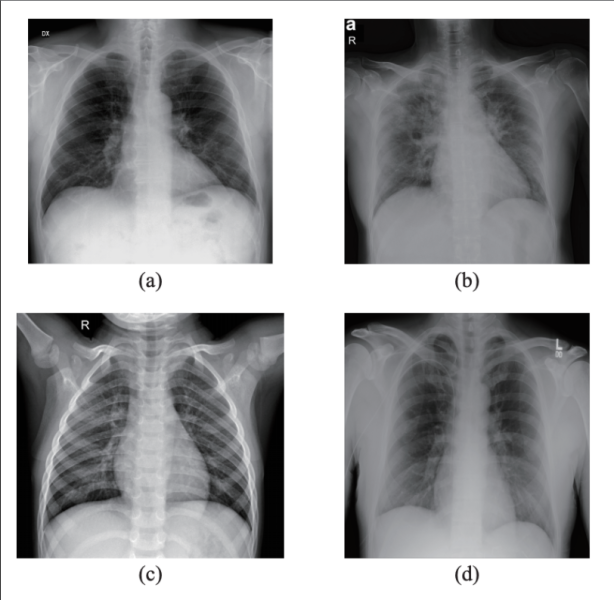 X-rays, first used clinically in the late 1890s, could be a leading-edge diagnostic tool for COVID-19 patients with the help of artificial intelligence, according to a team of researchers in Brazil who taught a computer program, through various machine learning methods, to detect COVID-19 in chest X-rays with 95.6 to 98.5% accuracy. They published their results in IEEE/CAA Journal of Automatica Sinica, a joint publication of the IEEE and the Chinese Association of Automation. X-rays, first used clinically in the late 1890s, could be a leading-edge diagnostic tool for COVID-19 patients with the help of artificial intelligence, according to a team of researchers in Brazil who taught a computer program, through various machine learning methods, to detect COVID-19 in chest X-rays with 95.6 to 98.5% accuracy. They published their results in IEEE/CAA Journal of Automatica Sinica, a joint publication of the IEEE and the Chinese Association of Automation.
This image shows samples from the dataset used in this study. (a) X-ray with PA view of a patient with COVID-19; (b) X-ray with AP view of a patient with COVID-19; (c) X-ray of a healthy patient from Dataset A; (d) X-ray of a healthy patient from Dataset B. Images courtesy of IEEE/CAA JOURNAL OF AUTOMATICA SINICA
This photo gallery shows the variety of radiological presentations of COVID-19 (SARS-CoV-2) in medical imaging, including computed tomography (CT), radiograph X-rays, ultrasound, echocardiograms and magnetic resonance imaging (MRI). The radiology images show examples of typical COVID pneumonia in the lungs and the numerous complications the virus causes in the body in multiple organs, including the brain, kidneys, heart, abdomen and vascular system.
Ultrasound, especially hand-held ultrasound imaging devices, have become a primary imaging modality for novel coronavirus because of the ease to bag the device and sterilize it after use. CT and mobile X-ray systems are also used as front-line imaging systems for COVID-positive or suspected COVID patients.
The images were collected from physicians, study authors, universities and hospitals, the National Institutes of Health (NIH), the Radiological Society of North America ( RSNA), the American College of Radiology (ACR), Centers for Disease Control and Prevention (CDC) and radiology technology vendors.
CLICK on the images below to show the caption information.
New images will be added throughout 2022, as the world continues to face the struggles of the Omicron variant. Image submissions with caption information can be sent to melinda.taschetta-millane@waincotmedia.com.
Watch the related VIDEO: How to Image COVID-19 and Radiological Presentations of the Virus — Interview with Margarita Revzin, M.D.
  <a href="https://www.itnonline.com/sites/default/files/SARS-CoV-2.png" class="photoswipe" data-size="520x564" data-overlay-title="Expression of SARS-CoV-2 receptors in human cardiac PCs in situ: Immunofluorescence stainings showing PCs in the human heart. (A,B) Identification of CD31-CD34+PDGFRß+ PCs around microvessels. CD31 recognises the vessel lumen, the CD34 labels both the luminal ECs and perivascular PCs, while PDGFRß labels both PCs and vascular smooth muscle cells (VSMCs) in the arteriole’s tunica media. (C–F) A subset of PDGFRß+ cardiac PCs express ACE2 (C,D) and CD147 (E,F). a-SMA labels some PCs and arterioles’ VSMCs (C,D), while vWF recognises ECs (E,F). CD147 is also expressed by ECs (E,F). Arrowheads point to PCs. Image courtesy of Clinical Science Read the full story here <a href="https://www.itnonline.com/sites/default/files/SARS-CoV-2.png" class="photoswipe" data-size="520x564" data-overlay-title="Expression of SARS-CoV-2 receptors in human cardiac PCs in situ: Immunofluorescence stainings showing PCs in the human heart. (A,B) Identification of CD31-CD34+PDGFRß+ PCs around microvessels. CD31 recognises the vessel lumen, the CD34 labels both the luminal ECs and perivascular PCs, while PDGFRß labels both PCs and vascular smooth muscle cells (VSMCs) in the arteriole’s tunica media. (C–F) A subset of PDGFRß+ cardiac PCs express ACE2 (C,D) and CD147 (E,F). a-SMA labels some PCs and arterioles’ VSMCs (C,D), while vWF recognises ECs (E,F). CD147 is also expressed by ECs (E,F). Arrowheads point to PCs. Image courtesy of Clinical Science Read the full story here
" style="box-sizing: border-box; margin: 0px; padding: 10px; background-color: transparent; color: rgb(99, 140, 195); border: 0px; vertical-align: baseline; outline: 0px; font-weight: 700; display: inline-block;">  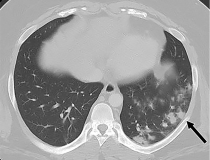 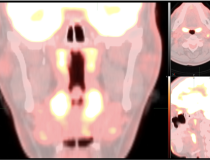   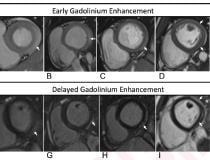 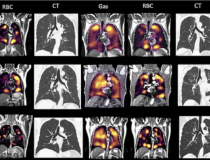 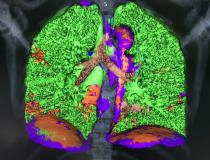 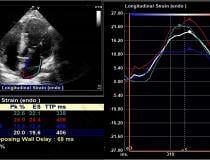 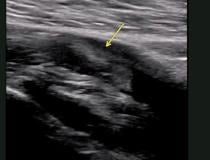 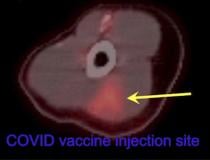    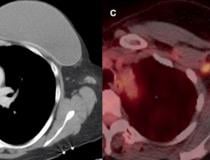 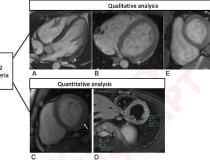 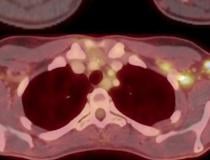 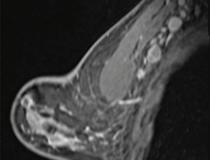 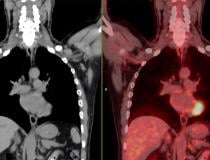 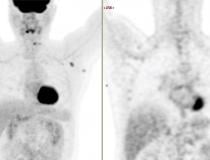 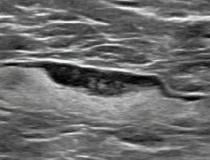 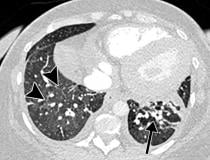   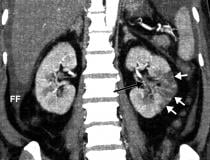 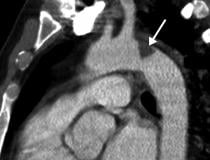 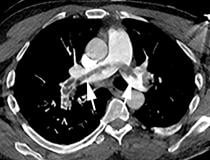 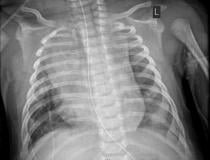 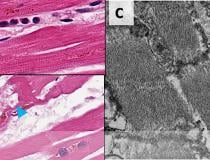 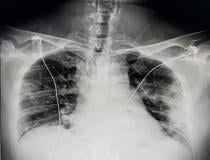 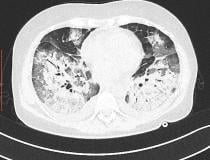  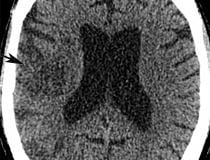 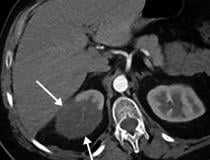 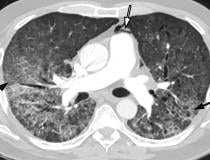 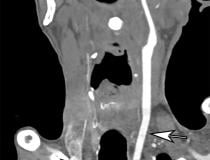 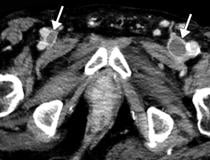 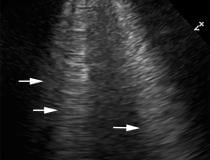 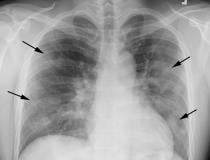 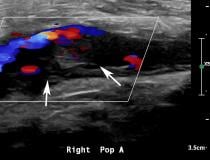 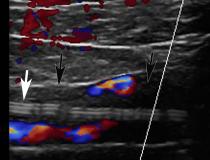 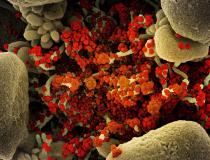 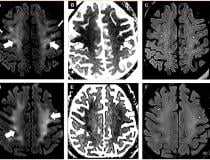 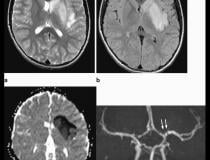 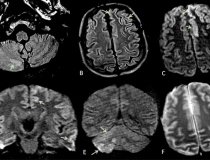 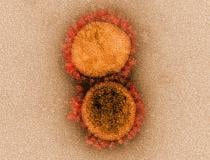 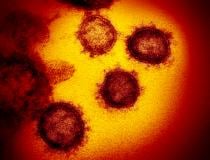 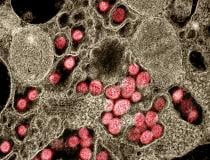 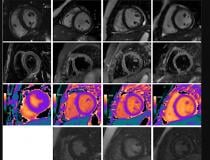 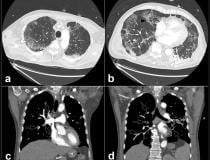 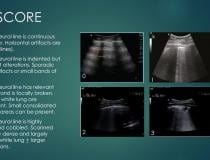 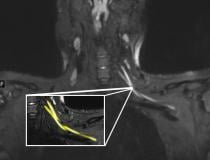 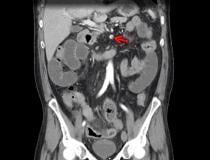 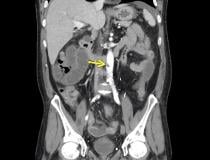 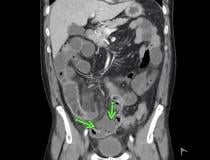 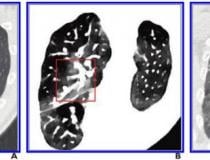 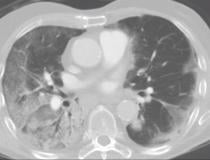 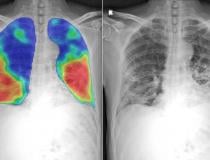  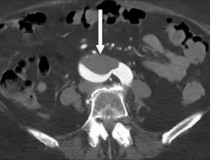    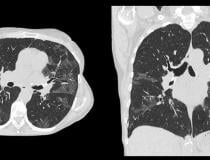  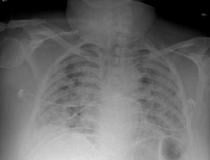 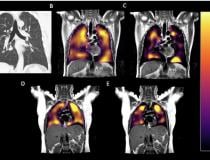  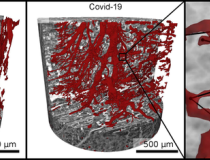 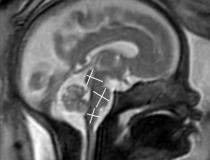  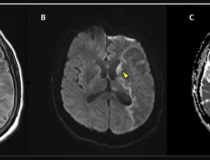 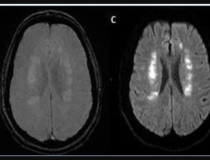 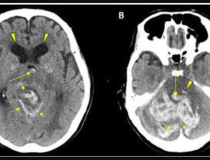 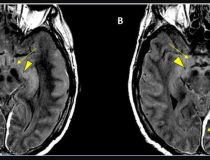 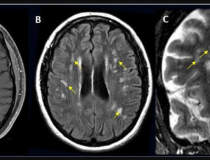 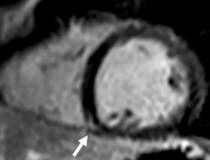 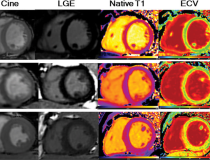 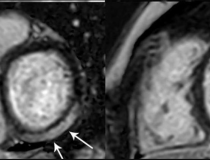 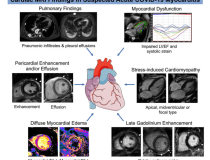   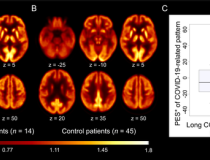 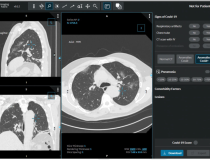  <a href="https://www.itnonline.com/sites/default/files/PET_Images%20%281%29.png" class="photoswipe" data-size="616x435" data-overlay-title="According to an open-access article in ARRS’ American Journal of Roentgenology (AJR), increased axillary lymph node or ipsilateral deltoid uptake is occasionally observed on FDG or 11C-choline PET performed after Pfizer-BioNTech or Moderna COVID-19 vaccination. <a href="https://www.itnonline.com/sites/default/files/PET_Images%20%281%29.png" class="photoswipe" data-size="616x435" data-overlay-title="According to an open-access article in ARRS’ American Journal of Roentgenology (AJR), increased axillary lymph node or ipsilateral deltoid uptake is occasionally observed on FDG or 11C-choline PET performed after Pfizer-BioNTech or Moderna COVID-19 vaccination.
(A) 57-year-old woman with right upper arm melanoma who received the first dose of the COVID-19 vaccine (Pfizer-BioNTech) in the left deltoid 15 days prior to FDG PET/CT. FDG uptake is observed within left axillary lymph nodes (arrow, SUVmax = 9.3).
(B) 62-year-old man with metastatic prostate carcinoma who received the second dose of COVID-19 vaccine (Pfizer-BioNTech) in the right deltoid 7 days prior to 11C-choline PET/CT. 11C-choline uptake is observed within right axillary lymph nodes (arrows, SUVmax = 3.1) as well as the right deltoid muscle (circle, SUVmax = 1.7).
" style="box-sizing: border-box; margin: 0px; padding: 10px; background-color: transparent; color: rgb(99, 140, 195); border: 0px; vertical-align: baseline; outline: 0px; font-weight: 700; display: inline-block;">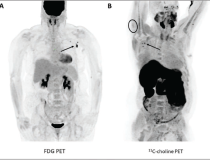 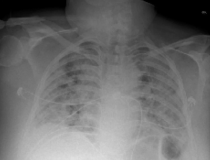 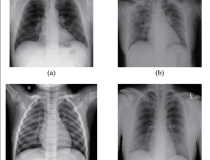
CURRENT ISSUE
January/February 2022

SUBSCRIBE TO MAGAZINE
SUBSCRIBE TO NEWSLETTERS
ISSUE ARCHIVES
VIEW DIGITAL EDITION
itnTV
Fujifilm Velocity Unveiling at RSNA21
Play Video
VIDEO: Fujifilm Launches Velocity MRI System at RSNA21
See All Videos
COMPARISON CHARTS
Radiation Therapy Quality Assurance Platforms
Artificial Intelligence
Mobile DR Systems
Cardiac CT Systems
3-D Printing and Printing Services
See All Comparison Charts |
|