What 'they' earlier said about gold
bloomberg.com
Gold's Bad Vaccine Year May Contain a Troubling Message
The metal’s strange decline at a time of surging inflation may signal a possible tantrum in the bond market and a correction in stocks.
John Authers
9 November 2021, 13:00 GMT+8
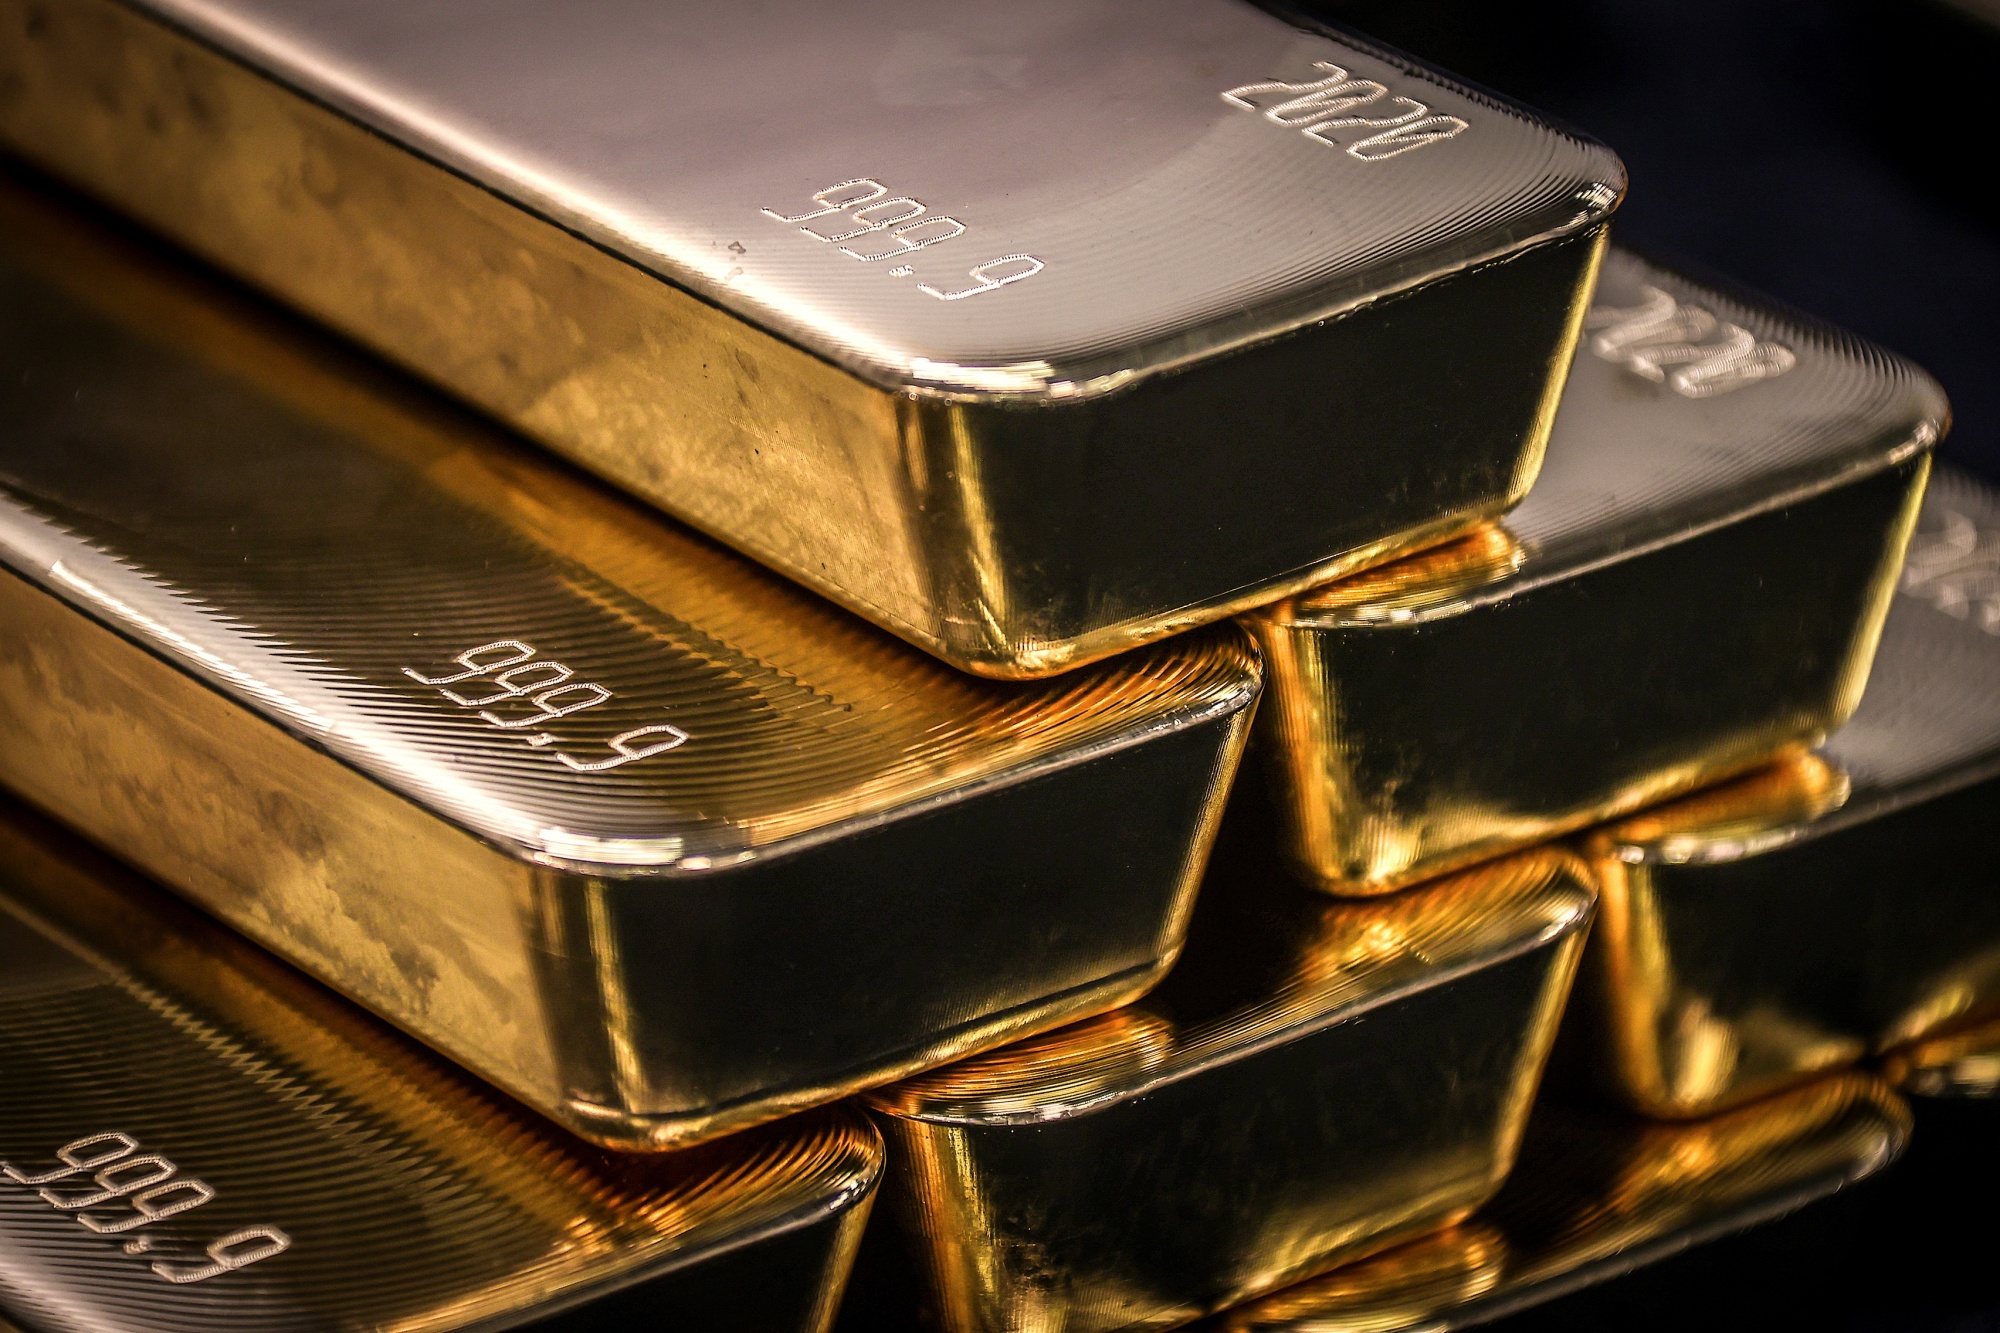
Gold should be shining at a time like this. What does it mean that it isn't?
Photographer: DAVID GRAY/AFP/Getty Images
Happy Vaccine Day!It’s been 12 months. On Nov. 9 last year, Pfizer Inc. awoke the world to the triumphant news that it had developed a vaccine for Covid-19 that worked.
It was one of the clearest market turning points in memory. As far as most of us were concerned, it was also one of the best items of news we could remember. It came as a double whammy, with the market also having its first chance to react to the announcement over the weekend that Joe Biden had emerged victorious in the presidential election.
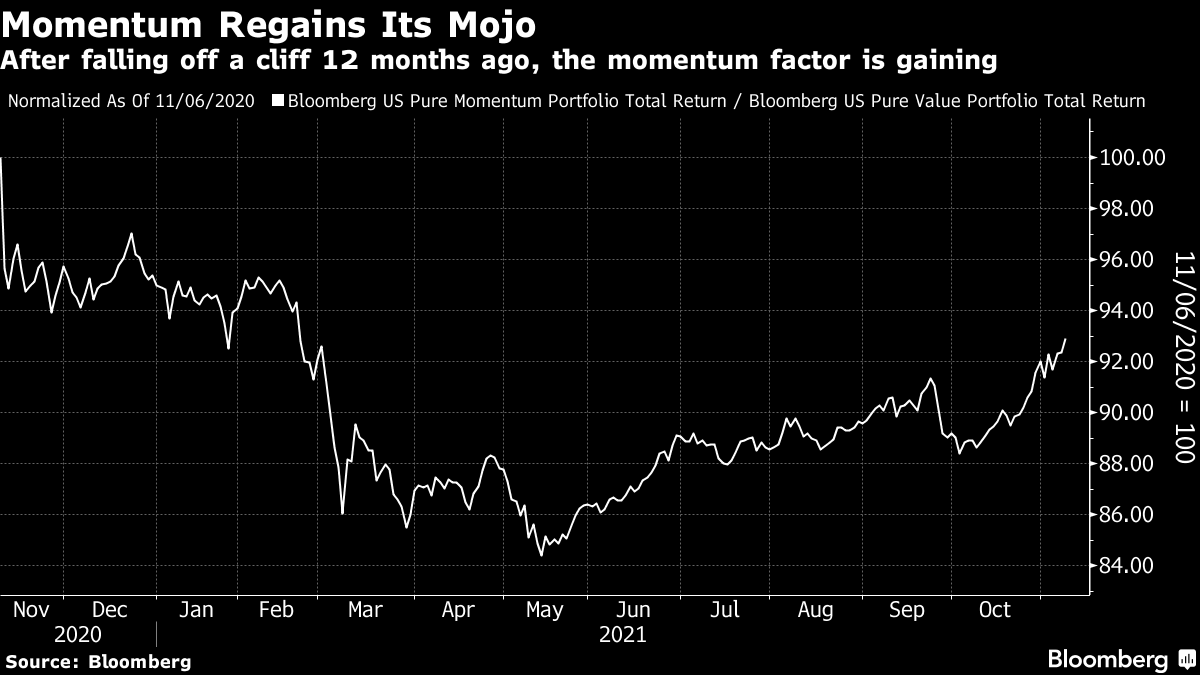
There are different ways to measure the stock market phenomenon of momentum — the tendency of winners to keep winning and losers to keep losing — but there’s a fair argument that Vaccine Monday saw the biggest reversal on record. Money surged into stocks that would benefit from an end to the pandemic, and out of 2020’s established winners. It appeared to be the moment when value investing could take over again. Judging by Bloomberg’s FTW (Factors To Watch) function, that promise wasn’t totally fulfilled. This is how momentum has fared compared to value over the past year:
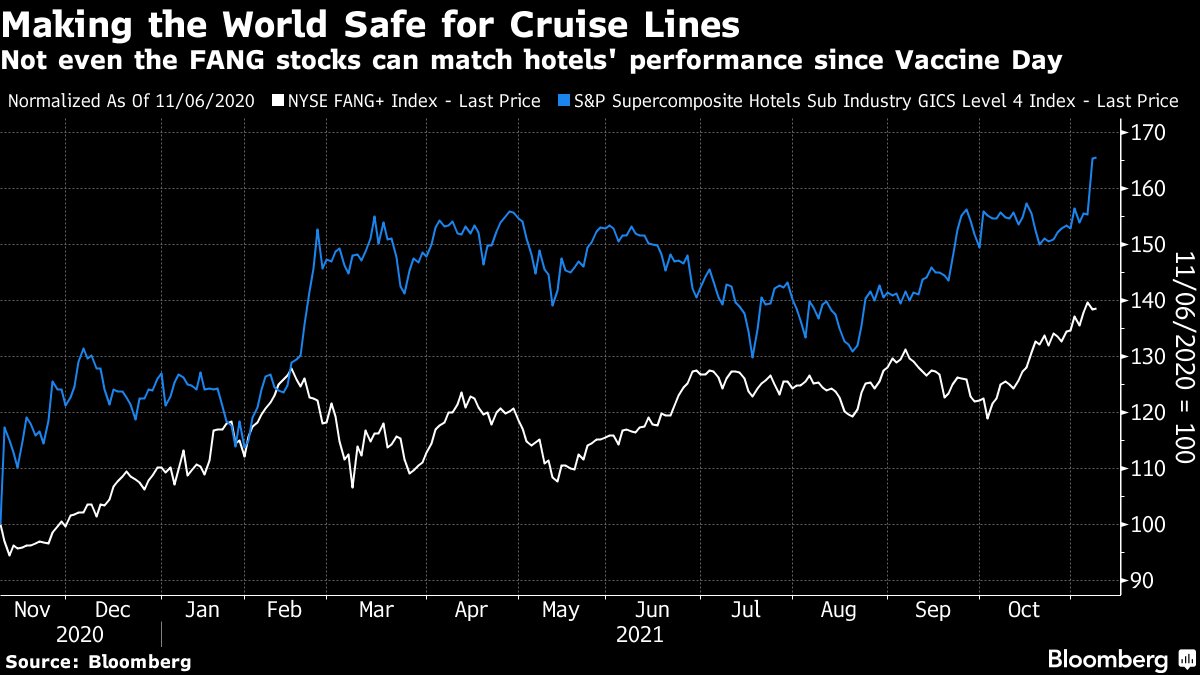
By coincidence, the end of last week brought one of the best news developments since then, with Pfizer’s statement that it has a pill seemingly capable of keeping Covid patients alive and out of the hospital. That helped a fantastic run for the sectors most harmed by the pandemic. If you had bought into the S&P 1500 hotels, resorts and cruise lines sub-index before trading opened last Nov. 9, you would have done far better than by putting the money into the NYSE Fang+ index. And bear in mind, that includes Tesla Inc. Opportunistic value buying is and will continue to be a great way to make money:
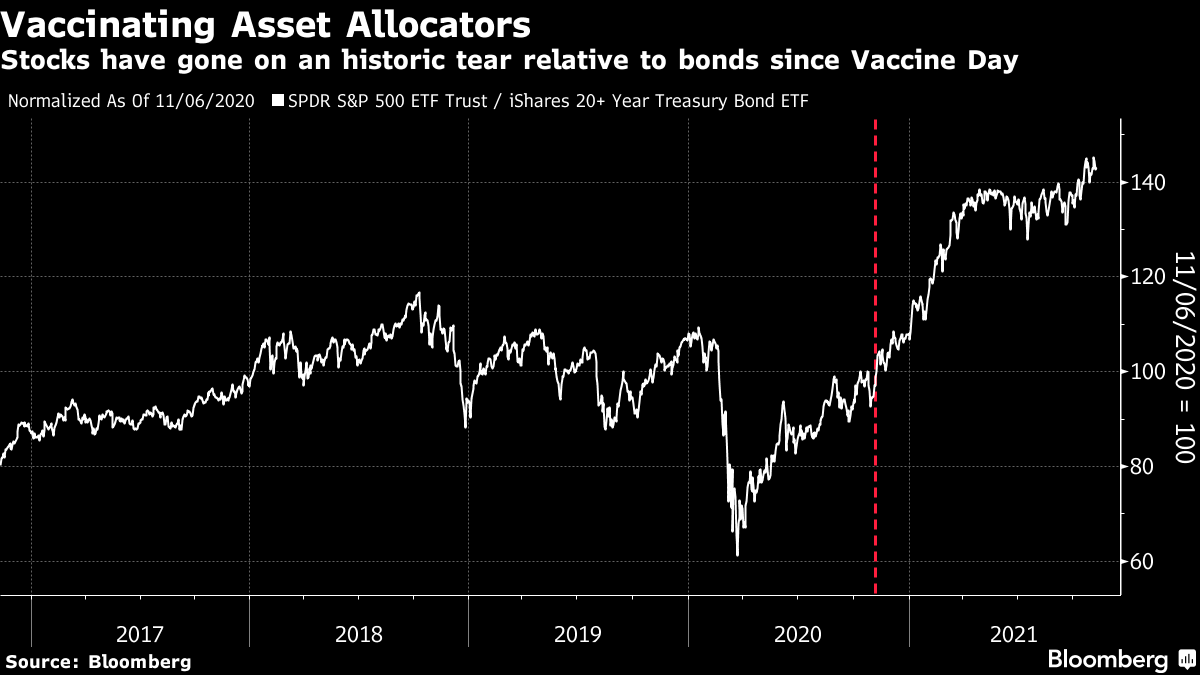
At the time, the belief was that vaccines would unleash a “reflation trade.” Much has gone wrong since then. We have lived through the alpha and delta variants, a horrifying outbreak in India, outcry over a slow start to vaccination programs in the U.S. and particularly Europe, a public relations disaster for the Oxford University/AstraZeneca vaccine, and most recently a bitter controversy over mandates. But the belief that vaccines would spark an enduring reflation trade has rung true. For evidence just look at the way stocks started to outstrip bonds, and inflation-linked securities started to beat those paying fixed coupons, once a vaccine no longer seemed a pipe dream:
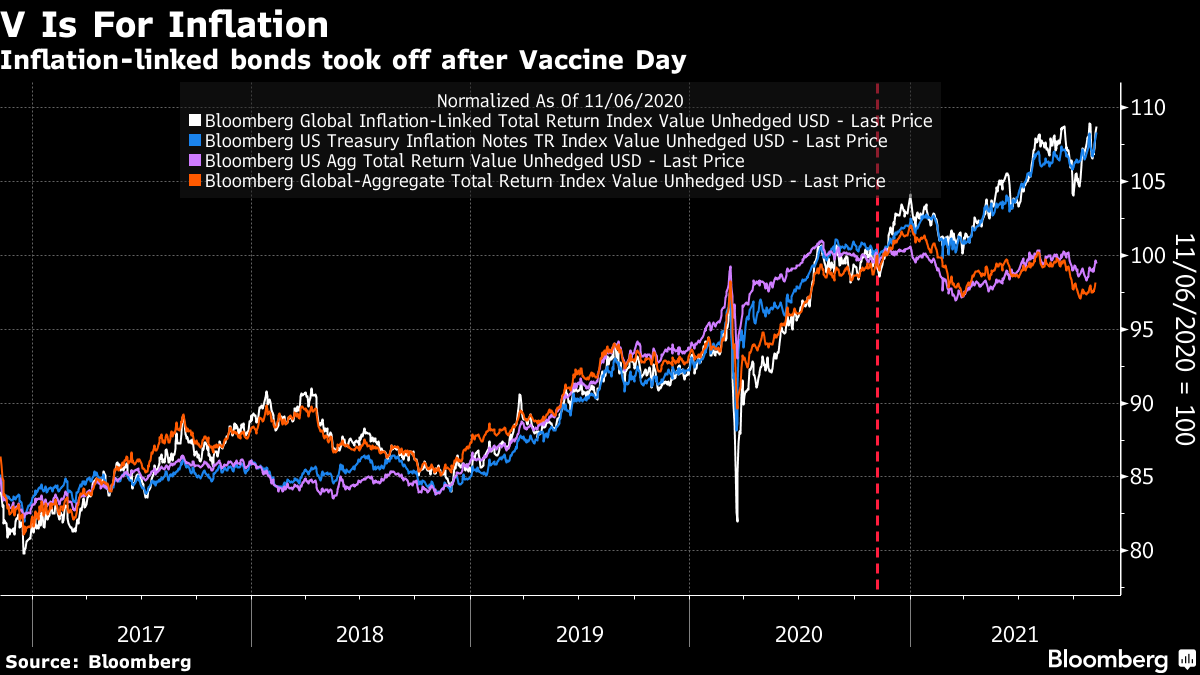
All of this was, in outline, what appeared likely 12 months ago. The extraordinary ascendancy of cryptocurrencies and meme stocks wasn’t so easy to see coming. The way this trade has endured despite inflation that is at the upper end of what had been feared is also a surprise. But perhaps the strangest development of a year marked by the biggest inflationary surge in decades is the identity of the biggest loser.
The Loser of the Year of the Vaccine: GoldThe last 12 months have seen a steady rise in inflation, yet gold has has taken a drubbing. That is weird, because the precious metal has long been regarded, more or less correctly, as a hedge against inflation and monetary debasement. There’s been a lot of both inflation and money-printing in the last 12 months, and yet gold has declined, with miners of the metal becoming the single worst-performing sector in the S&P 500.
We would have found this even harder to predict if we had been told a year ago that real yields would stay solidly and historically negative. Gold has no yield and historically has a strong inverse relationship with real yields. The less bonds pay after inflation, the less unappealing gold will appear. But real yields have remained bafflingly low and that hasn’t helped:
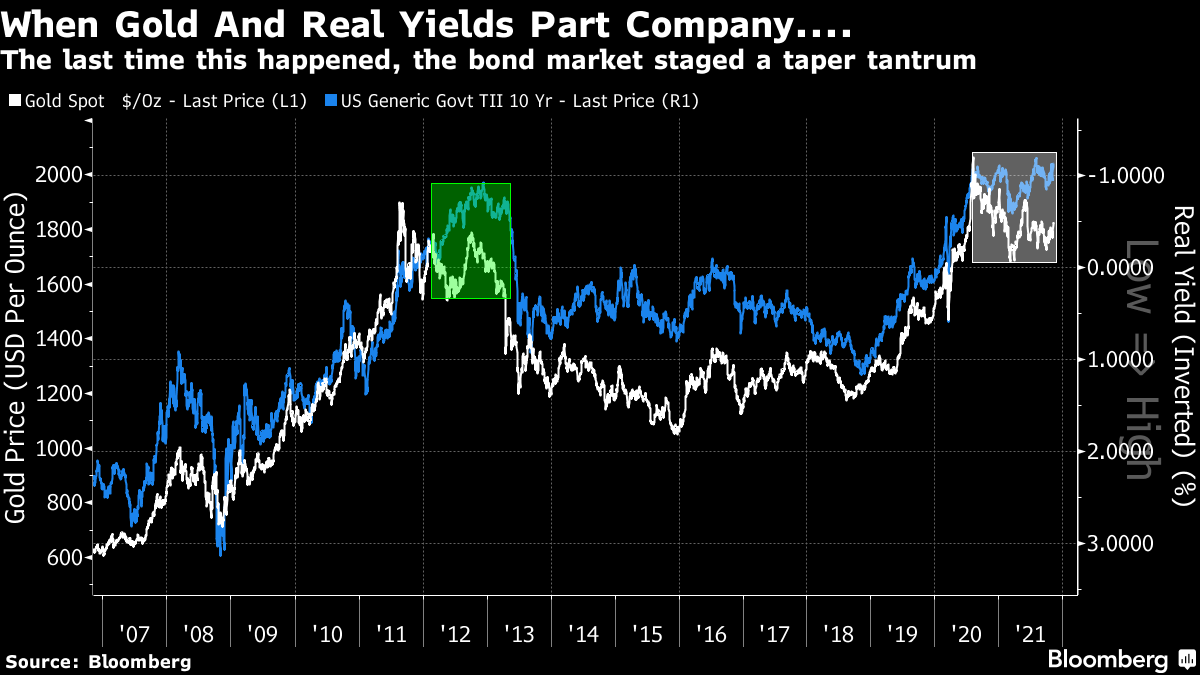
As the chart indicates, there is only one other period since the crisis that looks anything much like this. Unfortunately, that was in 2012 and early 2013, when real yields stayed low during the Federal Reserve’s “QE Infinity” and gold began to fall. It turned out on that occasion that the price was telling us something. The spring of 2013 saw first a dramatic fall for gold and then the “taper tantrum” as bond yields shot upward in response to a hawkish Fed.
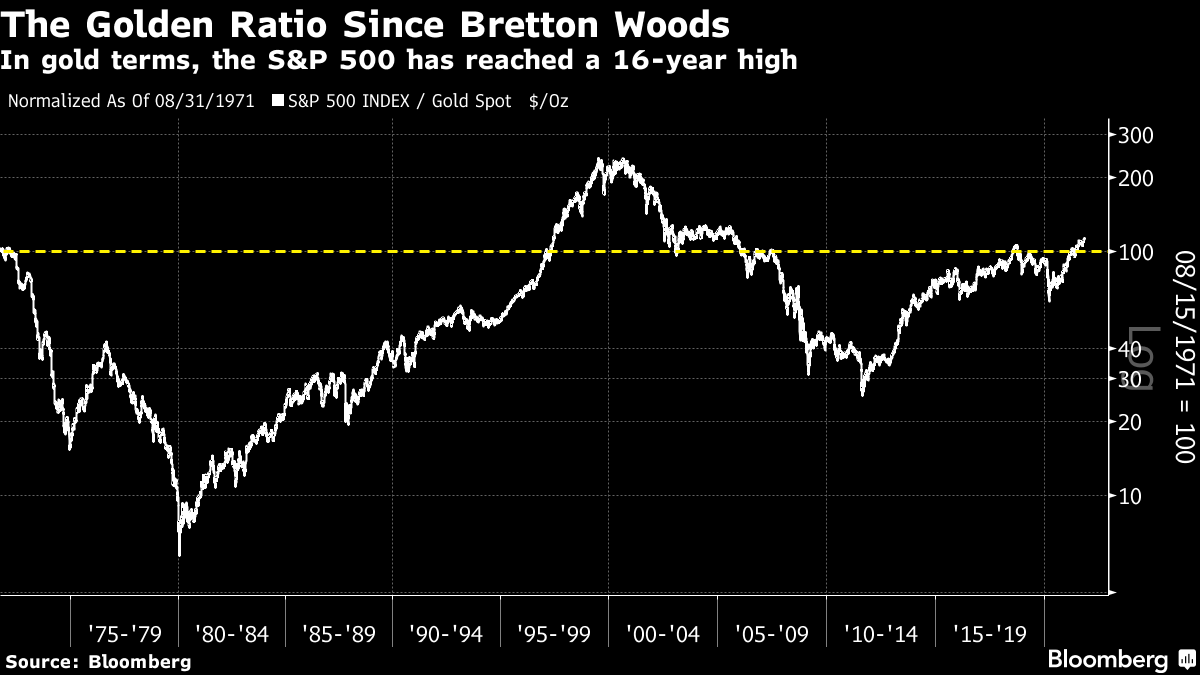
Another indicator looks surprising. The ratio of stocks to gold, the effective price of the S&P 500 in ounces rather than dollars, has stayed surprisingly constant since Richard Nixon removed the U.S. from the last vestiges of the gold standard in 1971. The S&P has been worth more in gold terms than it was in 1971 only for a few years at the top of the 1990s bull market. Despite all the worries about debasement, that golden ratio is now stronger than it was in 1971, and at a 16-year high:
It’s possible that gold’s admirers have deserted it for cryptocurrencies, of course. There are various explanations out there. But the interpretation that it’s telling us to beware a possible tantrum in the bond market and correction in stocks seems fair.
Indicating Inflation
Bloomberg opinion
A day ahead of the U.S. CPI release for October, we can share the latest update of the inflation indicators. You can find them here. Be warned, however, that the indicators are deliberately set up to be a long-term measure, and look barely changed from the last version a week ago, for all the Sturm and Drang in the rates market.
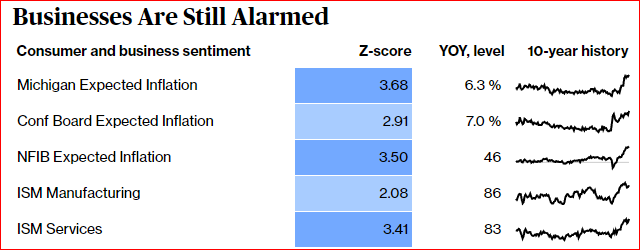
One change is a little unsettling. Last week saw a rise in the “prices paid” survey for both manufacturing and services, as conducted by the Institute of Supply Management. The proportion of companies complaining that prices were rising appeared to have peaked and started a decline, but in both cases they are rising again. The services number is now 3.4 standard deviations above the norm for the last decade. As should be clear, all the indicators of business and consumer sentiment we included are still unambiguously signaling elevated inflation:
The rest of the picture is much less clear, with commodity prices easing, and the bond market positioning for higher inflation in late October. That was before last week’s round of central bank meetings, which saw a more or less united attempt to talk the market down from expectations of great hawkishness. That in turn led to some great market ructions, which tended to show that the moves in October owed at least as much to traders being caught out with poor positioning as they did to changes in inflation expectations.
However, we can also already see that what happened last week in the markets can also be overstated. Look at the expectations for the fed funds rate generated in the futures market, and and you can see that the market has shaded down its forecast for rate hikes since the peak of perceived hawkishness in the last week of October. But two rate hikes remain fully priced in, and expectations are still far higher than they were at the beginning of October. Jerome Powell (and the other central banks) didn’t extinguish the strong sentiment that took root last month that the Fed would have to be more hawkish than it wanted to be, in the face of rising inflation:
Rate Hike Expectations Only Staged A Slight RetreatFed funds futures now imply two 2022 rate hikes - October's shift is intact
Bloomberg World Interest Rate Probabilities function

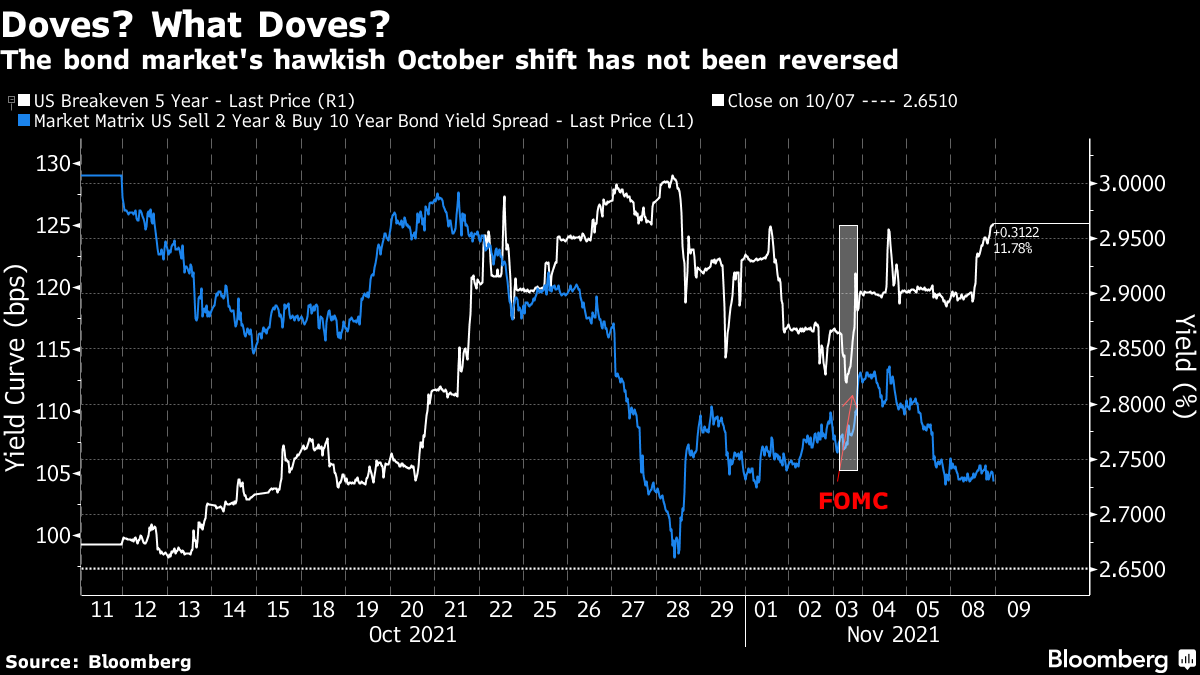
Similarly, a look at the yield curve (the spread between two- and 10-year Treasury yields) and at 5-year inflation breakevens (the implicit inflation forecast for the next five years) shows that at the time of writing, most of the big changes of October are intact. There has still been a significant rise in inflation expectations, and a significant flattening of the curve, which implies a belief that the Fed will have to hike rates in the near future, and choke off growth thereafter:
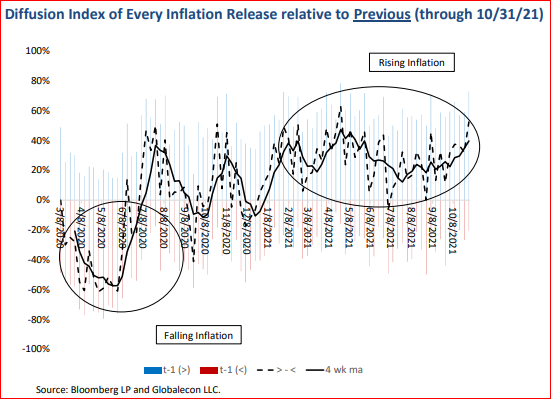
Meanwhile, rising inflation is the norm across the world. This measure from the Center for Financial Stability, based on inflation data from 49 countries, shows that the trend of the last few months has been for widespread rising. Also, note that the period when this was affected by low base effects from the shutdown period in 2020 is now over:
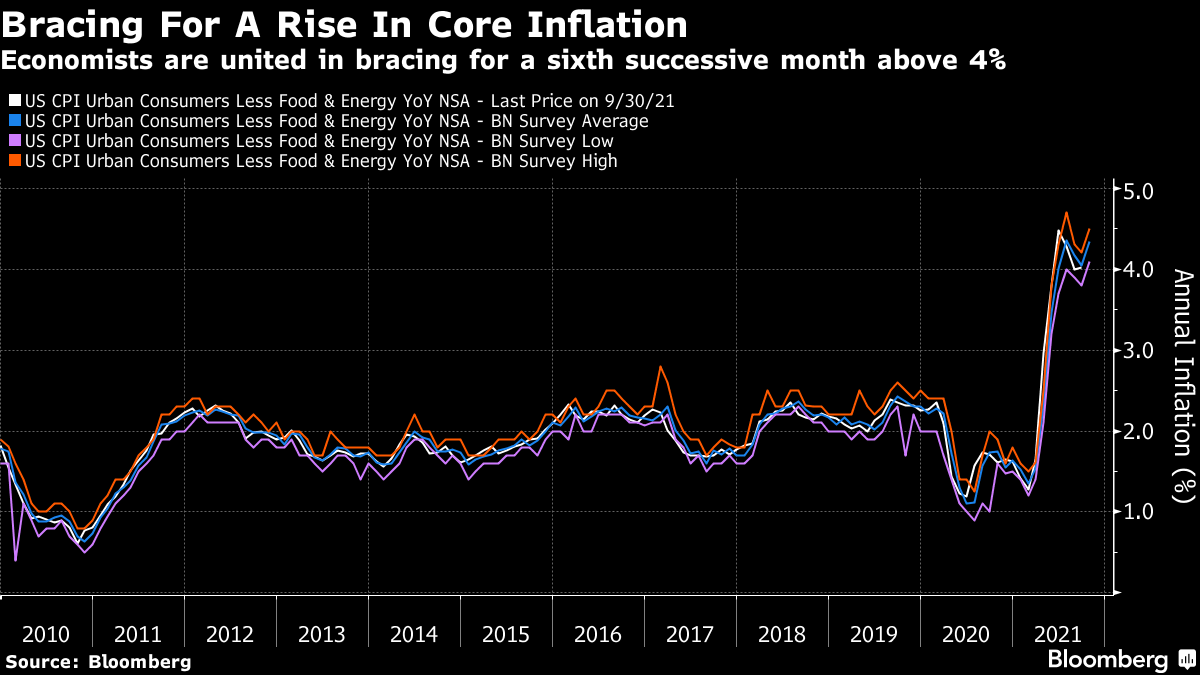
All that remains now is to await Wednesday’s inflation number from the U.S., when the debate will start all over again. Looking at Bloomberg estimates for core inflation (excluding food and fuel), we can see that forecasters are united in bracing for at least 4% for the sixth successive month, well above the the Fed target of 2%, plus or minus a percentage point. Estimates are dispersed, but if they come in at the top or the bottom of the range, it will offer an excuse for yet more frenetic trading on bond markets:
Survival TipsA reading tip for today, and one that can last you through the long, cold winter holiday season. If you haven’t done so already, commit to reading The Power Broker by Robert Caro, about the amazing career of New York’s master-builder Robert Moses. Although never elected to anything, Moses was the most powerful man in the state for many decades and single-handedly changed the way the entire city was planned. To this day, it’s hard to make any trip within the city, or out of it, without coming across Moses’ legacy. Almost 50 years after the book was published, it still has timeless lessons in power, how it is gained, and how it is maintained.
Like most journalists, I am a huge fan of Caro, now in his late 80s and still not finished with the final volume of his massive biography of Lyndon Johnson. After a brief grounding as a newspaper reporter, he has effectively spent his entire life telling the stories of two men, and revealing much about life in the process. The Power Broker runs to 1,344 pages, but it’s still far shorter than the combined four volumes on Johnson to date.
I’m prompted to suggest this because Pete Buttigieg, U.S. transport secretary, mentioned one of the more famous episodes from the book in a press conference, without citing it, and was immediately subjected to ridicule. He had slipped into the assumption that everyone had read The Power Broker and knew what he was talking about. He said: “If an underpass was constructed such that a bus carrying mostly Black and Puerto Rican kids to a beach... in New York was designed too low for it to pass by, that obviously reflects racism that went into those design choices."
Many assumed this was a woke fantasy, and Buttigieg was deluged with sarcasm on Twitter. But it’s a well-documented truth. Moses built Jones Beach, an extraordinary new park on a sand spit off Long Island, and a system of roads to make it easy to drive straight there from the city. But he constructed a series of overpasses that were deliberately too low to allow buses to pass. This was because the great majority of minorities were reliant on public transport. As Caro documented, this was a deliberate move to keep the beautiful new beach for white people in cars. Infrastructure planning really can be racist. And such loathsome decisions, in the New York of the 1930s, helped keep Moses in power.
If you’re not convinced, read this Bloomberg CityLab piece published four years ago, in which our intrepid correspondent checked out clearances of overpasses on parkways built before the one to Jones Beach — and discovered that the Moses-built ones were, indeed, significantly lower. Now, when Buttigieg reminded us of the story, people didn’t believe him (shades of Monty Python’s Four Yorkshiremen). So it’s time for everyone to catch up on the masterwork on the Master Builder.
This column does not necessarily reflect the opinion of the editorial board or Bloomberg LP and its owners.
To contact the author of this story:
John Authers at jauthers@bloomberg.net
To contact the editor responsible for this story:
Matthew Brooker at mbrooker1@bloomberg.net |


