| | | Here, i fixed it for you re what a trillion $ ought to look like, undervalued …
visualcapitalist.com
12 Stunning Visualizations of Gold Shows Its Rarity
September 22, 2015
Published
7 years agoon
For the companies exploring for gold, a deposit that has more than one gram of gold for every tonne of earth is an exciting prospect. In fact, in our 2013 report summarizing the world’s gold deposits, we found that the average grade of gold deposits in the world is around that amount: about 1.01 g/t.
Think about that for a moment. One gram (0.035 oz) is equal to the mass of a small paper clip. This small amount of gold is usually not even in one place – it is dispersed through a tonne of rock and dirt in smaller amounts, most of the time invisible to the naked eye. For some companies that have the stars align with easy metallurgy, a deposit near surface, and open pit potential, this gram per tonne deposit may even somehow be economic.
It’s hard to believe that such a small amount of gold could be worth so much, and that is why great visualizations can help us understand the rarity of this yellow metal. Luckily, the folks at Demonocracy.info have done the heavy lifting for us, putting together a series of 3D visualizations of gold bullion bars showcasing the world’s gold that has been mined thus far. Note: these visualizations are a couple of years old and optimistically have the value of gold pegged at US$2,000 per oz, presumably for the ease of calculations.
For those interested, we have also put together a similar slideshow on the topic, showing how much gold, silver, copper, and other metals are mined each year.
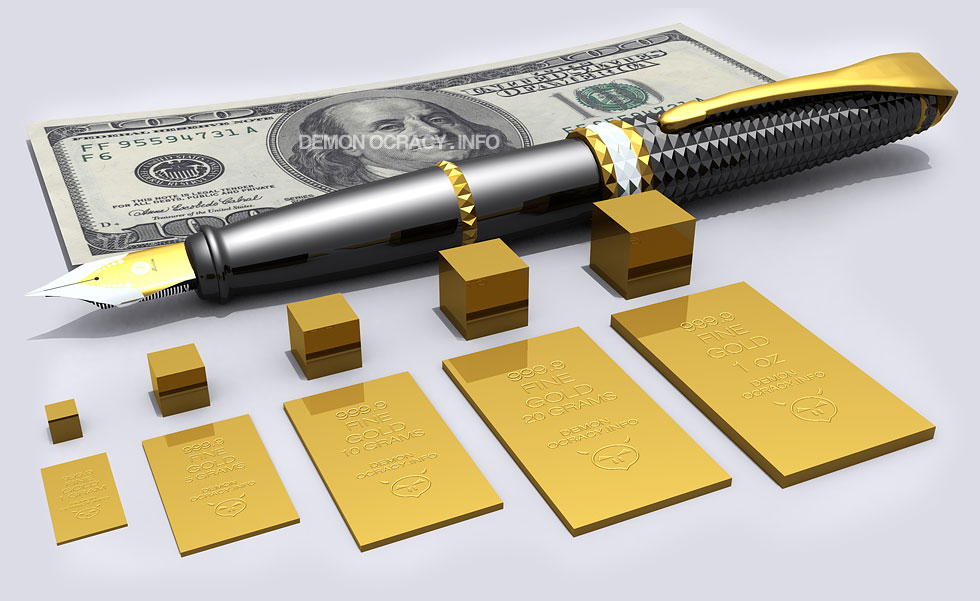 Smaller denominations of gold plates: 1 gram, 5 grams, 10 grams, 20 grams, and 1 troy oz of gold. Smaller denominations of gold plates: 1 gram, 5 grams, 10 grams, 20 grams, and 1 troy oz of gold.
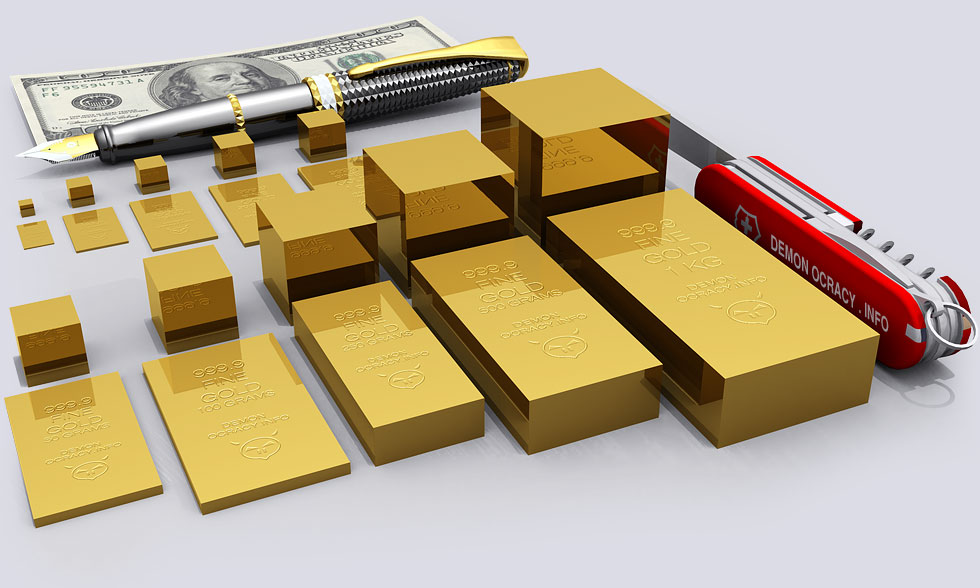 Larger denominations of gold plates: 50 grams, 100 grams, 250 grams, 500 grams, and 1 kg of gold. Larger denominations of gold plates: 50 grams, 100 grams, 250 grams, 500 grams, and 1 kg of gold.
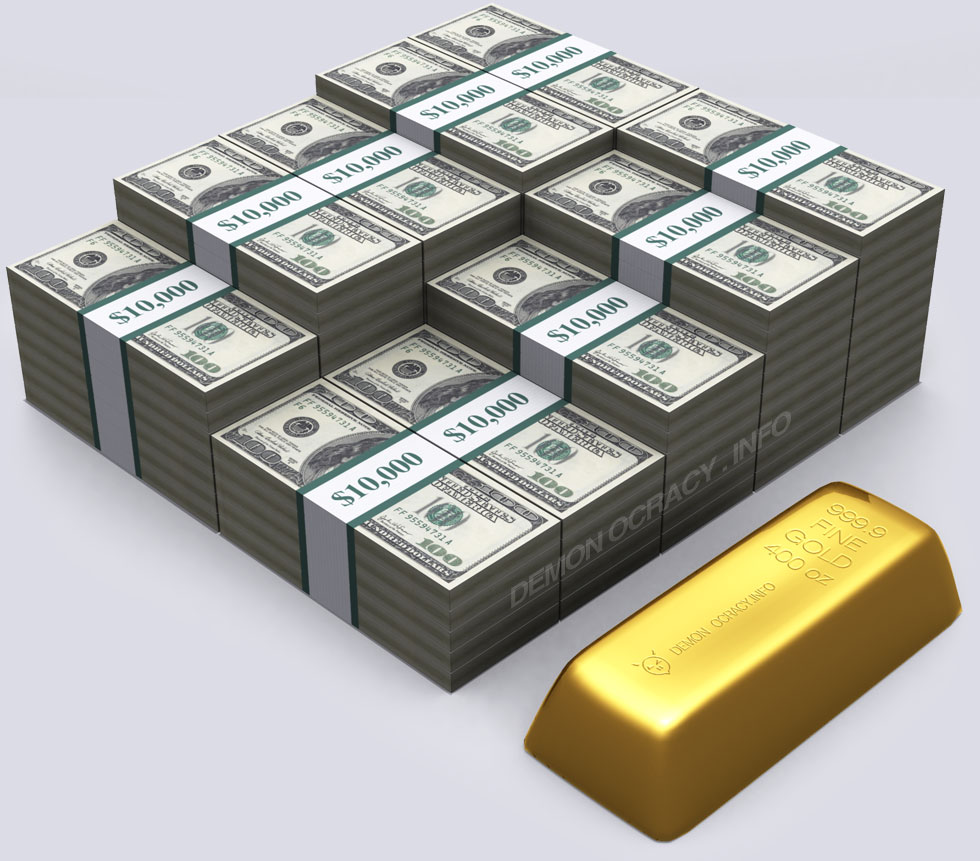 This 400 oz gold bar, at $2,000 per oz gold, is worth the $800,000 cash beside it. The gold bar is extremely heavy, weighing more than three full milk jugs. This 400 oz gold bar, at $2,000 per oz gold, is worth the $800,000 cash beside it. The gold bar is extremely heavy, weighing more than three full milk jugs.
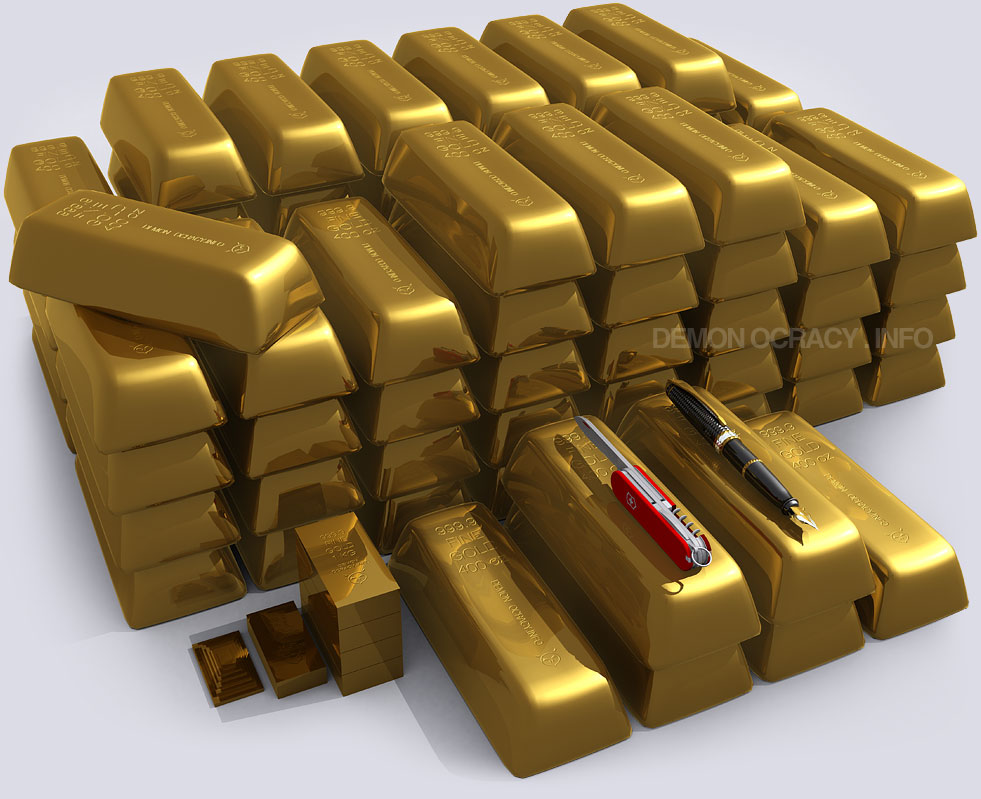 Here’s what one tonne of gold looks like. At $2,000 per oz, it’s worth $64.3 million. Here’s what one tonne of gold looks like. At $2,000 per oz, it’s worth $64.3 million.
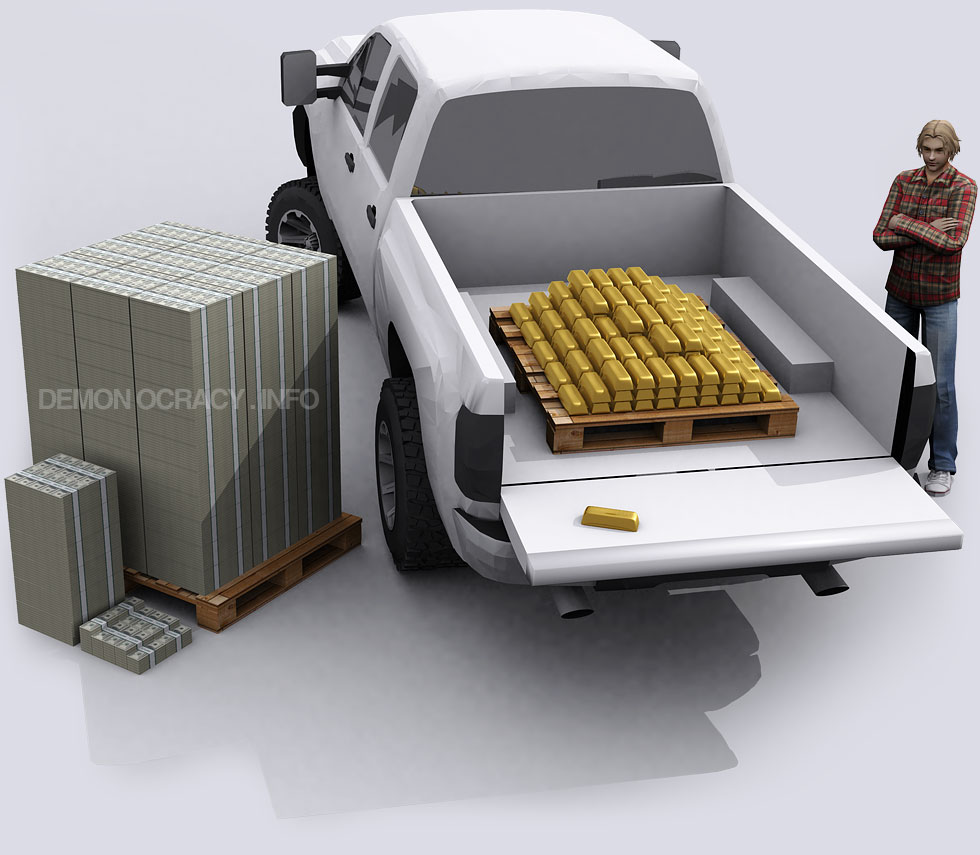 Gold is so heavy that the suspension of an average truck would break if it held anymore than pictured above. Even if the truck’s suspension broke, the load of gold in the back could buy 2,660 brand new trucks at an MSRP of $40,000 per truck. Gold is so heavy that the suspension of an average truck would break if it held anymore than pictured above. Even if the truck’s suspension broke, the load of gold in the back could buy 2,660 brand new trucks at an MSRP of $40,000 per truck.
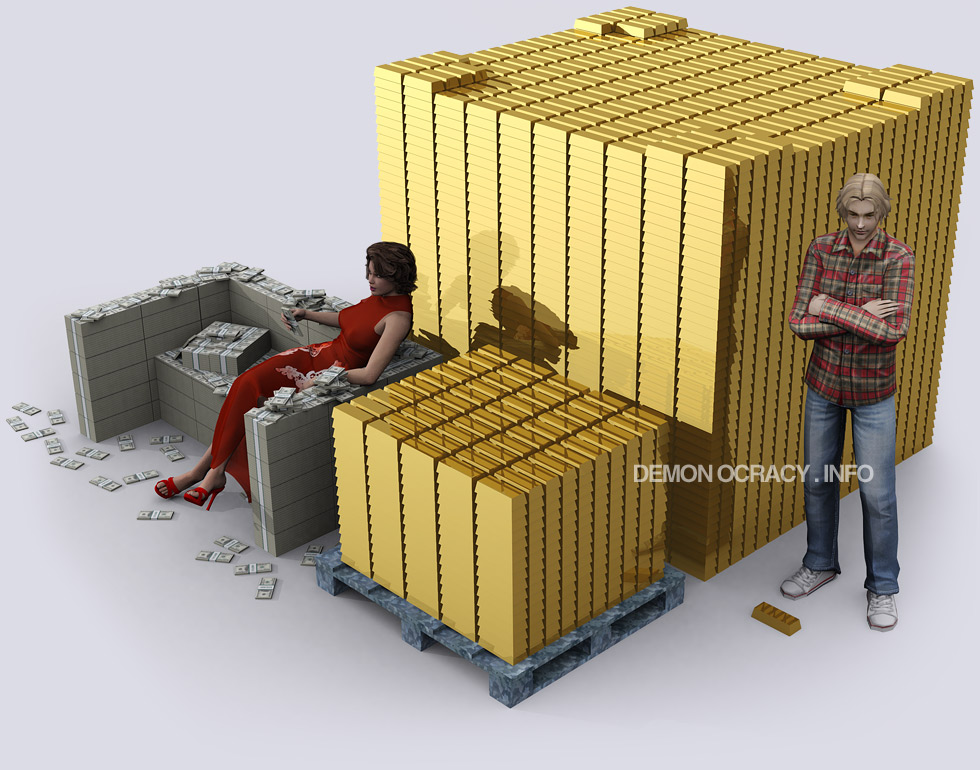 Here’s 10 tonnes of gold compared to 100 tonnes of the yellow metal. Here’s 10 tonnes of gold compared to 100 tonnes of the yellow metal.
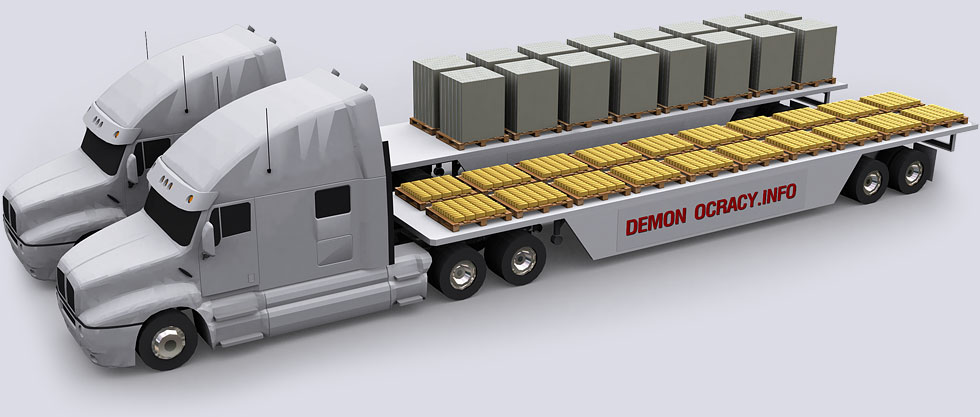 This semi-truck is carrying the maximum load it can legally carry, which is about about 25 tonnes. Here there are 24.88 tonnes of gold, worth $1.6 billion. This semi-truck is carrying the maximum load it can legally carry, which is about about 25 tonnes. Here there are 24.88 tonnes of gold, worth $1.6 billion.
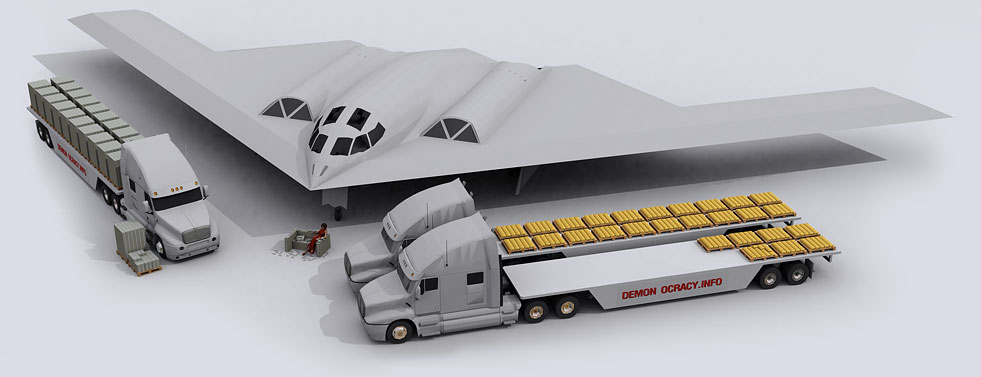 The Northrop Grumman B2 Spirit Bomber program cost $44.75 Billion for a total of 21 units built, which averages to $2,130,952,380 per unit. Shown here is the amount of gold it costs to buy one unit. The Northrop Grumman B2 Spirit Bomber program cost $44.75 Billion for a total of 21 units built, which averages to $2,130,952,380 per unit. Shown here is the amount of gold it costs to buy one unit.
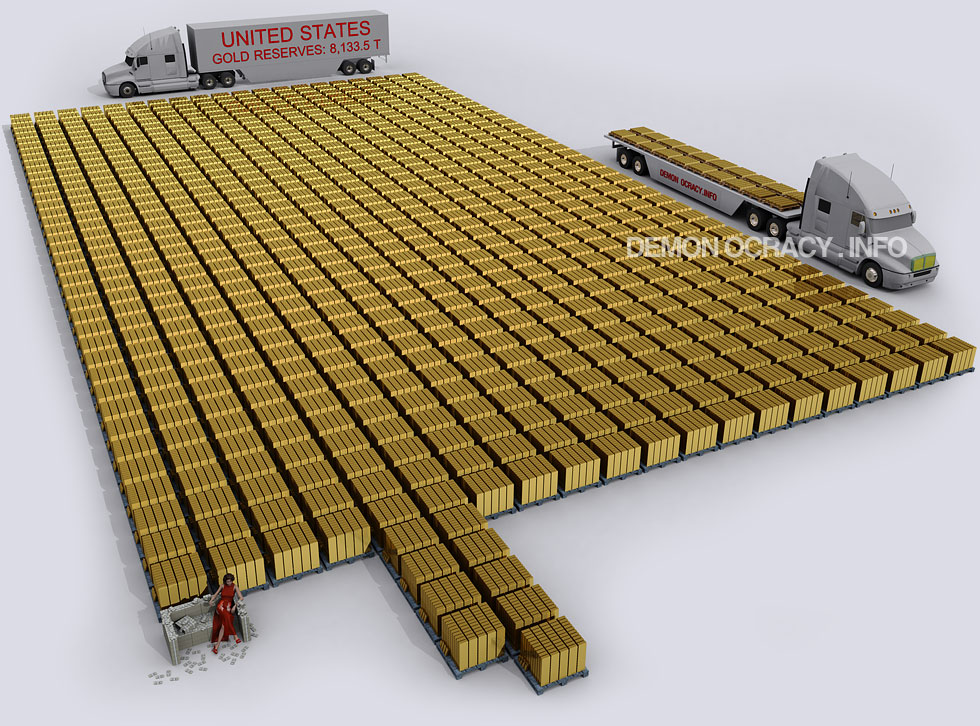 Here’s the entire gold reserves of the United States government, which is 8,133.5 tonnes. Here’s the entire gold reserves of the United States government, which is 8,133.5 tonnes.
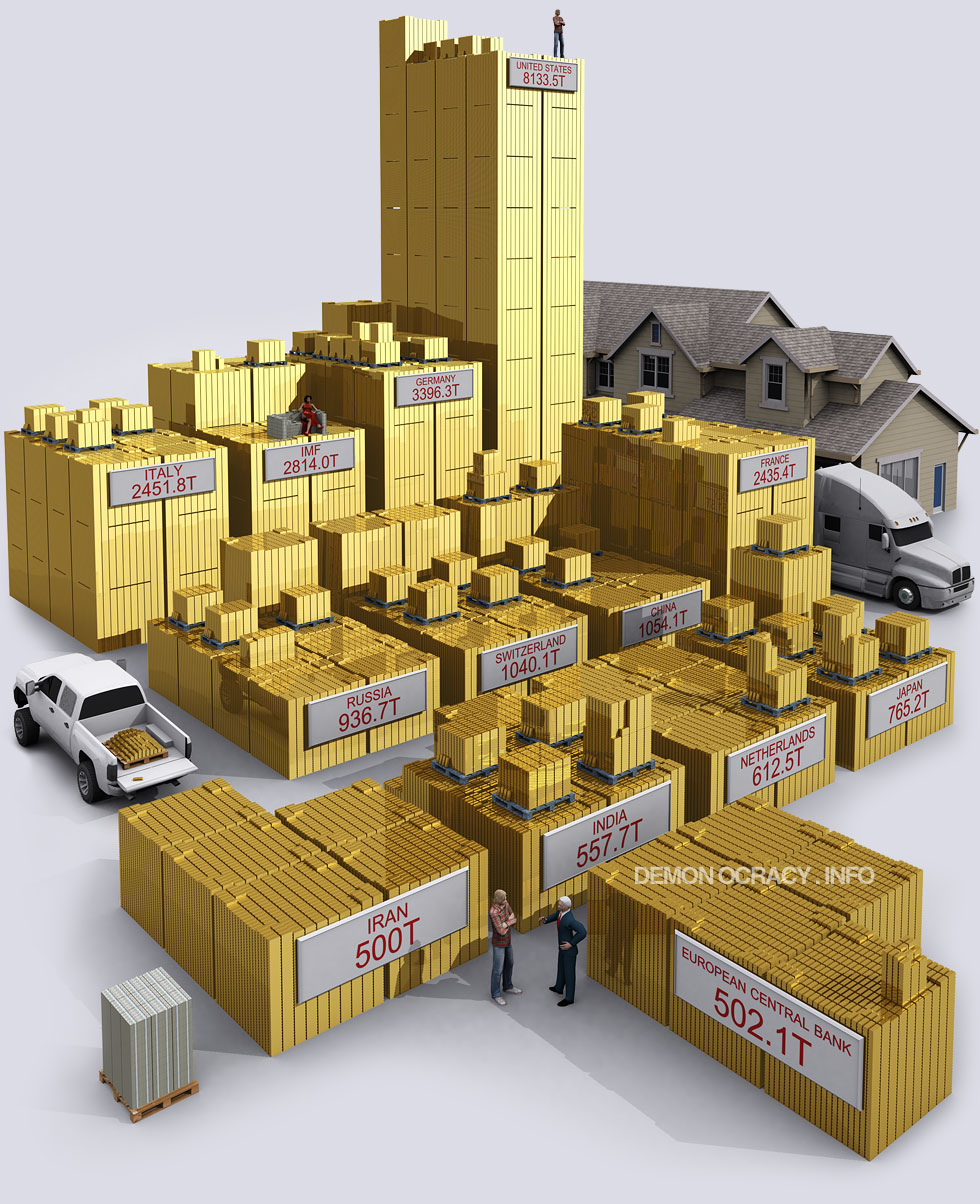 Here’s the world’s gold reserves by government circa 2012. This is slightly outdated, with China and Russia both having significant increases since then. Here’s the world’s gold reserves by government circa 2012. This is slightly outdated, with China and Russia both having significant increases since then.
 All gold mined in history, stacked in 400 oz bars. The 166,500 tonnes here is actually divided into four levels: the bottom level is jewelry (50.5% of all gold), the 2nd level is private investment (18.7%), the third level is world governments (17.4%), and the highest level is other uses for gold such as industry (13.4%). All gold mined in history, stacked in 400 oz bars. The 166,500 tonnes here is actually divided into four levels: the bottom level is jewelry (50.5% of all gold), the 2nd level is private investment (18.7%), the third level is world governments (17.4%), and the highest level is other uses for gold such as industry (13.4%).
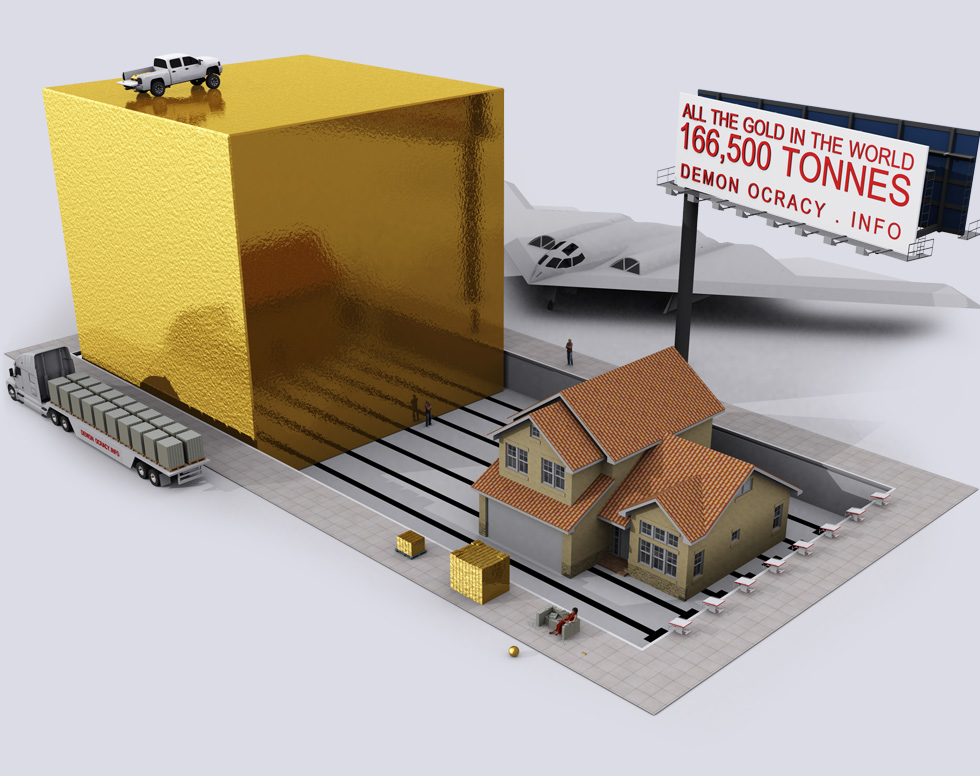 Lastly, we finish off with an image of all of the world’s mined gold in one cube with dimensions of 20.5m. If it was all melted, it would fit within the confines of an Olympic Swimming Pool. Lastly, we finish off with an image of all of the world’s mined gold in one cube with dimensions of 20.5m. If it was all melted, it would fit within the confines of an Olympic Swimming Pool.
Want to learn everything you need to know about gold in about 20 minutes? Our five-part Gold Series covers everything from its rich history, supply and geology, demand drivers, investment properties, and market trends.

MiningThe 50 Minerals Critical to U.S. SecurityThis graphic lists all minerals that are deemed critical to both the economic and national security of the United States.
Published
1 month agoon
March 1, 2022
The 50 Minerals Critical to U.S. SecurityThis was originally posted on Elements. Sign up to the free mailing list to get beautiful visualizations on natural resource megatrends in your email every week.
The U.S. aims to cut its greenhouse gas emissions in half by 2030 as part of its commitment to tackling climate change, but might be lacking the critical minerals needed to achieve its goals.
The American green economy will rely on renewable sources of energy like wind and solar, along with the electrification of transportation. However, local production of the raw materials necessary to produce these technologies, including solar panels, wind turbines, and electric vehicles, is lacking. Understandably, this has raised concerns in Washington.
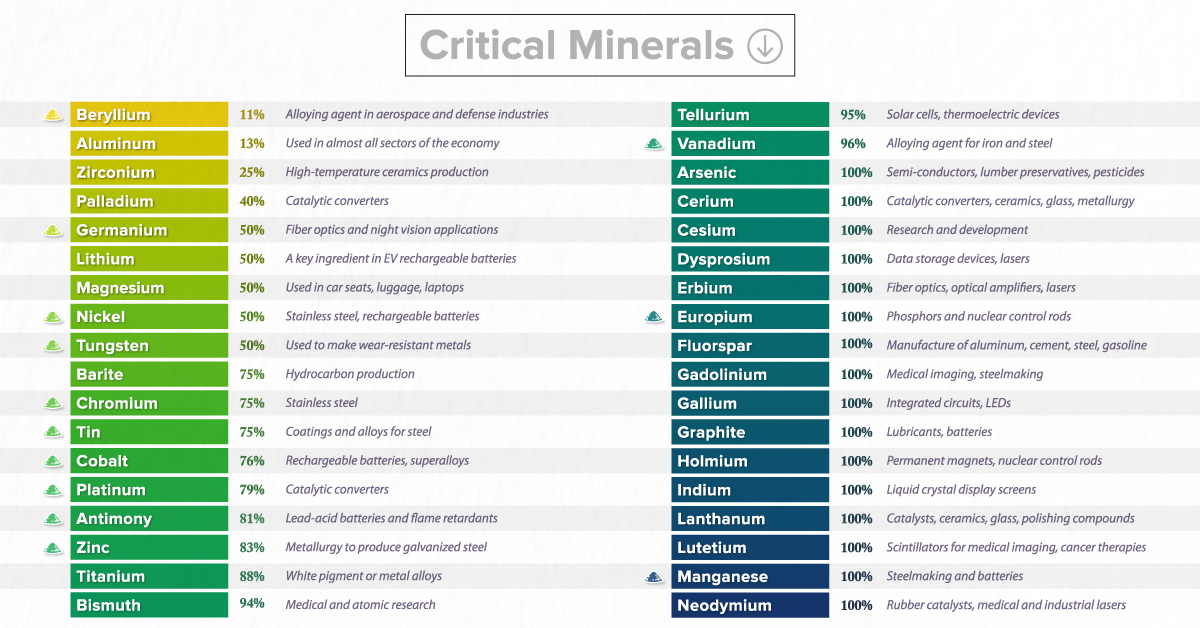
In this graphic, based on data from the U.S. Geological Survey, we list all of the minerals that the government has deemed critical to both the economic and national security of the United States.
What are Critical Minerals?A critical mineral is defined as a non-fuel material considered vital for the economic well-being of the world’s major and emerging economies, whose supply may be at risk. This can be due to geological scarcity, geopolitical issues, trade policy, or other factors.
In 2018, the U.S. Department of the Interior released a list of 35 critical minerals. The new list, released in February 2022, contains 15 more commodities.
Much of the increase in the new list is the result of splitting the rare earth elements and platinum group elements into individual entries rather than including them as “mineral groups.” In addition, the 2022 list of critical minerals adds nickel and zinc to the list while removing helium, potash, rhenium, and strontium.
The challenge for the U.S. is that the local production of these raw materials is extremely limited.
For instance, in 2021 there was only one operating nickel mine in the country, the Eagle mine in Michigan. The facility ships its concentrates abroad for refining and is scheduled to close in 2025. Likewise, the country only hosted one lithium mine, the Silver Peak Mine in Nevada.
At the same time, most of the country’s supply of critical minerals depends on countries that have historically competed with America.
China’s Dominance in MineralsPerhaps unsurprisingly, China is the single largest supply source of mineral commodities for the United States.
Cesium, a critical metal used in a wide range of manufacturing, is one example. There are only three pegmatite mines in the world that can produce cesium, and all were controlled by Chinese companies in 2021.
Furthermore, China refines nearly 90% of the world’s rare earths. Despite the name, these elements are abundant on the Earth’s crust and make up the majority of listed critical minerals. They are essential for a variety of products like EVs, advanced ceramics, computers, smartphones, wind turbines, monitors, and fiber optics.
After China, the next largest source of mineral commodities to the United States has been Canada, which provided the United States with 16 different elements in 2021.
The Rising Demand for Critical MineralsAs the world’s clean energy transitions gather pace, demand for critical minerals is expected to grow quickly.
According to the International Energy Association, the rise of low-carbon power generation is projected to triple mineral demand from this sector by 2040.
The shift to a sustainable economy is important, and consequently, securing the critical minerals necessary for it is just as vital.
Continue Reading
EnergyVisualizing China’s Dominance in Clean Energy MetalsDespite being the world’s biggest carbon emitter, China is also a key producer of most of the critical minerals for the green revolution.
Published
2 months agoon
January 23, 2022
Visualizing China’s Dominance in Clean Energy MetalsThis was originally posted on Elements. Sign up to the free mailing list to get beautiful visualizations on natural resource megatrends in your email every week.
Renewable sources of energy are expected to replace fossil fuels over the coming decades, and this large-scale transition will have a downstream effect on the demand of raw materials. More green energy means more wind turbines, solar panels, and batteries needed, and more clean energy metals necessary to build these technologies.
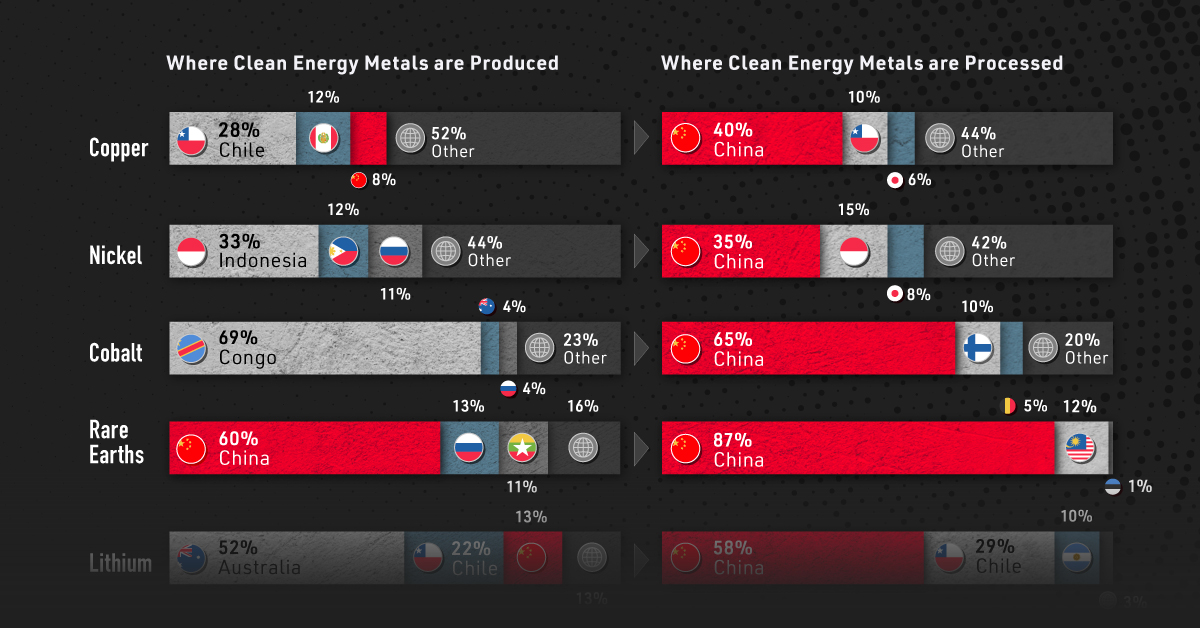
This visualization, based on data from the International Energy Agency ( IEA), illustrates where the extraction and processing of key metals for the green revolution take place.
It shows that despite being the world’s biggest carbon polluter, China is also the largest producer of most of the world’s critical minerals for the green revolution.
Where Clean Energy Metals are ProducedChina produces 60% of all rare earth elements used as components in high technology devices, including smartphones and computers.
The country also has a 13% share of the lithium production market, which is still dominated by Australia (52%) and Chile (22%). The highly reactive element is key to producing rechargeable batteries for mobile phones, laptops, and electric vehicles.
China's ShareExtractionProcessing | Copper | 8% | 40% | | Nickel | 5% | 35% | | Cobalt | 1.5% | 65% | | Rare Earths | 60% | 87% | | Lithium | 13% | 58% |
But even more than extraction, China is the dominant economy when it comes to processing operations. The country’s share of refining is around 35% for nickel, 58% for lithium, 65% for cobalt, and 87% for rare earth elements.
Despite being the largest economy in the world, the U.S. does not appear among the largest producers of any of the metals listed. To shorten the gap, the Biden administration recently launched an executive order to review the American strategy for critical and strategic materials.
It’s also worth noting that Russia also does not appear among the top producers when it comes to clean energy metals, despite being one of the world’s leading producers of minerals like copper, iron, and palladium.
Low Regulation in the Clean Metal Supply ChainWhile China leads all countries in terms of cobalt processing, the metal itself is primarily extracted in the Democratic Republic of Congo (DRC). Still, Chinese interests own 15 of the 17 industrial cobalt operations in the DRC, according to a data analysis by The New York Times and Benchmark Mineral Intelligence.
Unfortunately, the DRC’s cobalt production has been criticized due to reports of corruption and lack of regulation.
Part of the Congolese cobalt comes from artisanal mines with low regulation. Of the 255,000 Congolese artisanal miners, an estimated 40,000 are children, some as young as six years old.
The Rise of Clean Energy MetalsThe necessary shift from fossil fuels to renewable energy opens up interesting questions about how geopolitics, and these supply chains, will be affected.
In the race to secure raw materials needed for the green revolution, new world powers could emerge as demand for clean energy metals grows.
For now, China has the lead.
Continue Reading
Sent from my iPad |
|


