Re <<Fed is lying … not looking out for you>> etc etc
McHugh telling it straight, between the eyes, and trying to be accurate>>
Looking promising or in-good depending on POV
Am wondering what gold shares shall do as gold nears 3,000 per troy oz.


Today's Market Comments:
The stock market took the scenic route to Flat Friday, May 20th, first reaching new depths, then returning to the starting gate. After another strong selloff through mid-day Friday, stocks saw strong profit taking by Bears, and the market found a bid, rallying into the close.
This is now a full-fledged official stock market crash in 2022. Multiple Hindenburg Omens that have been occurring, throughout the year, did a nice job warning this was coming, and was going to continue. The Small cap Russell 2000 has crashed 30.8% from its November 8th, 2021 high to its May 2022 Low. The Dow Transportation average has crashed 27.8% from their November 2021 highs to their May 2022 low. The S&P 500 has now seen a 20% crash from their January highs through their May 20th, 2022 low. Techs have also crashed, the NASDAQ 100 diving 31.4% since their November 22nd, 2021 all-time high.
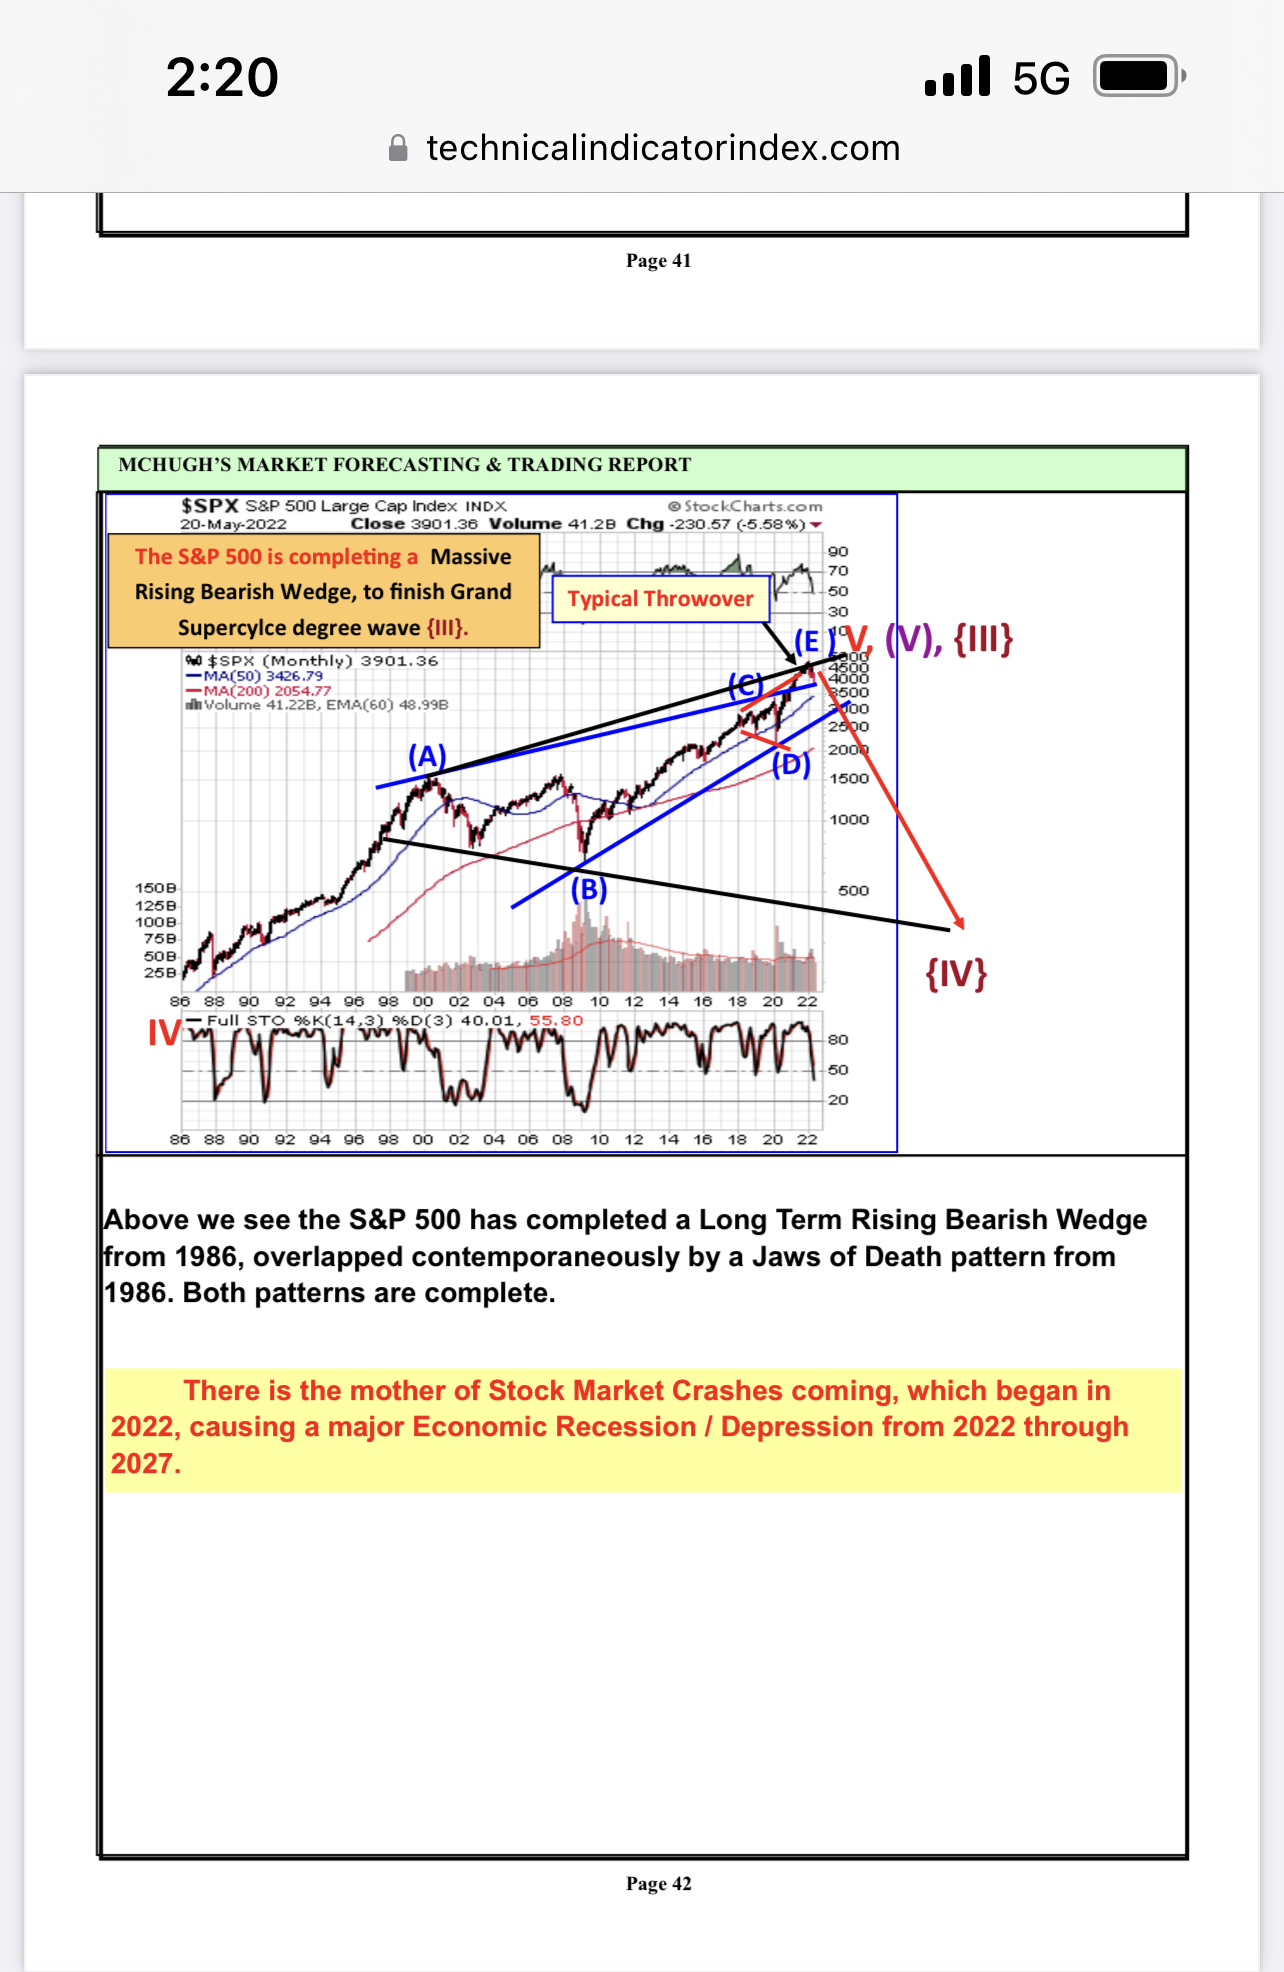
And the crash is not over. This is a Grand Supercycle degree Bear Market, correcting a three century Grand Supercycle degree Bull market. It will last many years and will reach lows few are anticipating. There will be corrective rallies along the way to bring temporary relief, however, the long-term trend is headed down sharply. If you study the long-term charts on pages 33 for the Industrials, page 42 for the S&P 500, and page 55 for Trannies, they give the overall perspective of where this Bear market is taking stocks, how deep, and a feel for how long it could last. Not great news for investors used to a stock market that perpetually rises, it seems, but is what the charts, their historically reliable predictive patterns, are warning.
This new paradigm investors find themselves in requires making major adjustments to their thinking, and their investing strategies. It is going to be tough sledding. There is going to be more pain. However, money can be made as the stock market slides, and as it produces temporary corrective rallies. Market timing trading is one tactic within an overall comprehensive financial strategy. Cash is king in depressions. At some point, inflation will give way to deflation. Shortages will continue as the economic pie shrinks. People are going to have to work more hours, find supplemental sources of income, and build up savings. The stock market has already lost $10.5 trillion since late 2021, half the annual GDP in the U.S.
The Fed is about to strip another $1.0 trillion over the coming year with their Quantitative Tightening strategy, which could cause a reverse money multiplier shrinkage of the money supply. Further, their plan to systematically raise interest rates, will reduce the demand for loans, which will also retard monetary growth from the money multiplier. Further, whenever the economic outlook is for Recession, the Banking Regulators will put pressure on banks to tighten lending standards, especially as delinquencies increase, and force banks to increase their loan loss reserves, which requires a charge to earnings. This will be a powerful disincentive for banks to lend money, could lead to a credit crunch like we saw in the early 1990s, and deepen the Recession. Think the 1930s on steroids. With economic Recessions and Depressions comes war. I covered this correlation in my book, The Coming Economic Ice Age.
Careful budgeting, frugal spending, building up savings, adding additional income streams, will be very important. Keeping the cupboards full will be important. Staying out of debt will provide relief to the budget, and independence from creditor pressures.
There is always hope. We have a Hope button at the left of the home page at www.technicalindicatorindex.com for those who are interested.
We have updated all charts for all markets we cover in this weekend's U.S. Newsletter, available at the home page. We cover the major stock averages, Metals, Mining stocks, Treasuries (including an updated Yield curve), Oil, Currencies and the VIX.
An initial downside price target before a possible breather rally may be identified from Head & Shoulders topping patterns we show for the Industrials, S&P 500, and NASDAQ 100 in charts on pages 36, 45, and 49.
Short-term, the stock market has a couple of alternatives. It is possible that small degree corrective wave {ii} up has completed and a powerful series of wave threes down is starting and will continue next week. The other possibility is that next week will see upside moves to complete a complex 3-3-5 Flat pattern for subwave {ii} up. Next week leads into the Memorial Day Holiday weekend, so that could provide some temporary bullish sentiment short-term. Once complete, wave {iii} down of {3} down will send stocks sharply lower. We update a ton of charts showing this in the U.S. Weekend Newsletter at www.technicalindicatorindex.com
Our intermediate term Secondary Trend Indicator generated a Sell signal November 26th. It fell 1 point Friday (out of a possible 9 points), to negative -10.
There were no changes to our short-term indicators from Friday's price action. The Blue Chip three component key indicator remains on a Sell. The NASDAQ 100 three component key indicator remains Neutral. The small cap Russell 2000's Purchasing Power Indicator remains on a Buy signal.
Our Blue Chip key trend-finder indicators generated a Sell signal May 19th, 2022 and remain there Friday, May 20th, 2022. The Purchasing Power Indicator component triggered a Sell signal Wednesday, May18th. The 14-day Stochastic Indicator generated a Sell on May 19th, 2022, and the 30-Day Stochastic Indicator generated a Sell on May 19th, 2022. When these three indicators agree, it is a short-term (1 week to 3 months' time horizon) key trend-finder directional signal. When these three indicators are in conflict with one another, it is a Neutral (Sideways) key trend-finder indicator signal.
Demand Power was flat at 484 Friday, while Supply Pressure Fell 4 to 591, telling us Friday's Blue Chip closing net move was weak.
Today's Mining Stocks and Precious Metals Market Comments:
Our HUI Key Indicators remain on a Neutral signal from a Sell signal May 19th.
Gold rose 0.90 Friday. Silver fell 0.23, and Mining stocks were flat.
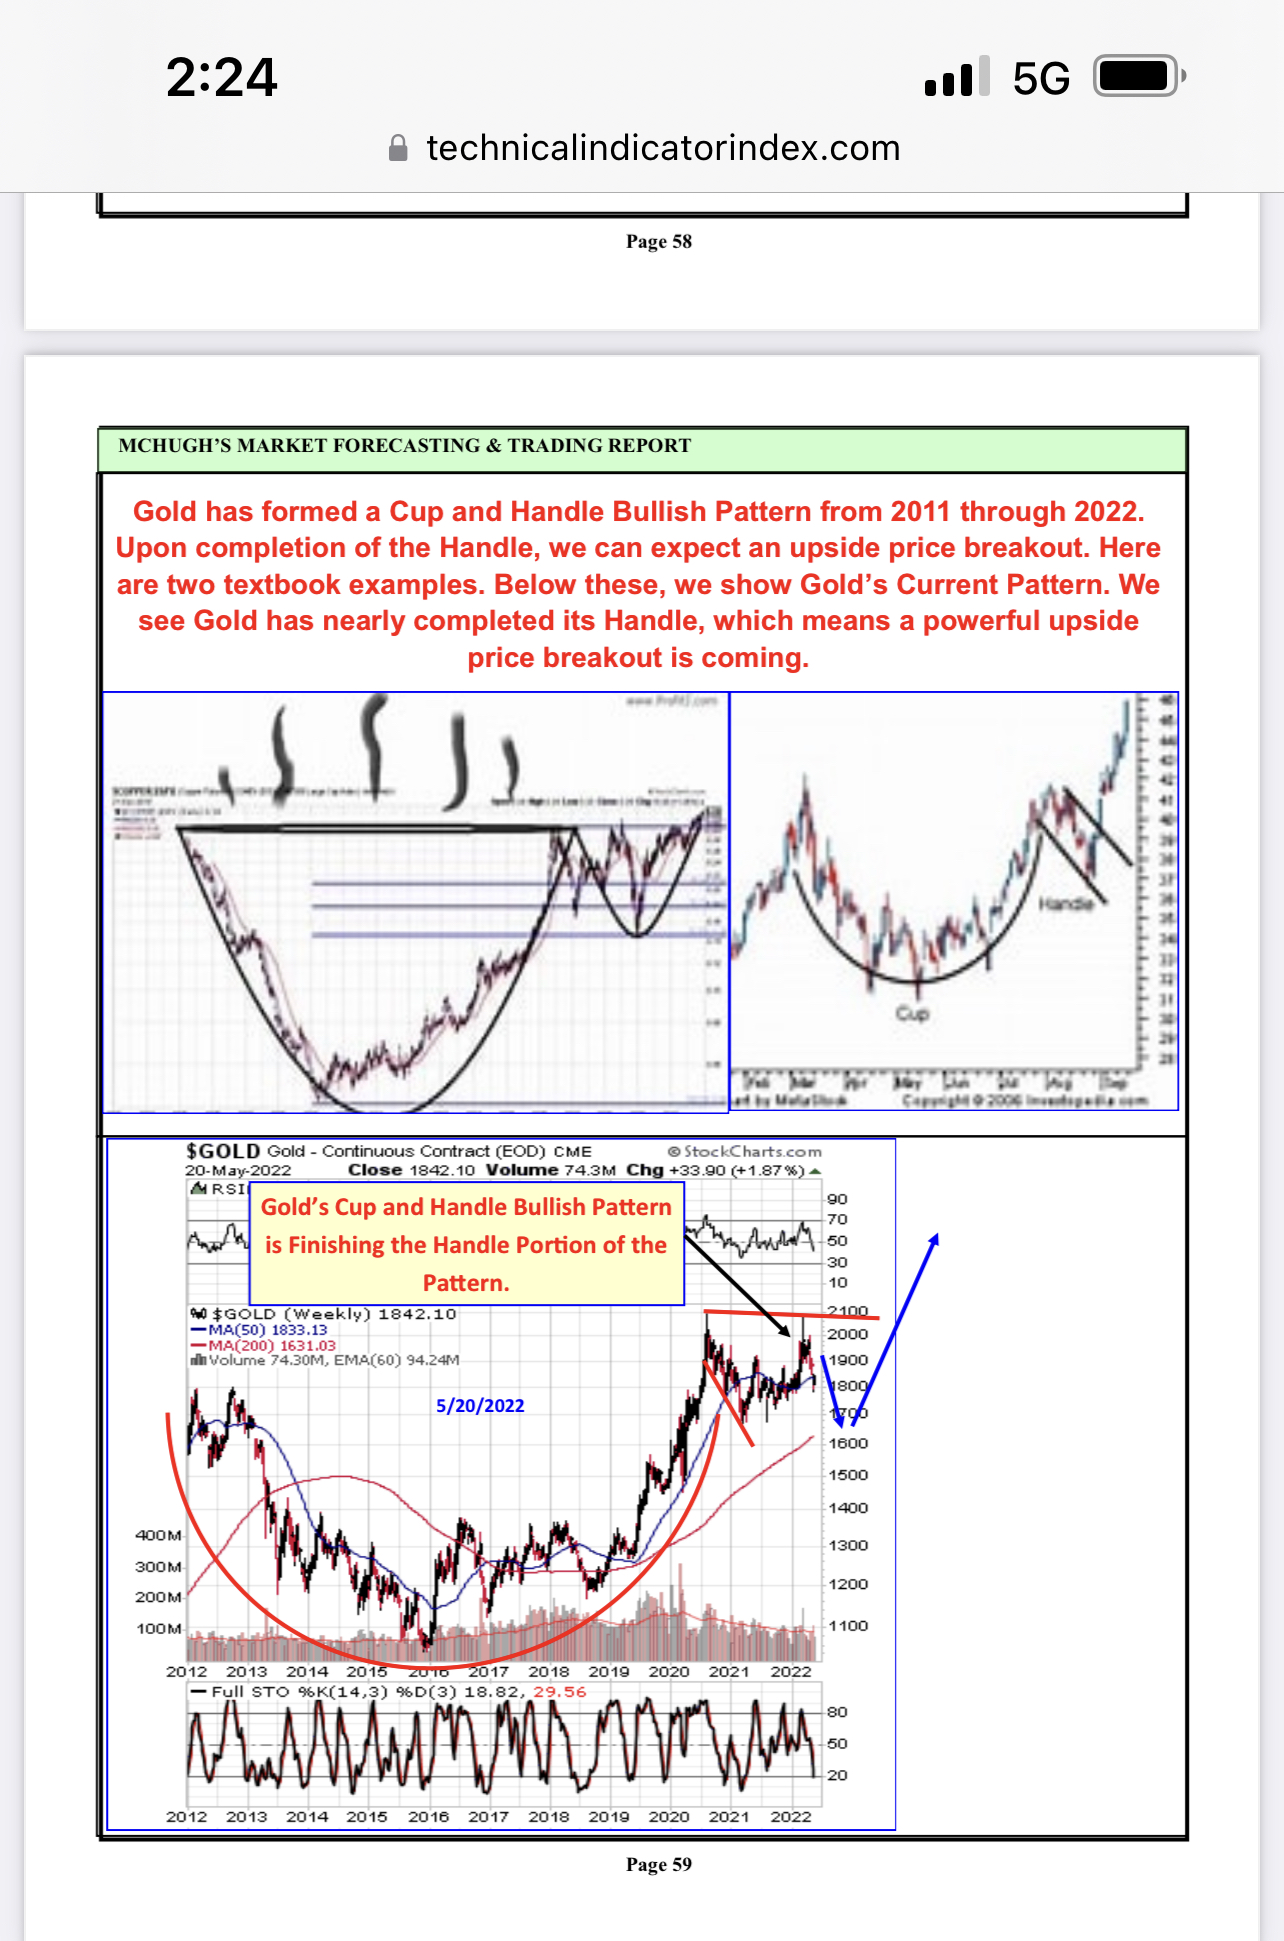
In the charts on pages 57 through 59, we show an adjusted wave mapping for Gold. The Handle for Gold's Cup and Handle pattern has morphed into a declining Primary degree wave (2) 3-3-5 Flat pattern. It is an Intermediate degree wave A-down, B-up, C-down move. Gold is now inside the final wave C-down, which is declining in a five subwave move. Gold finds itself inside the third of five subwaves for C-down. We show a potential downside price target in the chart on page 56. Once this pattern completes, a powerful Primary degree wave (3) rally will follow.
Silver is finishing a wave 4-down corrective decline. It has further downside needed to complete the pattern. We show the chart and a projected downside price target in chart on page 58. Once it bottoms, a strong wave 5 rally will follow.
In the charts on pages 61 and 62, we show the wave mapping charts for Mining stocks. They are dropping inside corrective wave ii-down. We show a projected downside price target in the chart on page 62.
The HUI key trend-finder indicator remain on a Neutral signal from May 19th, 2022, as the HUI 30 Day Stochastic triggered a Sell signal March 5th, and the HUI Purchasing Power Indicator triggered aBuy on May 19th. When these two indicators agree, it is a directional signal, and when at odds with one another, it is a combination neutral signal. The HUI Demand Power / Supply Pressure Indicator triggered a Sell signal April 21st. On Friday, Demand Power fell 1 to 362 while Supply Pressure fell 2 to 407, telling us Friday's move was weak.
DJIA/SPY PPI Flat at negative - 85.19, on a Sell
DJIA 30 Day Stochastic Fast 13.33 Slow 19.33 On a Sell
DJIA 14 Day Stochastic Fast 16.67 Slow 29.44 On a Sell
DJIA % Above 30 Day Average 13.33
DJIA % Above 10 Day Average 30.00
DJIA % Above 5 Day Average 16.67
Secondary Trend Indicator Fell 1 to Negative - 10, On a Sell
Demand Power Flat at 484, Supply Pressure Fell 4 to 591 Sell
McClellan Oscillator rose slightly to positive 1.21.
McClellan Osc Summation Index Negative - 1847.28
DJIA 10 Day Advance/Decline Indicator - 308.1 on a Sell
NYSE New Highs 15 New Lows 364
Today's Technology NDX Market Comments:
The NDX Short-term key Trend-finder Indicators moved to a Neutral signal Friday, May 18th, 2022, and remain there May 20th, 2022. The NDX Purchasing Power Indicator generated a Sell on May18th, 2022, the NDX 14 Day Stochastic triggered a Buy on May 13th, 2022, and the 30 Day Stochastic triggered a Buy signal on May 13th, 2022. When all three component indicators are in agreement on signals, it is a consensus directional signal. When they differ, it is a sideways signal.
The NDX Demand Power / Supply Pressure Indicator moved to a Sell Signal Monday, April 11th, and remains there May 20th. On Friday, Demand Power Rose 1 to 432, while Supply Pressure Fell 2 to 483, telling us Friday's decline was mild.
The NDX 10 Day Average Advance/Decline Line Indicator triggered a Sell signal April 11th, and needs to rise above positive + 5.0 for a new Buy. It rose to zero, 0.0 on Friday.
NDX 100 Purchasing Power Indicator Flat at 194.78 On a Sell
NDX 30 Day Stochastic Fast 15.00 Slow 16.40 On a Buy
NDX 14 Day Stochastic Fast 35.00 Slow 33.60 On a Buy
NDX 10 Day Advance/Decline Line Indicator zero, 0.00, On a Sell
NDX Demand Power Up 1 to 431, Supply Pressure Fell 4 to 485 Sell
RUT PPI Flat at + 156.23, on a Buy
RUT 10 Day Advance/Decline Line Indicator - 132.90, On a Sell
McHugh's Market Forecasting and Trading Report and this Executive Summary from that report is an educational service providing a body of technical analysis that measures the possibility and probability of future changes in mass psychology (swings from pessimism to optimism and back) which identifies possible new trends in major markets within various time frames, from very short term (daily) through very long term (years and decades). The tools we use are based upon price patterns, indicators and other proprietary measures that we have identified as correlative to future market trends. While an investor or trader could come up with ideas and strategies from the information published in our reports, at no time should a reader or viewer be justified in inferring that any such advice is intended by this publication or our other services. We are not offering investing advice, but are only offering some (but not all) of the information that can be used in the investment decision making process with your own personal financial adviser. Investing carries risk of losses. Information provided by Robert D. McHugh's Market Forecasting and Trading Report is expressed in good faith, but it is not guaranteed. |


