thanks, Brandon
March Non-OPEC Oil Production at Post Pandemic high
07/23/2022 Ovi Non-OPEC production, Norway, Oil Production, Production Projections, US Oil Production
A guest post by Ovi
Below are a number of crude oil plus condensate (C + C ) production charts for Non-OPEC countries created from data provided by the EIA’s International Energy Statistics and updated to March 2022. This is the latest and most detailed world oil production information available. Information from other sources such as OPEC, the STEO and country specific sites such as Russia, Brazil, Norway and China is used to provide a short term outlook for future output and direction for a few countries and the world.
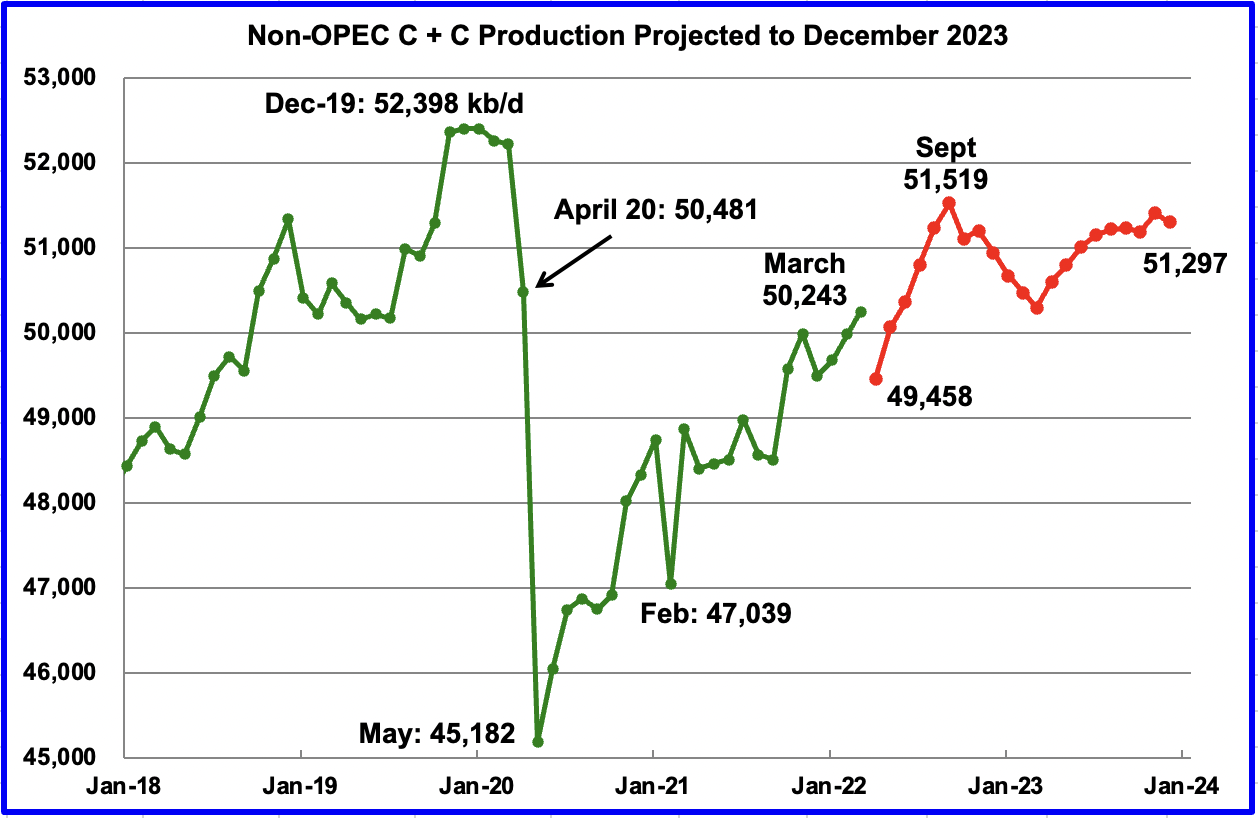
March Non-OPEC production increased by 264 kb/d to 50,243 kb/d. Of the 264 kb/d increase, the biggest increases came from the U.S., 349 kb/d and China, 78 kb/d. Offsetting the increases were decreases from Kazakhstan, Russia and Norway. The March 2022 output of 50,243 kb/d is 1,975 kb/d lower than the March pre-covid rate of 52,218 kb/d.
Using data from the July 2022 STEO, a projection for Non-OPEC oil output was made for the time period April 2022 to December 2023. (Red graph). Output is expected to reach 51,297 kb/d in December 2023. Note the April production drop of 785 kb/d to 49,458 kb/d in the red graph is associated with a projected output drop in Russia. The production rise to 51,519 kb/d by September is related to projected increases by OPEC + and the U.S.
The April 785 kb/d production drop may be realistic since according to this source, April Non-OPEC all liquids production dropped: “Non-OPEC production saw a decrease of 810,000 bpd to 64.92 million bpd in April”.
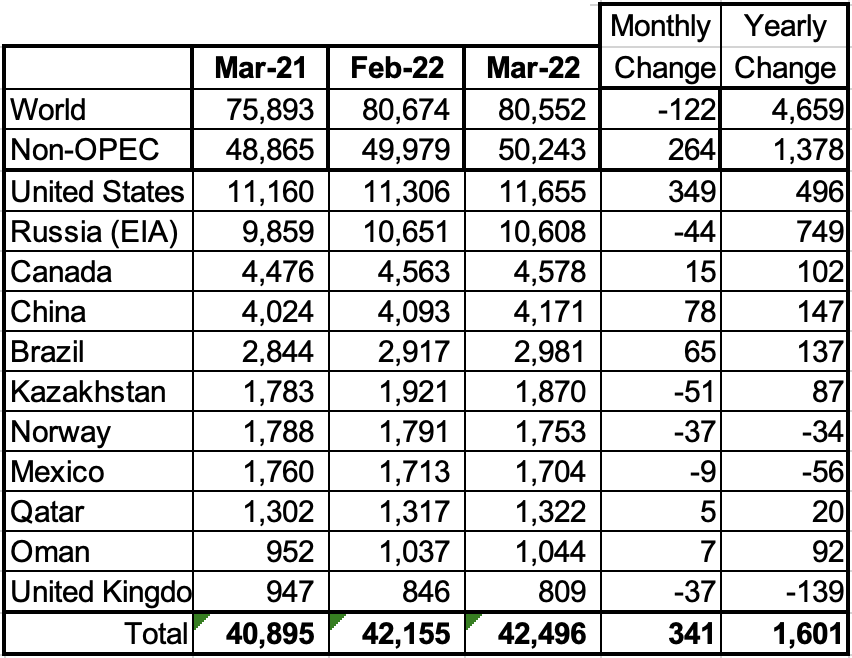
Above are listed the world’s 11th largest Non-OPEC producers. The original criteria for inclusion in the table was that all of the countries produced more than 1,000 kb/d. The UK has been below 1,000 kb/d since January 2021.
In March 2022, these 11 countries produced 84.6% of the Non-OPEC oil. On a YoY basis, Non-OPEC production increased by 1,378 kb/d while on a MoM basis production, it increased by 264 kb/d. World YoY March output increased by 4,659 kb/d.
continues
peakoilbarrel.com
from the comments...
SRSROCCO
IGNORED
07/24/2022 at 3:28 pm
Ovi,
Agreed… 100%. However, while the ESG and Anti-Oil & Gas policies have been a bit of a BUMMER for Global Upstream Investment, the data suggests problems were already beginning to occur before ESG became much of an issue.
In looking at the Rystad & BP Statistical data for these two periods:
2010-2014 Global Oil Investment = $3.6 trillion
2010-2014 Global Oil Discoveries = 51 billion barrels
2010-2014 Global Oil Demand = 140 billion barrels
2010-2014 Demand vs Discoveries = 2.7 to 1 (barrels)
2015-2021 Global Oil Investment = $3.4 trillion
2015-2021 Global Oil Discoveries = 38 billion barrels
2015-2021 Global Oil Demand = 207 billion barrels.
2015-2021 Demand vs Discoveries = 5.4 to 1 (barrels)
The takeaway from this data set shows that even with significant global oil investment, we aren’t finding that much oil. Sure, the global oil investment from 2015-2021 was less than 2010-2014, but oil companies aren’t too stupid to realize they’re just isn’t that much good quality out there remaining.
For example, Offshore oil exploration has been a complete mess in the past 5-10 years with DRY HOLE percentages surging. The only Outlier has been Offshore Guyana. But, that Sweet spot won’t last forever and will not offset the declines coming.
Furthermore, the Demand for oil versus Discoveries has doubled from 2.7 barrels during 2010-2014, to 5.4 barrels from 2015-2021. Thus, the issue isn’t that we aren’t spending enough money on finding new oil… THE LORD GOD & MOTHER NATURE only provided us with a certain amount of high-quality oil, and we had a great deal of fun burning most of it in the past 100 years.
Lastly, with the Coming Collapse of the Global Debt Market, that will also pop the Global Assets. The collapse of the Global Asset Market will destroy the ability to produce oil in the future.
Thus, we have the ENERGY CLIFF.
steve |


