| | | Look what Trump did to oil production. .
June Non-OPEC Oil Production Rises from U.S. and Russia Boost
10/12/2022 Ovi Non-OPEC production, Norway
A guest post by Ovi
Below are a number of Crude oil plus Condensate (C + C ) production charts for Non-OPEC countries created from data provided by the EIA’s International Energy Statistics and updated to June 2022. This is the latest and most detailed world oil production information available. Information from other sources such as OPEC, the STEO and country specific sites such as Russia, Brazil, Norway and China is used to provide a short term outlook for future output and direction for a few countries and the world. The US report has an expanded view beyond production by adding rig and frac charts.
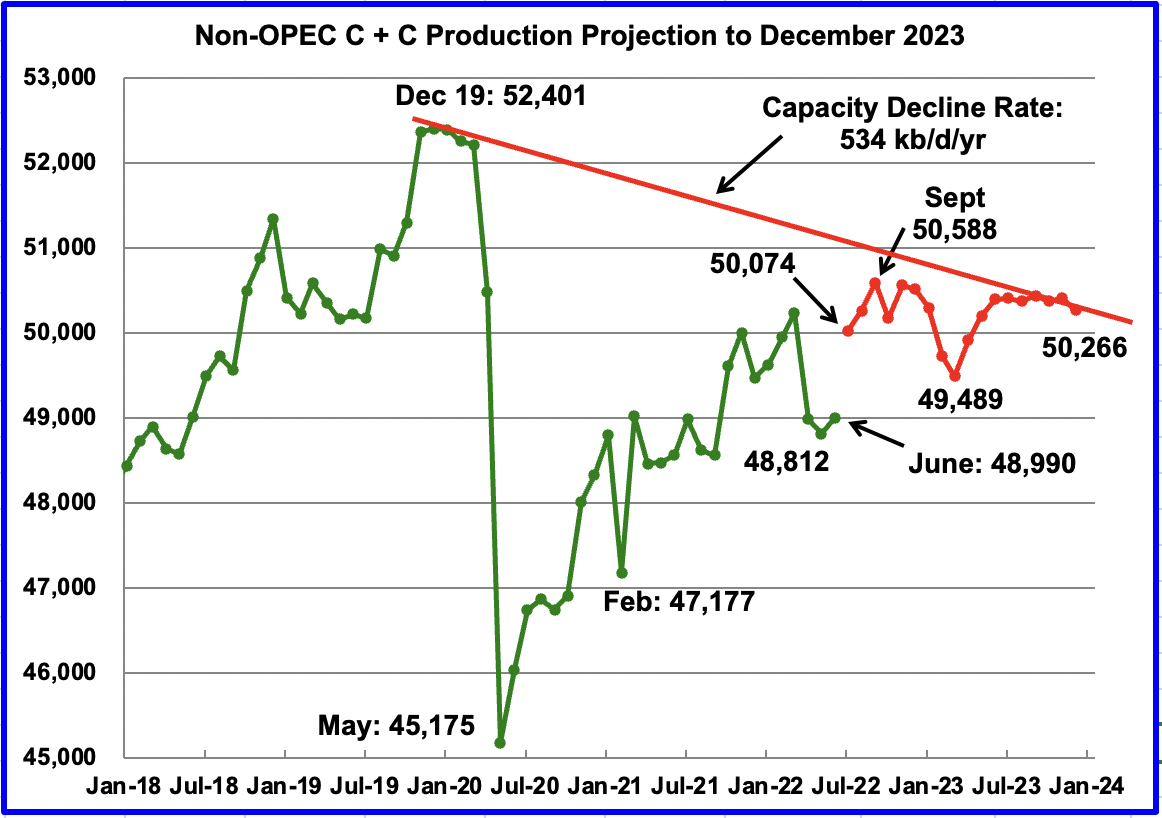 June Non-OPEC production increased by 178 kb/d to 48,990 kb/d. The largest increases came from Russia, 510 kb/d and the U.S., 201 kb/d. The largest offsetting decreases came from Kazakhstan, 381 kb/d and Norway, 285 kb/d. June Non-OPEC production increased by 178 kb/d to 48,990 kb/d. The largest increases came from Russia, 510 kb/d and the U.S., 201 kb/d. The largest offsetting decreases came from Kazakhstan, 381 kb/d and Norway, 285 kb/d.
Using data from the October 2022 STEO, a projection for Non-OPEC oil output was made for the time period July 2022 to December 2023. (Red graph). Output is expected to be 50,266 kb/d in December 2023. This forecast is 608 kb/d lower than predicted in the September report due to significant downward changes in the October STEO.
The large increase in July is due to a 1,600 kb/d increase in all liquids over June forecast in the October STEO. The C + C projection reduces the 1,600 kb/d increase to 1,084 kb/d.
Note that the September 2022 high of 50,588 kb/d is the high for all of 2022 and 2023.
The red capacity decline line represents an average decline rate for Non-OPEC countries over the four years since December 2019 and is combination of the natural decline rate plus possible reduction in exploration and production capacity/investment.
Non-OPEC Oil Production Ranked by Country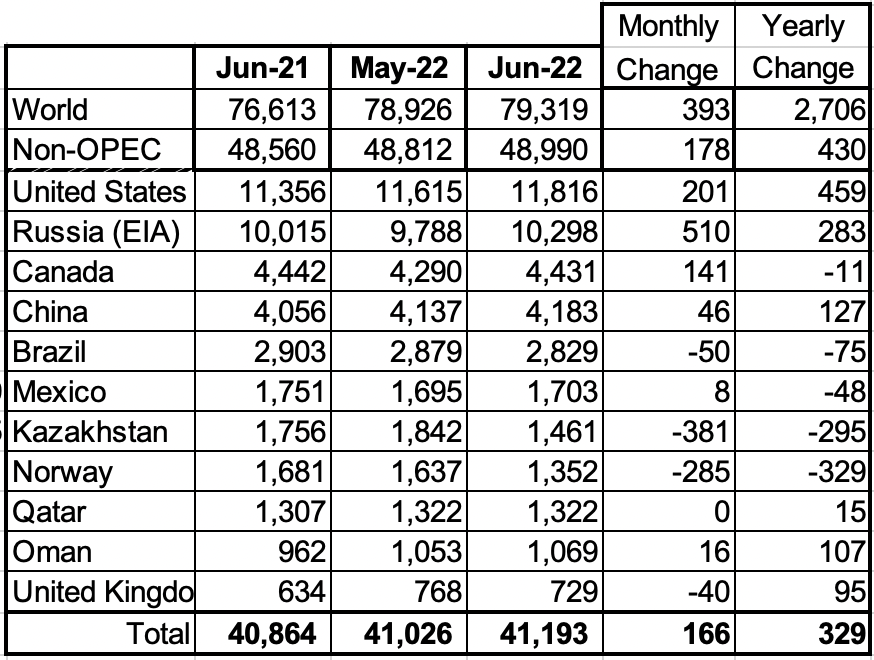
continued...
peakoilbarrel.com |
|
|


