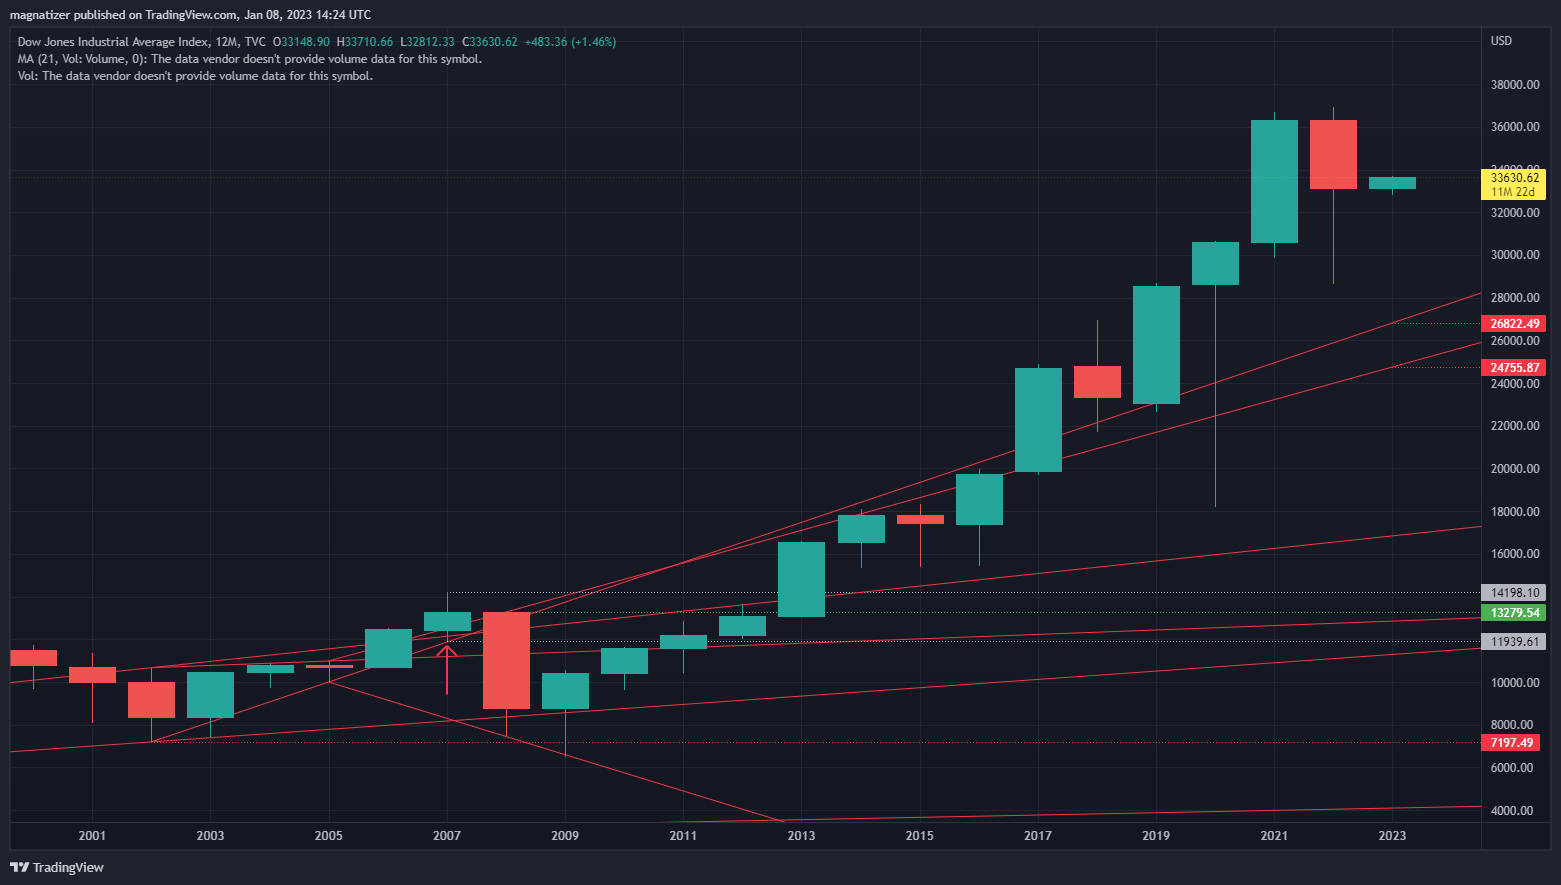
Yearly
Last bar in flight
Hard to say if these are relevant, perhaps they need to be log scale. But, FWIW... here's a few yearly CCI55 system charts
DJI from 2000 forward
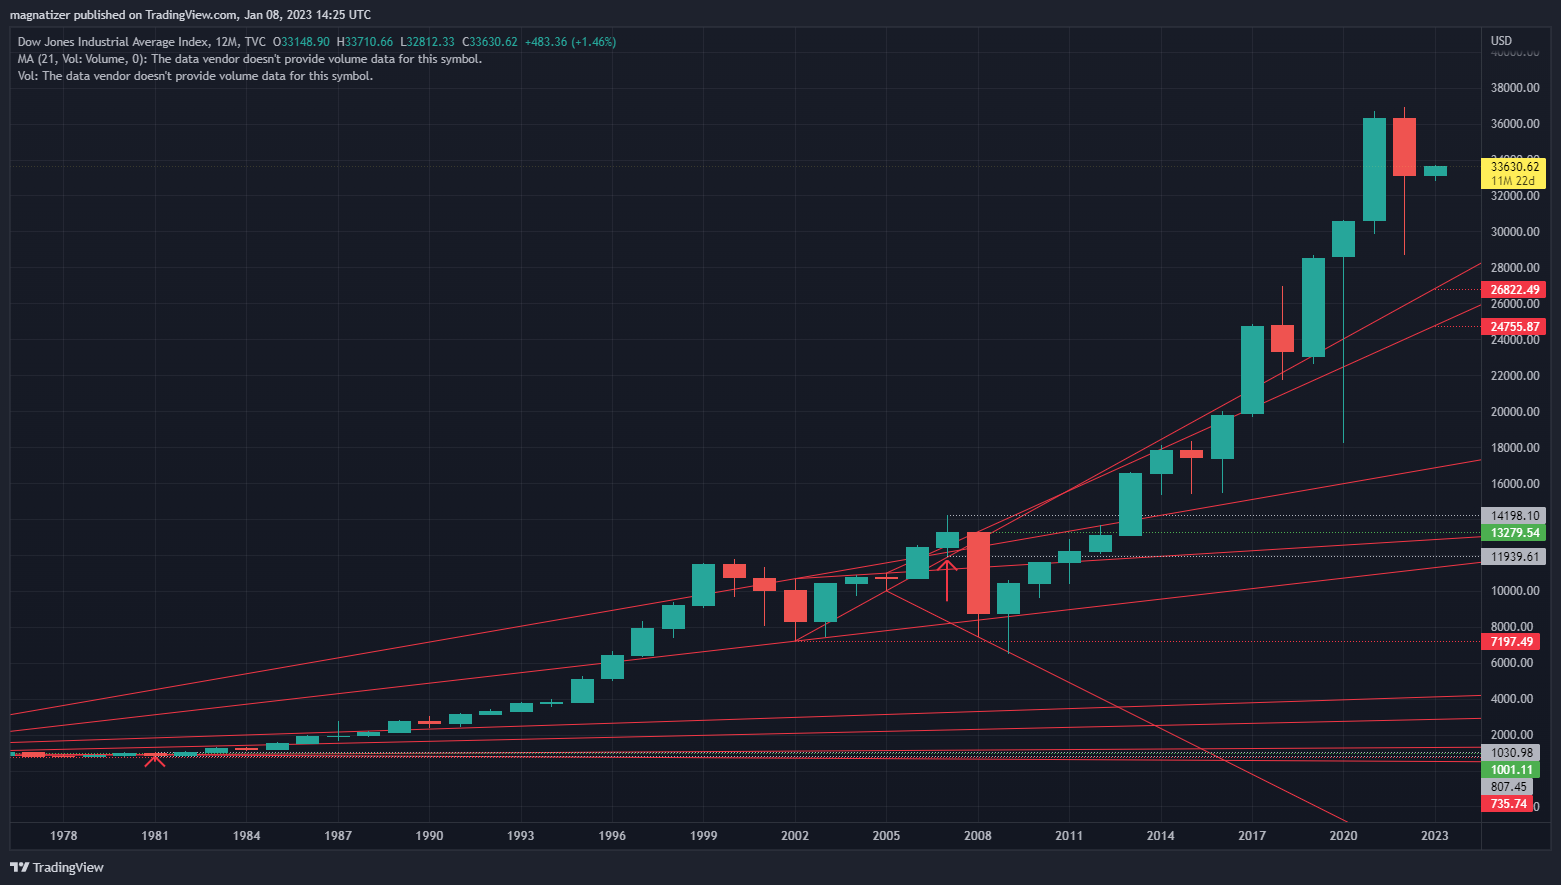
1981 forward
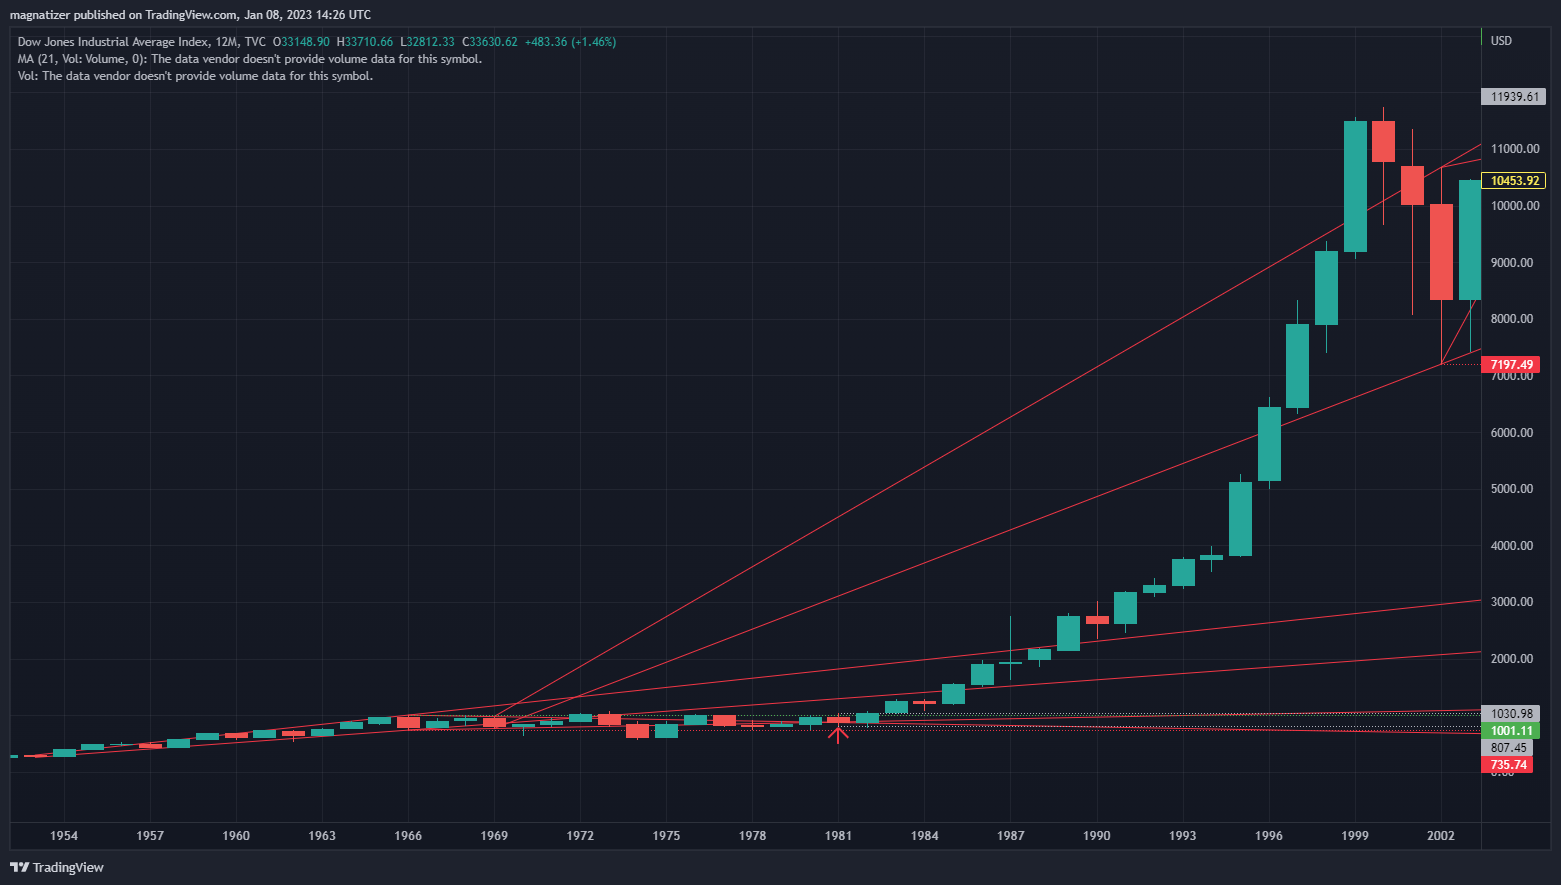
1953 to 2002
Keep in mind, the highest uptrend on this chart did not form until the signal bar in 2002. From 1989 forward, DJI was pulling away from the uptrend channel formed from the 1953 to 1966 signal bars. This the only relative example I have, will show what happened after the 2002 signal next
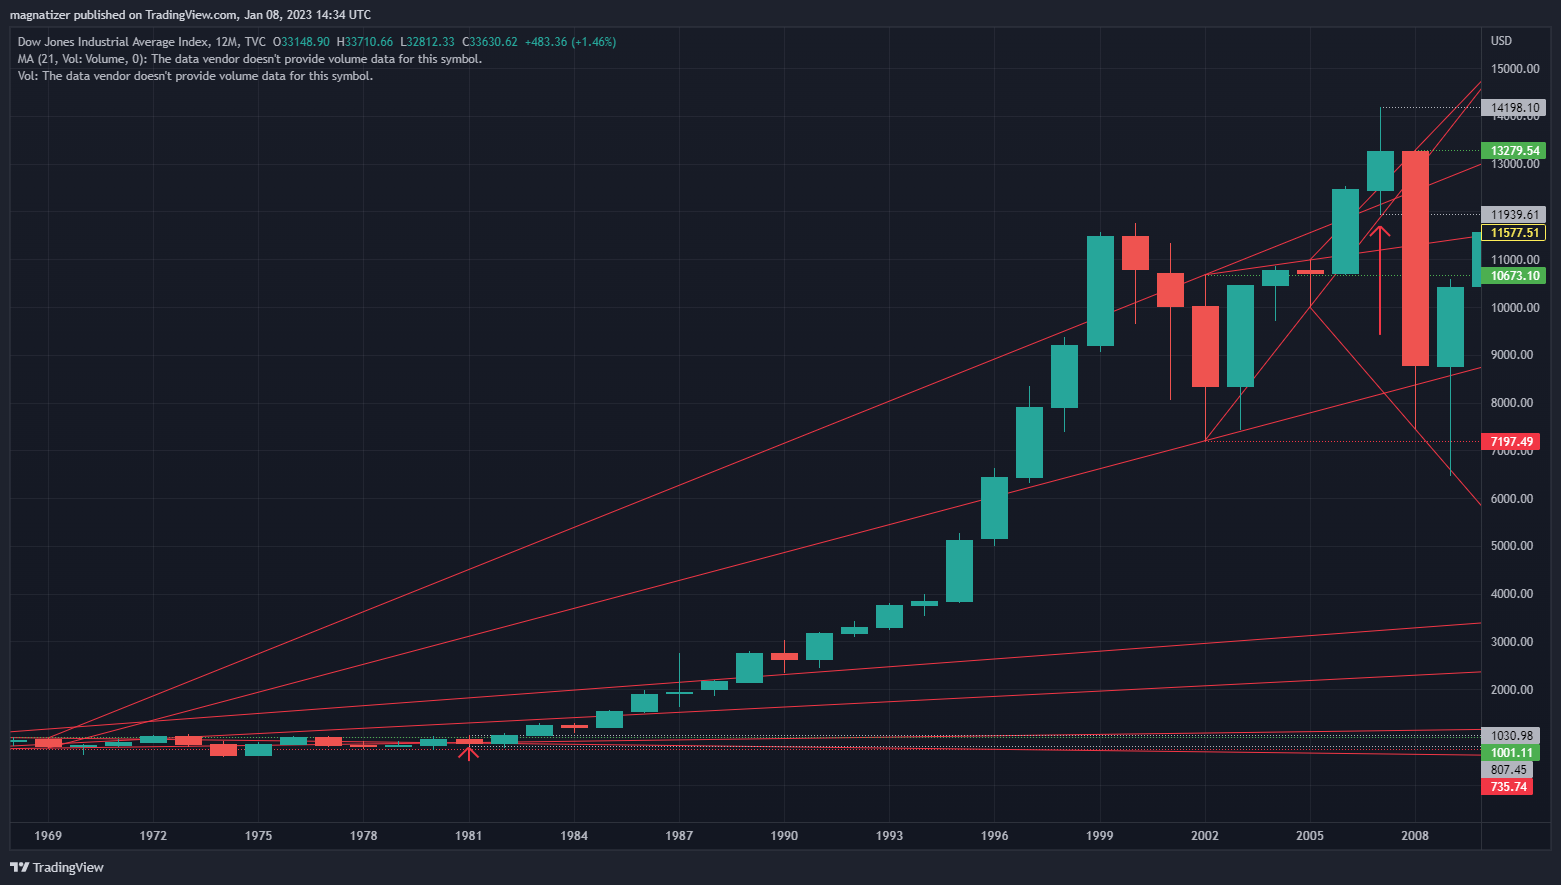
1969 to 2009
Signal bars: 1969, 2002, 05, 08
Tline cross bars: 1981, 2007
Currently, no tline crosses pending.
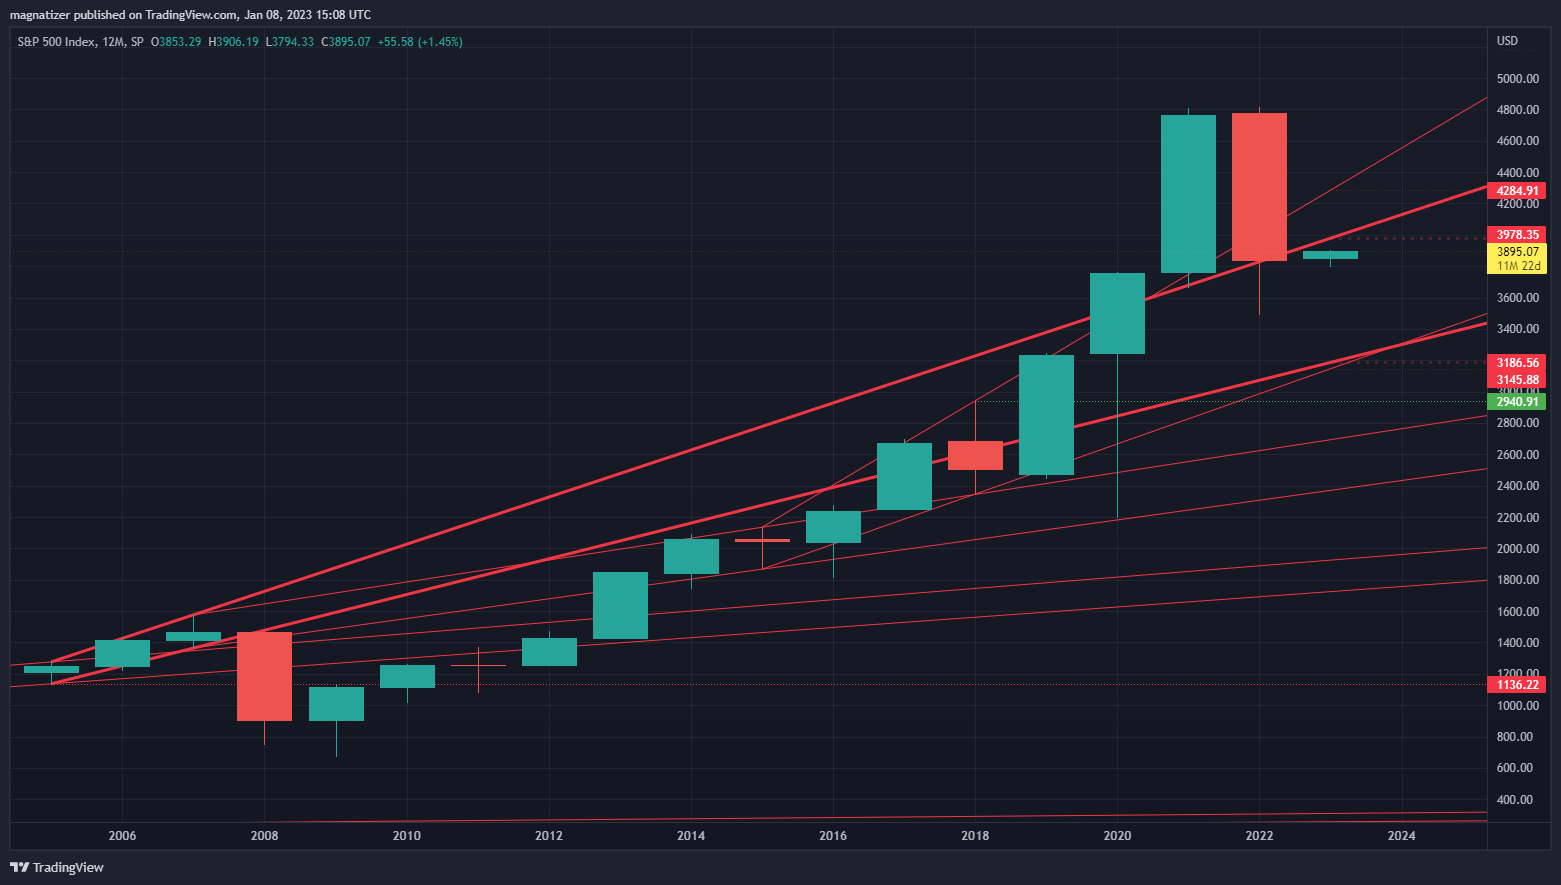
SPX
Signal years: 1930, 37, 69, 73, 2005, 07, 15, 18
Tline cross: 1955
When this system has wiggle signals (happen within a few bars of one another) the resulting trendlines seem to have more relevance. In the case of the SPX, the 05 to 07 connection is a very interesting (see thick red uptrends). The top and bottom of this uptrend channel are at 3978 and 3186 in 2023
2007 to 2015 and 2015 to 18 are all part of the same wiggle.
 |


