Mapping the World’s Forests: How Green is Our Globe?
Adam Symington (PythonMaps)January 20, 2023
Published
17 hours agoon
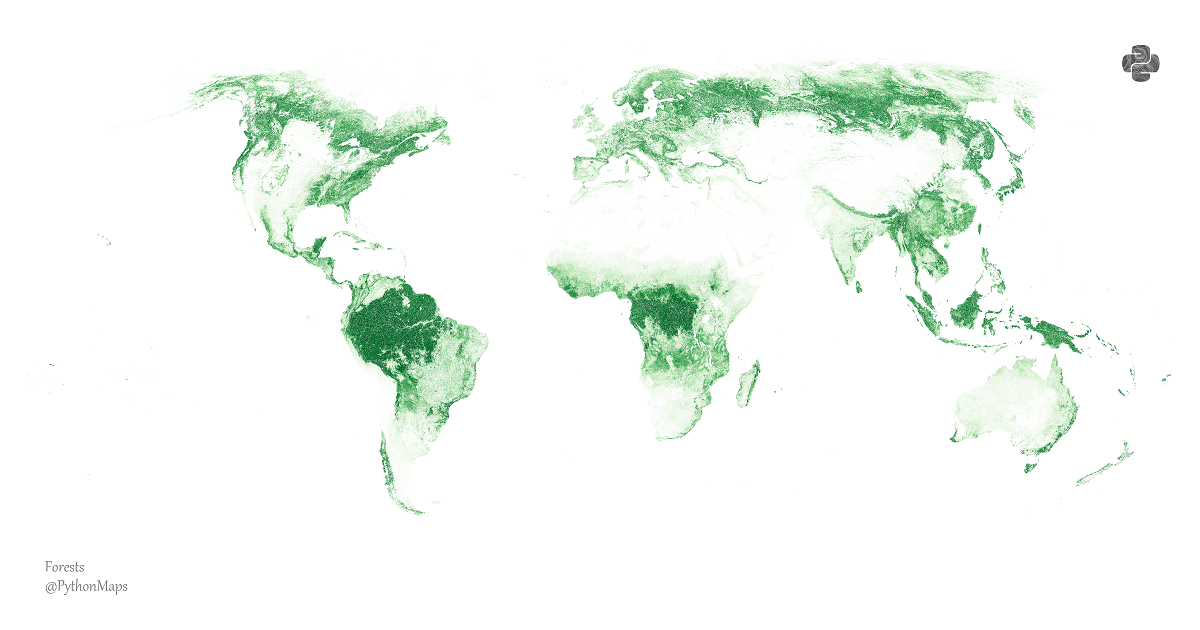
According to the United Nations ( UN), forests cover 31% of the world’s land surface. They absorb roughly 15.6 billion tonnes of carbon dioxide (CO2) every year.
More than half of this green cover is spread across the boreal forests of Russia and Canada, the Amazon in South America, and China’s coniferous and broad-leaved forests. These carbon-sequestering forests purify the air, filter water, prevent soil erosion, and act as an important buffer against climate change.
RankCountryForest Cover (in millions of hectares) | #1 | ???? Russia | 815 | | #2 | ???? Brazil | 497 | | #3 | ???? Canada | 347 | | #4 | ???? United States | 310 | | #5 | ???? China | 220 | | #6 | ???? Australia | 134 | | #7 | ???? Democratic Republic of the Congo | 126 | | #8 | ???? Indonesia | 92 | | #9 | ???? Peru | 72 | | #10 | ???? India | 72 |
This series of maps by Adam Symington uses data sourced from images collected aboard the MODIS sensor on the Terra satellite to reflect the ratio of the world’s surface covered with tree canopy to non-green areas.
To explore the entire high resolution forest map, click the image above. Below we’ll take a closer look at some of the world’s green zones.
AsiaHome to the boreal forests of Russia, China’s broad-leaved forests, the mangrove forests of Indonesia, and the green belt along the mighty Himalayas, Asia boasts some of the richest and most biodiverse green canopies of the world.
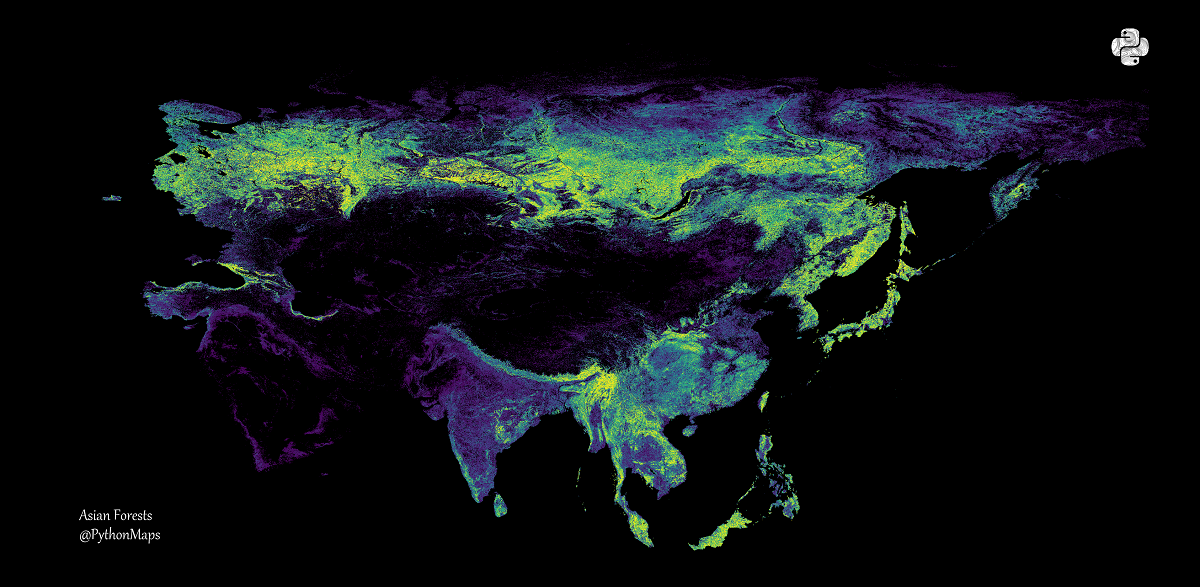
Russia holds more than one-fifth of the world’s trees across 815 million hectares—larger than the Amazon’s canopy. Like the country’s geography, most of Russia’s forests are situated in Asia, but spread into Europe as well.
To the southeast and with a forest cover of almost 220 million hectares, Chinais the fifth greenest country in the world. However, this was not always the case.
In 1990, China’s forests stretched across only 157 million hectares, covering 16.7% of its land. By the end of 2020, this forest cover reached 23.4%, thanks to decades of greening efforts.
On the other hand, the continent’s third most biodiverse country—Indonesia—is losing its green canopy. With a 92 million hectare-wide forest canopy, the country is home to between 10 and 15% of the world’s known plants, mammals, and birds. Unfortunately, over the past 50 years, 74 million hectares of the country’s rainforest have been logged, burned, or degraded.
Meanwhile, the 72 million hectares of Indian forest cover can be followed closely with the eye. From the rainforests along the Himalayas in the northeast, to montane rainforests of the South Western Ghats, and finally to the coastal mangrove forests.
The Amazon and Congolian Rainforests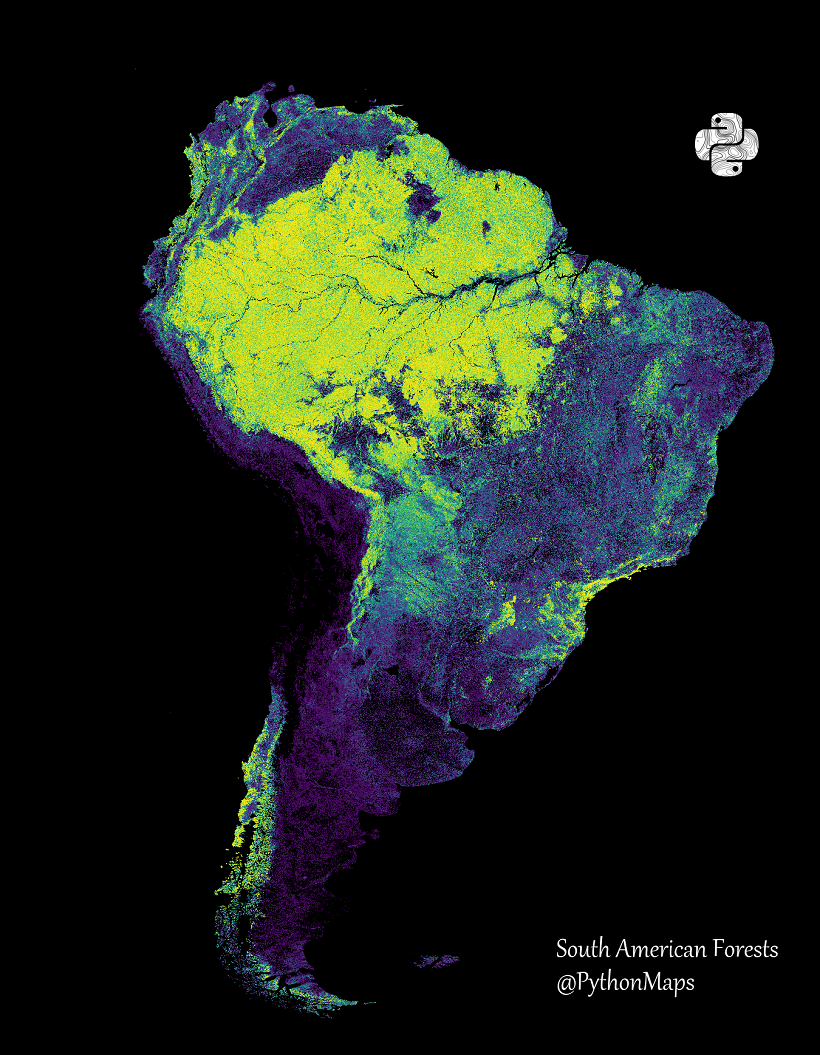 In South America, Brazil has the second-largest green cover in the world. In South America, Brazil has the second-largest green cover in the world.
Most of its 497 million hectare-wide forest cover falls within “the lungs of the planet”—the Amazon rainforest.
One of the most biodiverse places on the planet, the Amazon rainforest is said to house about 10% of the world’s biodiversity, including over three million wildlife species and over 2,500 tree species.
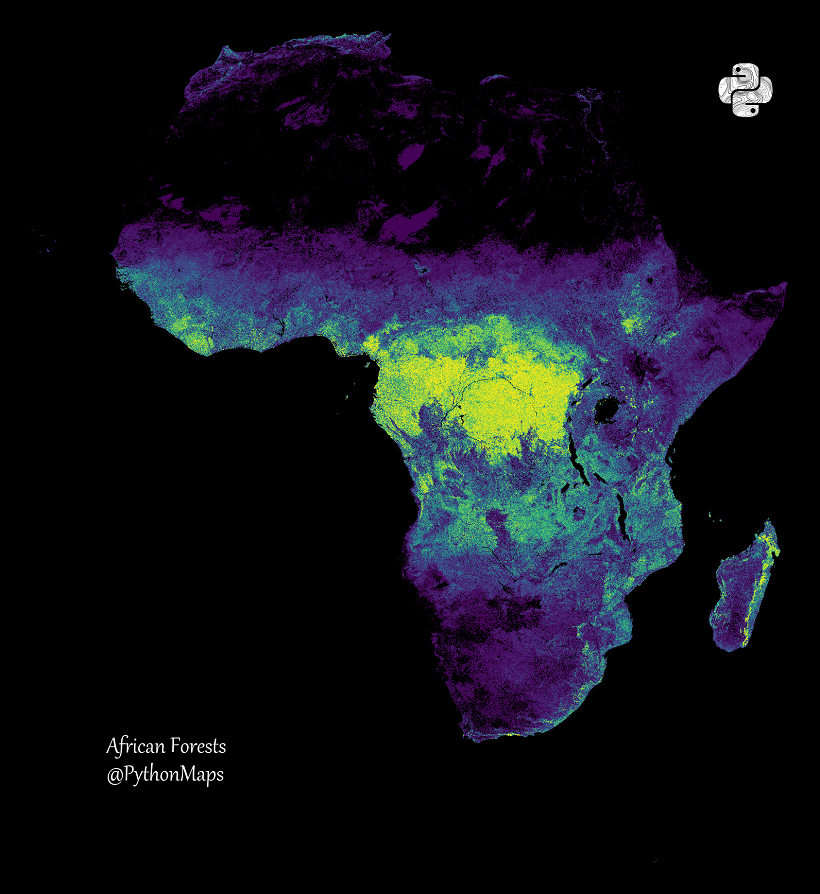 On the other side of the Atlantic, extending along the Congo River basin and its many tributaries, are the Congolian rainforests. On the other side of the Atlantic, extending along the Congo River basin and its many tributaries, are the Congolian rainforests.
Spread across nine countries in Central Africa, this collection of tropical moist broadleaf forests is one of the remaining regions in the world that absorbs more carbon than it emits.
With 126 million hectares of the world’s green cover, the Democratic Republic of Congo (DRC) contains the largest part of this rainforest, equal to about 60% of Central Africa’s lowland forest cover.
North American ForestsCanada, the United States, and Mexico combine for 723 million hectares of the world’s forests. The vast stretches of pine and fir trees in the Great White North, coupled with the United States’ mixed variety of forests, make the continent one of the largest carbon sinks in the world.
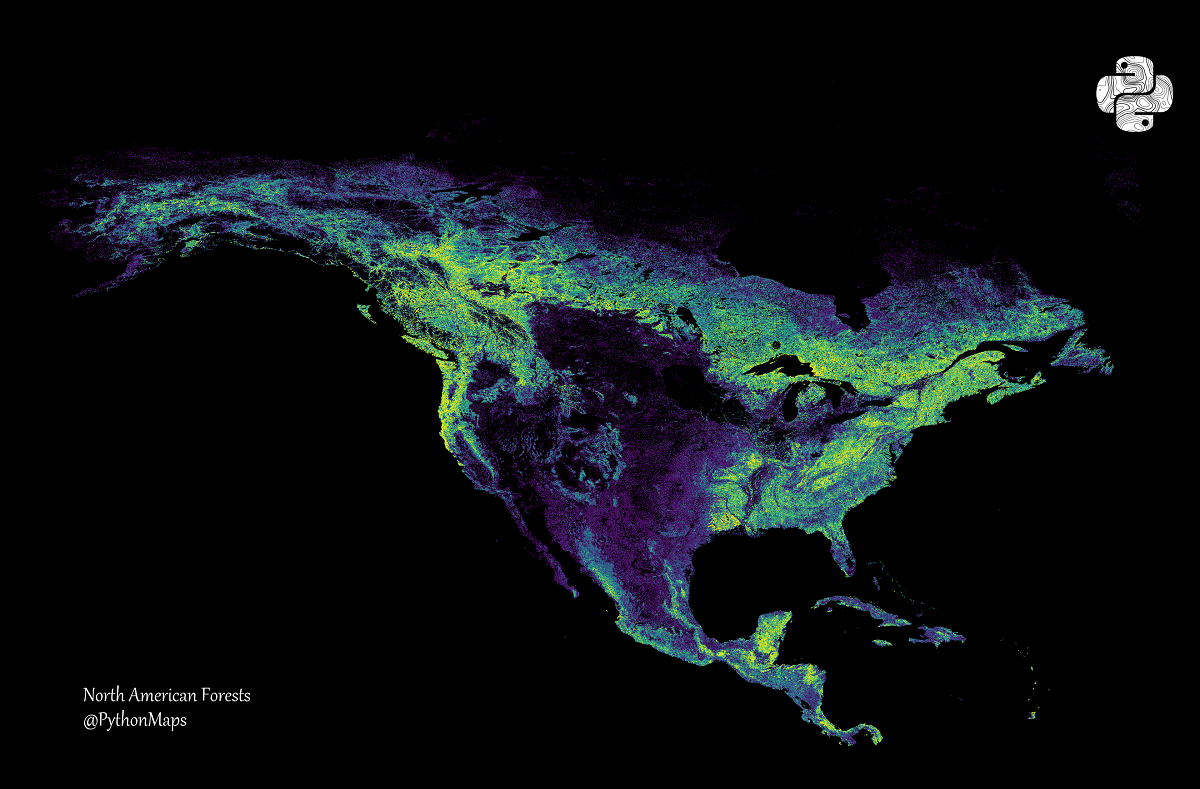
With over 347 million hectares of forests, Canada ranks third in the list of greenest countries. Approximately 40% of its landmass is tree-covered, representing 9% of the global forest cover.
Its boreal forests store twice as much carbon per unit as tropical forests and help regulate the global carbon footprint.
The United States, on the other hand, holds about 8% of the world’s forests. Spread across 310 million hectares of land, these diverse forests range from the boreal forests of Alaska to pine plantations in the South, and the deciduous forests in the Eastern United States to the dry coniferous forests in the West. The country is also home to temperate rainforests along its West Coast and tropical rainforests in Puerto Rico and Hawaii.
The World’s Lost ForestsWhile China and a few select countries have proven that there is hope for building out the world’s forests, the story is different in other places around the world. This map by Adam Symington uses data from the University of Maryland to track the changes in the world’s forest cover from 2000 to 2021.
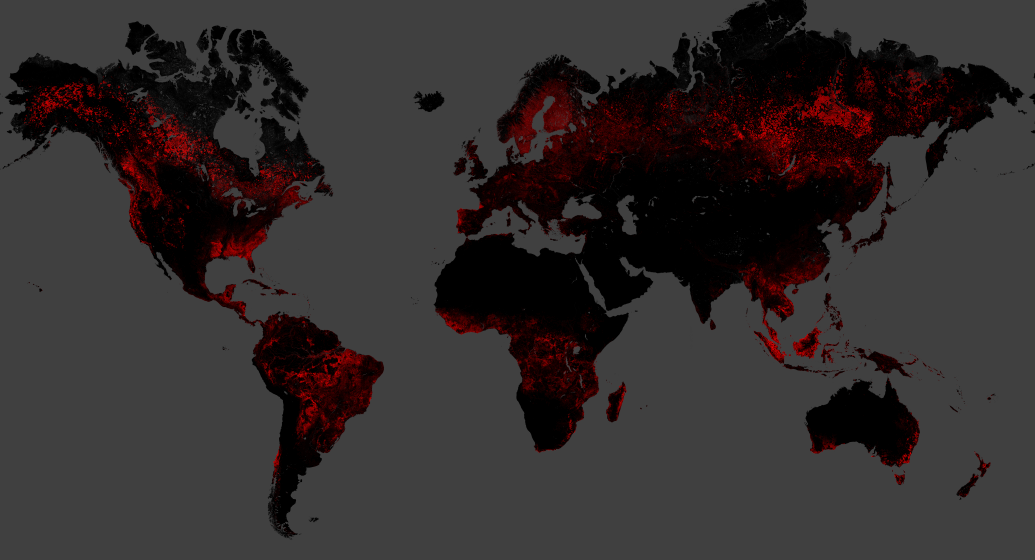
Since 2000, the world lost over 104 million hectares of pristine and intact forest landscapes. In 2020 alone, over 10 thousand square kilometers of the Amazon were destroyed for the development of roads.
Deforestation and fragmentation are caused by a range of human development activities. But they are also exacerbated by climate change, with increasing forest fires, hurricanes, droughts, and other extreme weather events, as well as invasive species and insect outbreaks upsetting forest ecosystems.
At the 2022 UN Biodiversity Conference (COP15) held in Montréal, nations across the world committed to the 30X30 plan, which called for the conservation of the world’s land and marine ecosystems by 2030. Alongside other commitments to end deforestation and grow the world’s canopies, there is still hope for the world’s forests.
This article was published as a part of Visual Capitalist's Creator Program, which features data-driven visuals from some of our favorite Creators around the world.

EnergyA Visual Crash Course on Geothermal EnergyThis infographic teaches you everything you need to know about geothermal energy in less than 5 minutes.
Published
1 month agoon
December 21, 2022
A Visual Crash Course on Geothermal EnergyThis was originally posted on Elements. Sign up to the free mailing list to get beautiful visualizations on natural resource megatrends in your email every week.
Geothermal is a lesser-known type of renewable energy that uses heat from the Earth’s molten core to produce electricity.
While this unique feature gives it key benefits over solar and wind, it also suffers from high costs and geographic restrictions. Because of this, few countries have managed to produce geothermal energy at scale.
In this infographic, we’ve used a combination of diagrams and charts to give you a high level overview of this sustainable energy source.
How Geothermal WorksGeothermal energy is produced by accessing reservoirs of hot water that are found several miles below the earth’s surface. In certain parts of the planet, this water naturally breaks through the surface, creating what’s known as a hot spring (or in some cases, a geyser).
When accessed via a well, this pressurized water rises up and rapidly expands into steam. That steam is used to spin a turbine, which then drives an electric generator.
Further along the process, excess steam is condensed back into water as it passes through a cooling tower. An injection well pumps this water back into the Earth to ensure sustainability.
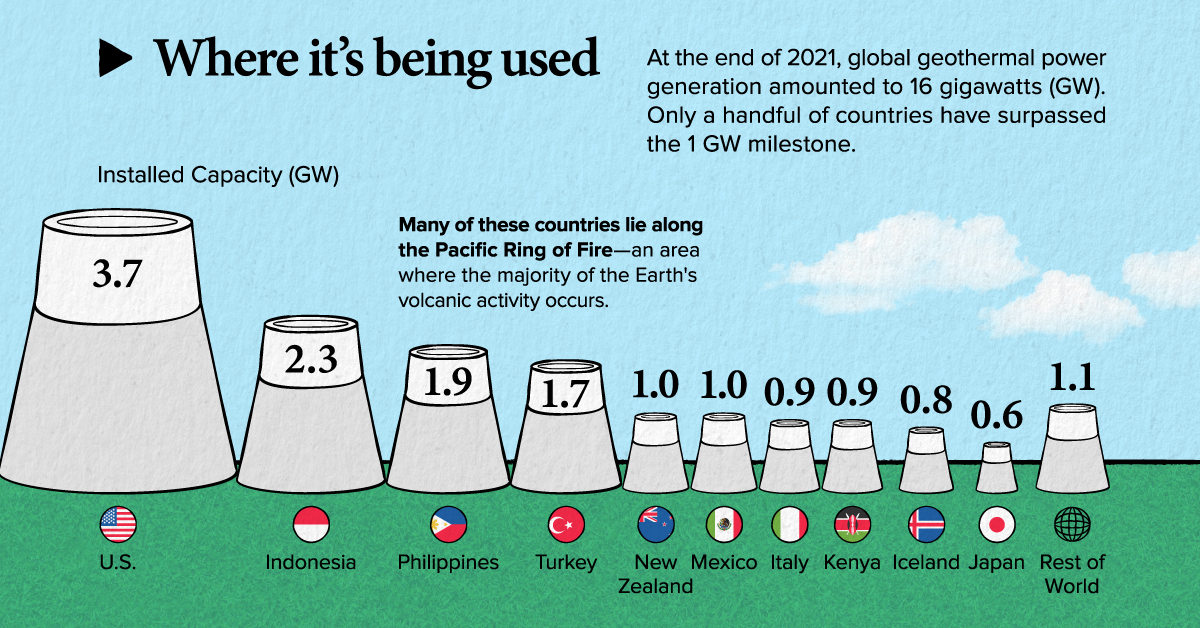
Where Is Geothermal Energy Being Used?As of 2021, global geothermal power generation amounted to 16 gigawatts(GW). Only a handful of countries have surpassed the 1GW milestone.
CountryInstalled Capacity (GW) | ???? U.S. | 3.7 | | ???? Indonesia | 2.3 | | ???? Philippines | 1.9 | | ???? Turkey | 1.7 | | ???? New Zealand | 1 | | ???? Mexico | 1 | | ???? Italy | 0.9 | | ???? Kenya | 0.9 | | ???? Iceland | 0.8 | | ???? Japan | 0.6 | | ?? Rest of World | 1.1 |
To give these numbers context, consider the following datapoints:
America’s 3.7 GW capacity is split across 61 geothermal plants.The world’s largest solar plant, the Bhadla Solar Park, has a maximum output of 2.2 GWThe world’s largest hydroelectric plant, the Three Gorges Dam, can produce up to 22.5 GWWhile geothermal plants clearly produce less power, they do have benefits over other types of renewables. For example, geothermal energy is not impacted by day-night cycles, weather conditions, or seasons.
The Big PictureWe now look at a second dataset, which shows the global contribution of each type of renewable energy. These figures are as of April 2022, and were sourced from the International Renewable Energy Agency (IRENA).
TypeInstalled Capacity (% of total)Installed Capacity (GW) | Hydro | 40% | 1226 | | Solar | 28% | 858 | | Wind | 27% | 827 | Others
(Geothermal) | 5%
(0.5%) | 153
(15*) | | Total | 100% | 3064 |
*Geothermal’s total capacity in this dataset differs from the previous value of 16GW. This is due to differing sources and rounding.
One reason for the slow adoption of geothermal energy is that they can only be built in regions that have suitable geological features (such as places where there is volcanic activity).
To expand on that point, consider the following data from Fitch Solutions, which shows the forecasted growth of geothermal energy capacity by region.
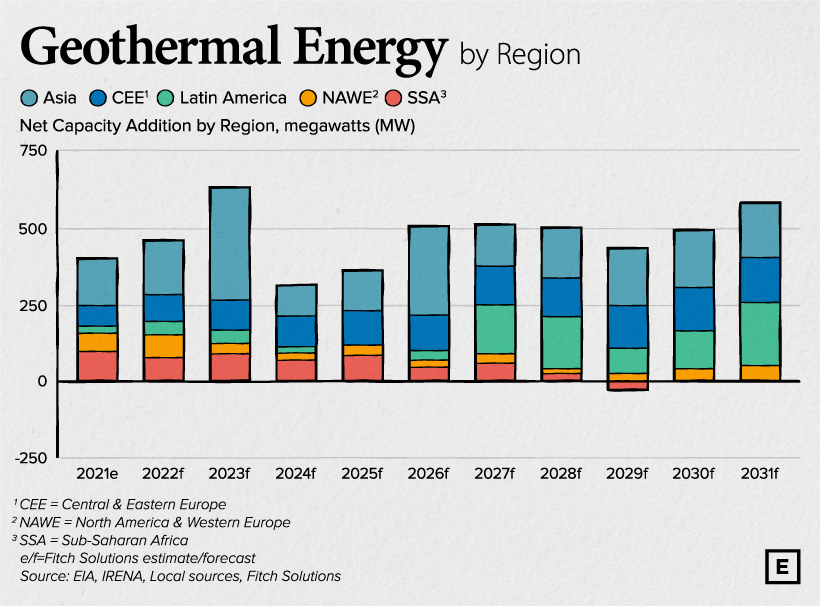
Fitch believes that over the next decade, the majority of new geothermal capacity will be installed in Asia. On the flipside, investment in North America and Western Europe (NAWE) is expected to decrease.
Over the coming years, NAWE will experience a gradual slowdown in geothermal capacity additions as we expect that investments will be crowded out by cheaper wind and solar projects.
– Fitch Solutionsnone
The top markets for geothermal are expected to be Indonesia, the Philippines, and New Zealand, which all lie along the Pacific Ring of Fire. The Ring of Fire is a path along the Pacific Ocean where the majority of volcanic activity occurs.
Continue Reading |


 In South America, Brazil has the second-largest green cover in the world.
 On the other side of the Atlantic, extending along the Congo River basin and its many tributaries, are the Congolian rainforests.


