| | | I forgot to post this.
2022 updates to model-observation comparisons3 FEB 2023 BY GAVIN
Our annual post related to the comparisons between long standing records and climate models.
As frequent readers will know, we maintain a page of comparisons between climate model projections and the relevant observational records, and since they are mostly for the global mean numbers, these get updated once the temperature products get updated for the prior full year. This has now been completed for 2022.
realclimate.org
==
Climate model projections compared to observations
Since we have been periodically posting updates (e.g. 2009, 2010, 2011, 2012, 2015, 2016 etc.) of model output comparisons to observations across a range of variables, we have now set up this page as a permanent placeholder for the most up-to-date comparisons. We include surface temperature projections from 1981, 1988, CMIP3, CMIP5, and CMIP6, and MSU satellite products from CMIP5, and we will update this on an annual basis, or as new observational products become available. For each comparison, we note the last update date, and where the comparison was first discussed.
Note that Hausfather et al. (2020) made a more complete assessment of surface temperature projections from models from 1970 through to CMIP3 ( discussed here).
Global mean surface temperature anomaliesHansen et al (1981)
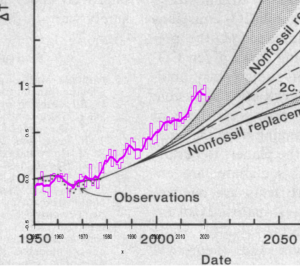
Original discussion (figure originally courtesy of Geert Jan van Oldenborgh, Hansen et al. (1981)). Observations are the GISTEMP LOTI annual figures and 5 year mean. Last updated: 16 Jan 2023.
Hansen et al (1988)
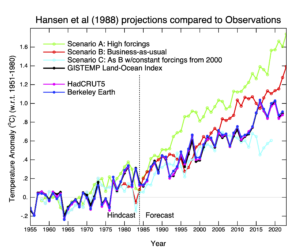
Original discussion (2007), Last discussion (2018). Scenarios from Hansen et al. (1988). Observations are the GISTEMP LOTI annual figures. Trends from 1984: GISTEMP: 0.20ºC/dec, Scenarios A, B, C: 0.34, 0.28, 0.15ºC/dec respectively (all 95% CI ~±0.02 or 0.03). Last updated: 16 Jan 2023.
more
realclimate.org |
|


