| | | The 16th (Humble), the 17th (Tweets), the 19th (Copeland). All three of us were looking at similar TA, including namely astro and time cycles.
The response has been as expected, technically the longer term TC tops could still have a bit left, they run into the end of June basically. But so far looking decent for some correction here.
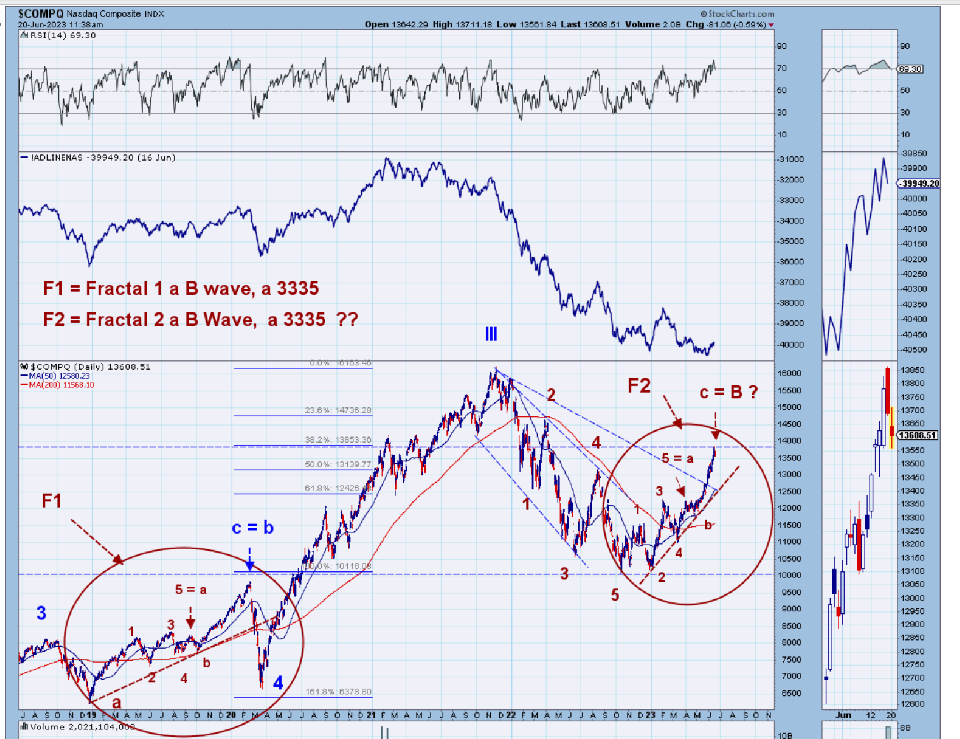
6 months ago I was a bull, then I more or less switched to agnostic. Main reason was the time factor, the grind was taking too long. And if the Ndx top is a Big III, it should probably take more than a year to complete the correction. Imho. This is a top of major degree, as charted here.
I am following the Comp at the moment and especially Apple. Apple, Msoft and Nividia account for ~ 25 % of the Ndx at the moment, and likewise have a decent effect on the Spx and Indu. Much less on the Comp, especially the advance decline.
I put question marks on these cuz there are alternate counts and all that stuff. Just the way it works. But I am not convinced that this correction in a bigger sense is over. And maybe we just completed a B wave. The proof remains to be seen. The cycles right now are pointing down into ~ July 20th, maybe into ~ Aug 23 time frame. Astro is pretty bearish looking to me, into July 20th, then starts to improve, and Sept. looks pretty good. Sept is statistically I believe the worst month of the year. So if we have a good month, it would get the bulls excited again.
Still agnostic leaning to the bear side.
Tweets
If a Big C down has started, it should start with a bit of emphasis, today is fine. On this chart I am following two possible fractals, which are caused by two separate waves, of similar internal structure. A bit tricky it is. ??? remain until later. The TL needs to break first of all. The market being the market a bottom and rebound just enuff to keep us guessing seems likely at this point.
The AD in the comp is terrible. Went no where during this last move up.
Part of the reason for the comp is that the fractals stand out a bit better than in the Spx. But in both cases they are present. The structure is a 333 for an a, and a 5 for the c, to get the B. The 333 imo is a leading diagonal type thing, a type of triangle. With overlap of course.
What would negate this count, a big ramp would do it.
 |
|


