| | | Hi RB,
Seasons greetings and a Happy New Year to you & yours!!
"I think you are underestimating the extent of the melt up"
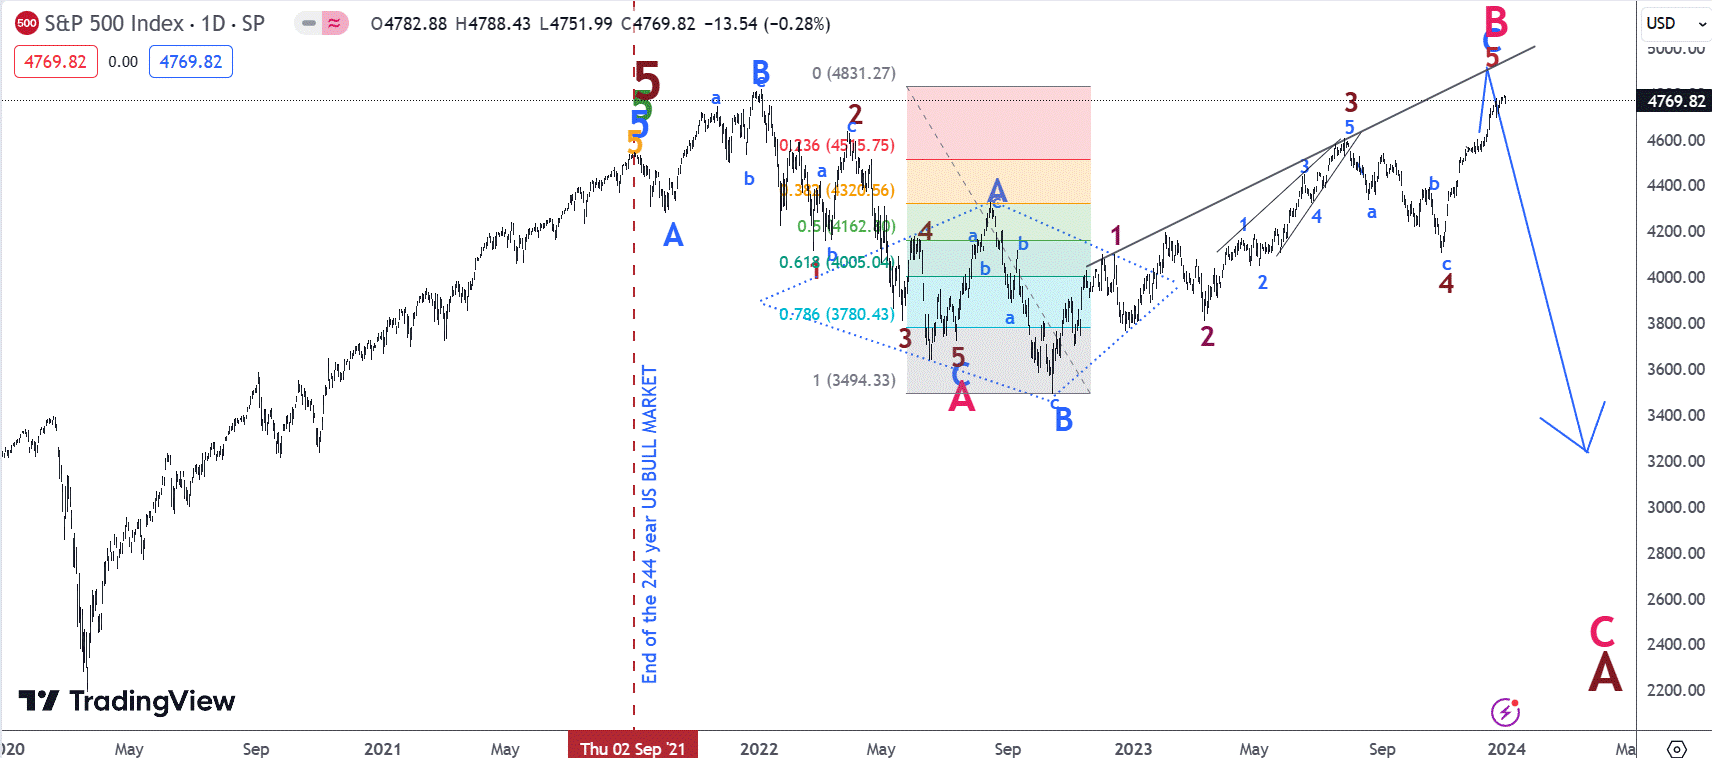
I believe the "melt up" is in the rear view mirror, with the final portion occurring from March 23rd 2020 thru September 2nd 2021, when the SPX rallied from 2192 to 4546 as seen in the chart below. I don't think a PENNY STOCK style 4X melt-up in a few months is possible with such an esteemed index.
The wave count rally limitations are contained in this rule:
"Wave C must be less than twice the longest of Waves A and B, including internal points of Wave C."
As seen on Page 4 containing FLAT RULES here:
New Microsoft Word Document _2_ (forex-indicators.net)
The height of the Red B rally in the chart below is limited by the size of Blue B, such that Blue C may not exceed twice the length of Blue B (I have obviously designated Red B as an expanded flat). Blue B's length is 4325.28 - 3491.58, or 833.70. So wave C of Red B can be no longer than 1667.4, Yielding a maximum ceiling of 5158.98.
With the 2022 Diamond reversal target still in place at 4839, and this new pennant reversal target at 4914, I have serious doubts 5000 could be pierced. In fact, the potential reward is not worth the risk as we go much higher from the current 4770, IMHO.
 |
|


