| | | Tesla ...... been following it for a possible buy in. Stayed away so far. Kind of on a similar path as what some of you are.
Everything I do is increasingly being driven by cycles, since I do a bit longer term than many of you.
Tesla is too short of a chart to conclude much, so a work in progress. If one is looking for longer intermediate term cycles they would normally look in the 4 to 4.5 yr range give or take a bit, then the 8 to 9, give or take a bit. Good starting points.
A few cycle anals I have followed believe in a 3.5 and 7 year cycle, and yes imo it does show up. Seems to be the stronger cycle in Tesla right now, to me anyway. But often remnants of the 4 plus year cycle show up too, I call it modulation, it increases the complexity.
I read Chuck Yeager's biography. He had excellent eye sight, in particular far out. In WWII he would specially try to look far out, almost always spotted the other side before anyone else. Way before. Secret to cycles imo is to look way out, then gradually hone in. Time consuming, have to be imaginary too. Can near drive ya batty.
Tweets
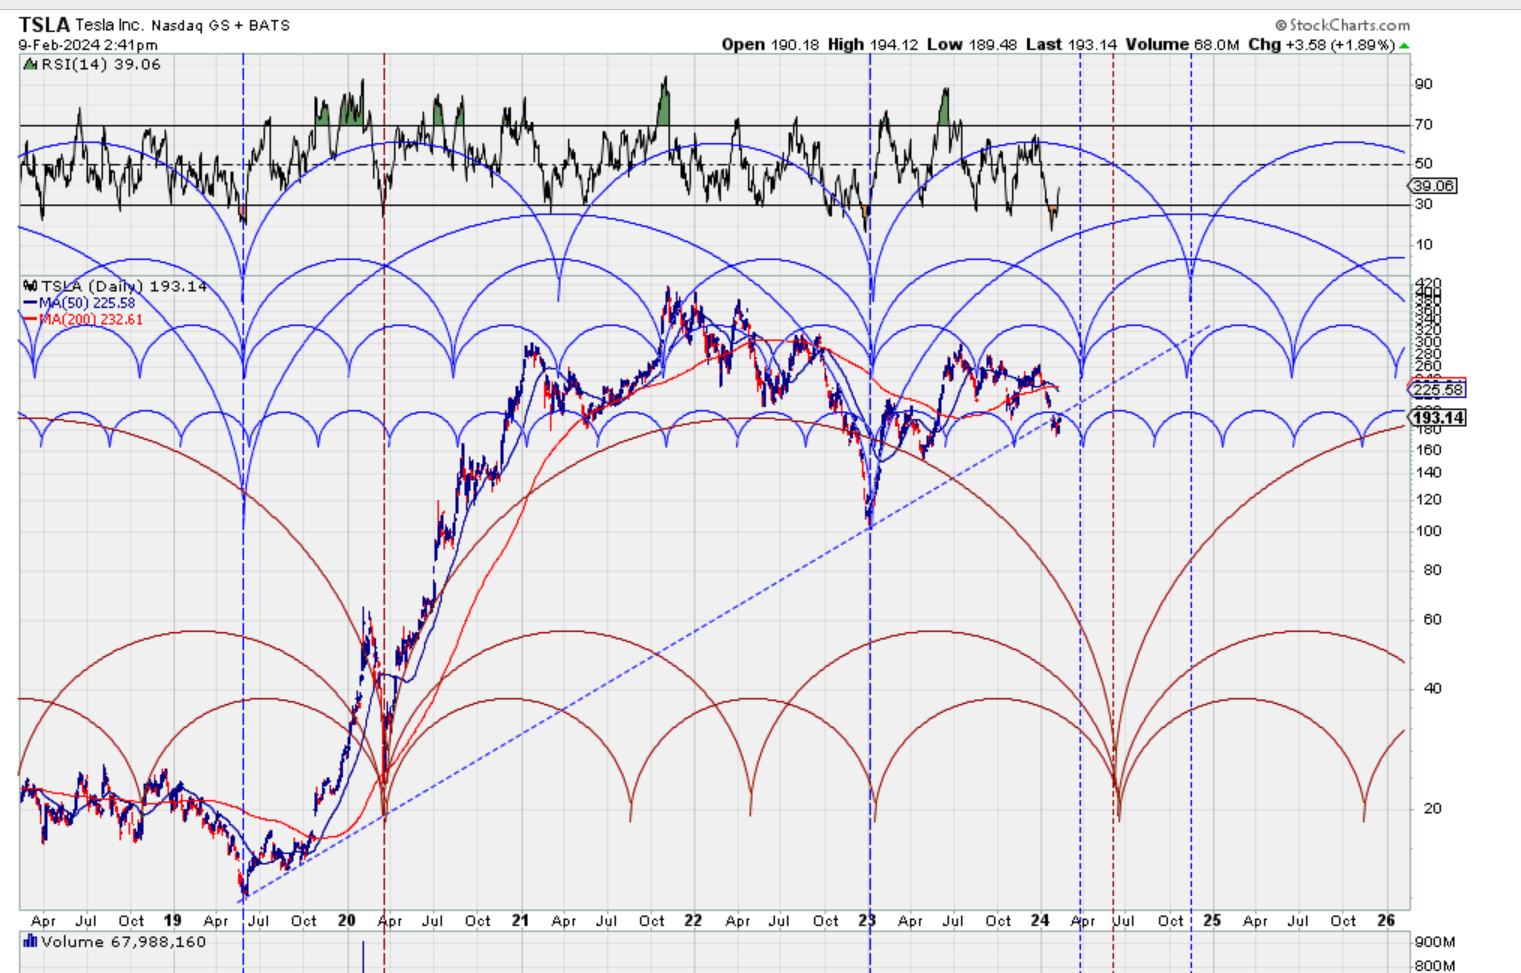
Looks like a bunch of crap maybe. The blue are 3.5 and 7 yr cycles and possible sub cycles, near exact. The red are the ~ 4.5 yr and 9 yr, and sub cycles. Fwiw I think the next big market awa Tesla top should occur around 2027, 27 years or 3 times 9 yrs, post the 2000 top.
Anyway possible cycle bottom around first of April, this is showing up on other charts I am following. Or maybe a bit later at the red loop bottom ... thinking this could be a higher low here.
Unless the bottom falls out, the waves are complicated. Biggest issue for EV's right now is probably the price of gasoline, more so than irates.
And a thot is that when we have two major longer term cycles bottoming near one another, might have a powerful bottom.
 |
|


