<<The fraud that you are dealing with is Plimer.>>
Ever since the words "Lock step" were announced during the training exercise "Event201"
Event 201 | Johns Hopkins Center for Health Security
We have known for sure that much of the data we see is "lock stepped" through all normal media sources and this includes "Climate Change" investigative projects imho.
Plimer may be wrong, perhaps he is strongly arguing his corner in support of the Australian Mining Business? The mining community, whose welfare depend on the mining activity, they may well be vocal critics of the Climate Change synopsis, simply because it may be biased or wrong.
I think it's fair to call Climate Change research an "Agenda", as all they seem do is look for proof to strengthen their case instead of conducting an objective inquiry.
Your term "fraud" reflects this fashion, as that is all it is. .
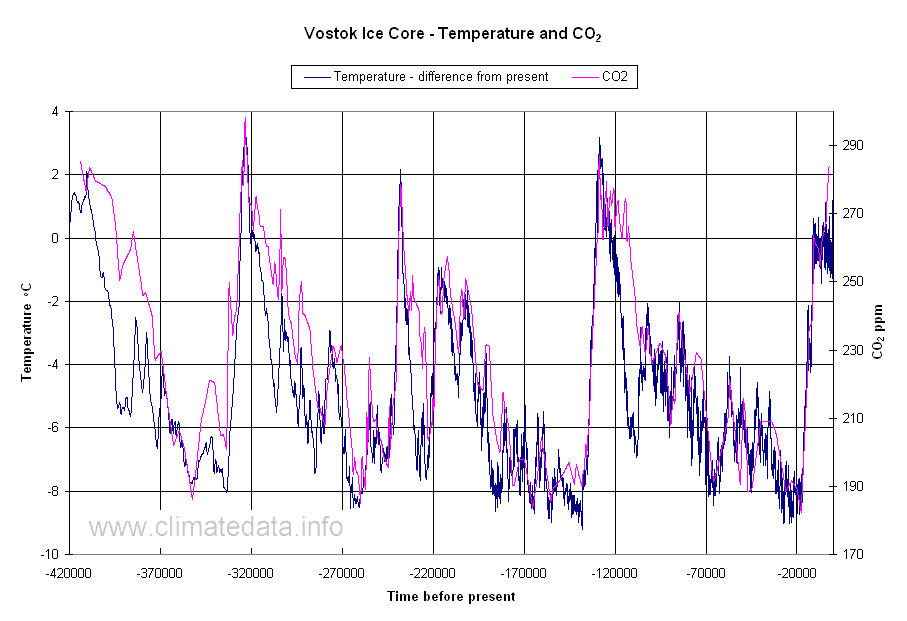
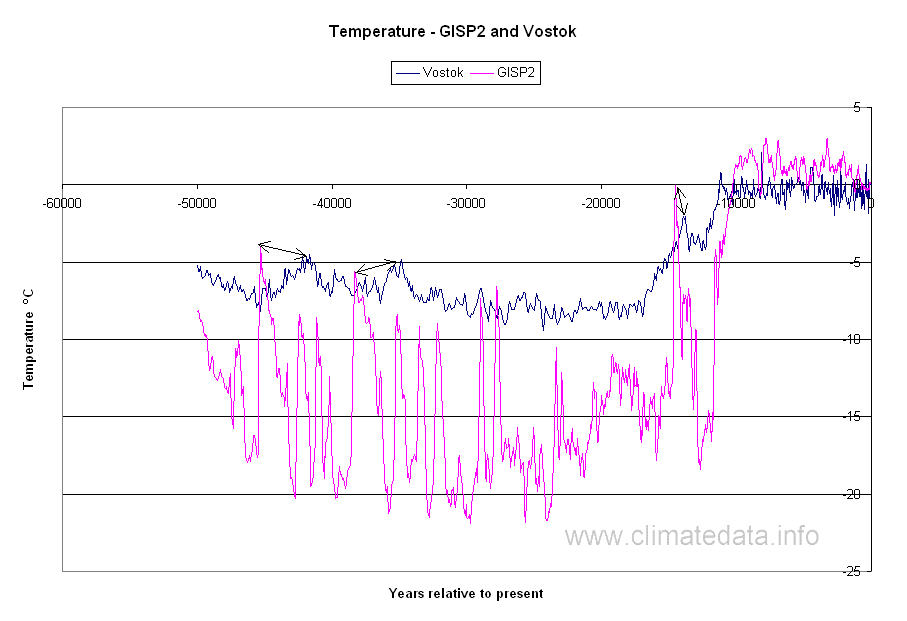
Anyway, all data obtained through official sources is suspect as far as I am concerned and this makes things difficult. When one graph says one thing and another shows the opposite, for no apparent reason, it really is galling. I am genuinely interested in what the temperature is really doing. Going back over previous messages I came across these charts of the Ice Cores in question.
Ice Core Data for Antarctic and Arctic (climatedata.info)
here is a little quote. (my emboldment)
AntarcticaThe deepest ice, and therefore the ice with the longest record, is found in Antarctica. As the ice in Antarctica is mostly over land, as opposed to the Arctic where most of the ice is floating on sea, this makes it ideal for deep core sampling. EPICA is the deepest of the ice cores and it also goes farthest back in time. Figure 2 shows the temperature and radiation data as calculated from the Milankovitch cycles. As can be seen, there is good agreement between the timing of orbital cycles and the temperature changes. It is also noticeable that there is a tendency for times of higher radiation to be associated with higher temperature but the correspondence is far from perfect. Figure 3 shows temperature and CO2. As can be seen, there is close correspondence in the timing and relative magnitude of the two variables. Although not clear from this chart there is general agreement that temperature changes precede CO2 changes during the rising phase and CO2 lags temperature by a larger amount during the falling phase. Figure 4 and Figure 5 show similar relationships for the Vostok ice core (note: EPICA ad Vostok are both in the Antarctic).

Looking at all the charts though, for the past 800,000 years we have not seen CO2 in the 400 ppm range, and that has to be disquieting. I would agree on that point. In no way is that a reason to panic and enact draconian legislation on the Western world and the suppression of free speech. Free speech and dissent should be encouraged in fact. That is how real science works.


Formerly About Advanced Micro Devices Message Board - Msg: 34587135 (siliconinvestor.com)
 |


