 |
 |  |
| We've detected that you're using an ad content blocking browser plug-in or feature. Ads provide a critical source of revenue to the continued operation of Silicon Investor. We ask that you disable ad blocking while on Silicon Investor in the best interests of our community. If you are not using an ad blocker but are still receiving this message, make sure your browser's tracking protection is set to the 'standard' level. |
| Politics : Rat's Nest - Chronicles of Collapse |
| Public ReplyPrvt ReplyMark as Last ReadFile | Previous 10Next 10PreviousNext |
| ||||||||||||||||||||||||||||||||||||||||||||||||||||||||||||||||||||||||||||||||||||||||||||||||||||
| ||||||||||||||||||||||||||||||||||||||||||||||||||||||||||||||||||||||||||||||||||||||||||||||||||||
| Public ReplyPrvt ReplyMark as Last ReadFile | Previous 10Next 10PreviousNext |
| Home | Hot | SubjectMarks | PeopleMarks | Keepers | Settings |
| Terms Of Use | Contact Us | Copyright/IP Policy | Privacy Policy | About Us | FAQ | Advertise on SI |
| © 2025 Knight Sac Media. Data provided by Twelve Data, Alpha Vantage, and CityFALCON News |


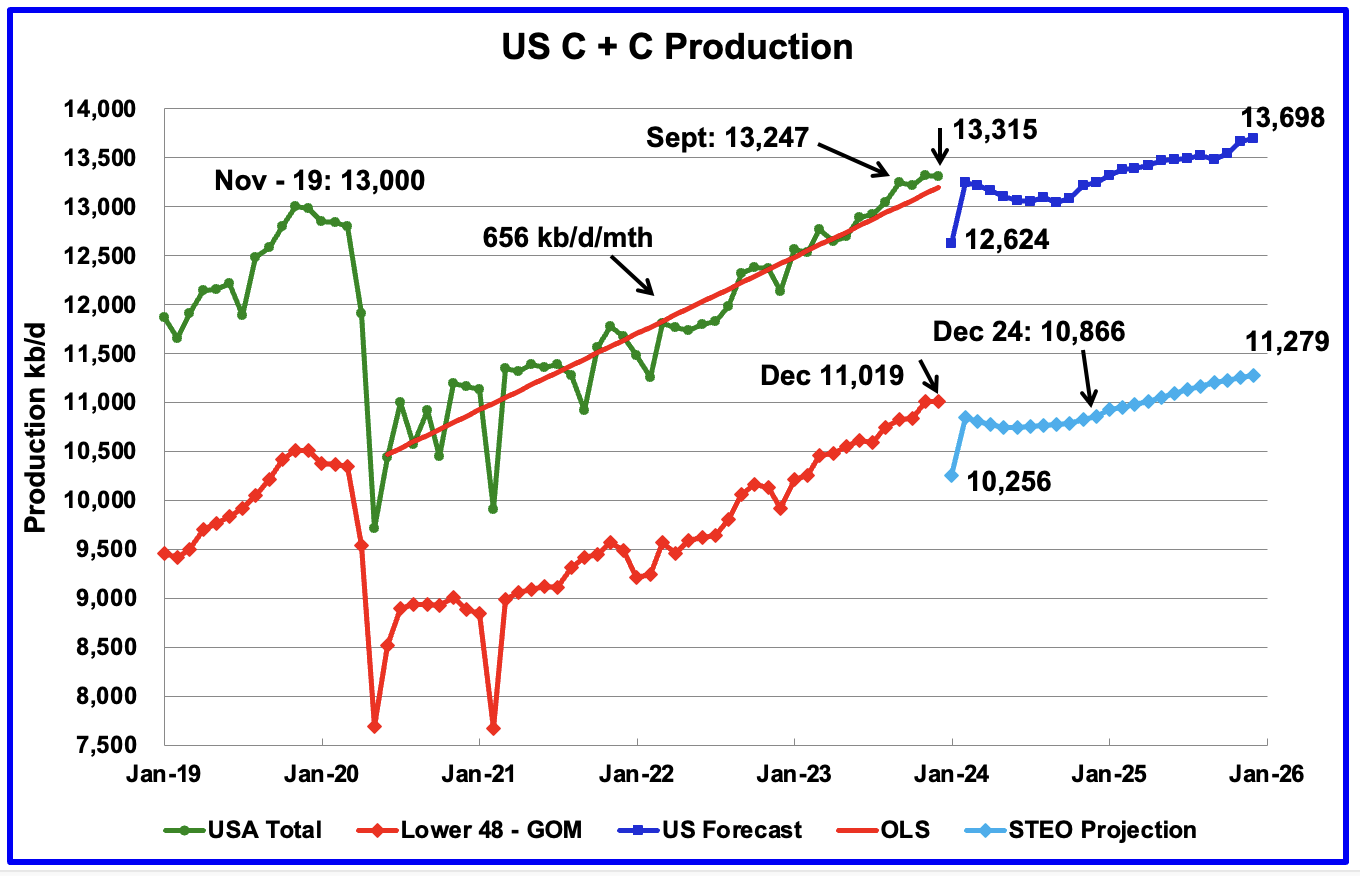
 U.S. December oil production decreased by 4 kb/d to 13,315 kb/d. The small decrease was a mix of increases and decreases that netted out to a negligible decrease. The largest decrease came from Texas, 20 kb/d, offset by a New Mexico increase of 23 kb/d.