West Red Lake Gold Highlights New Exploration Targets at Rowan Property
westredlakegold.com
April 15, 2025
West Red Lake Gold Mines Ltd. (“West Red Lake Gold” or “WRLG” or the “Company”) (TSXV: WRLG) (OTCQB: WRLGF) is pleased to announce positive results from the 2024 regional surface mapping, geochemical sampling and core re-logging program (the “Program”) at its 100% owned Rowan Property located in the Red Lake Gold District of Northwestern Ontario, Canada.
HIGHLIGHTS:
- The Program at Rowan in 2024 consisted of a diamond drill core re-logging and sampling program, expansion of the 2023 till sampling grid, and compilation of a new deposit-scale 3D geologic model to enhance targeting of favorable structural and lithologic settings for gold mineralization at Rowan.
- The re-logging program included 50 diamond drill holes for a total of 16,830 meters (“m”) of drill core – this core was predominately from historic drilling campaigns (Figure 2). A total of 3,070 samples were collected over 4,604m of core to fill analytical gaps in the historic data set and update mineralized domains at Rowan.
- A total of 984 till samples were collected in 2024 with an emphasis on prospective geology and interpreted structural trends that are believed to be important controls for gold mineralization at Rowan. This was in addition to the 344 till samples collected during 2023 (Figure 3).
- Geochemical data from 2023-2024 till sampling campaigns were integrated to refine what is interpreted to be the main mineralized structural trend at Rowan, which has been folded and conforms to a regional-scale east verging antiform (Figure 1). This structural trend is constrained geochemically by strong potassic (“K”) alteration and Ag-Cd-Zn loading. Visible gold in drill core at Rowan is often associated with the presence of sphalerite (Zn-sulphide).
- Two (2) new till anomalies were defined at Rowan that also align spatially with deflections and folding in the main regional shear. These two newly defined target areas have seen very little previous drilling. The areas immediately northeast and southwest along strike from the main Rowan deposit, and the Mount Jamie area also remain highly prospective for expansion and discovery potential.
Will Robinson, Vice President of Exploration, stated, “The 2024 exploration program at Rowan achieved a number of key objectives in advancing our understanding of the geological controls on mineralization in this part of the Red Lake District. We now have a succinct and systematic logging convention for Rowan to pair with a high-confidence and detailed deposit-scale 3D geologic model, which will prove invaluable for targeting and data processing in future drilling programs. Many of the common themes we see at Madsen associated with gold are also present at Rowan, which further substantiates our regional targeting model. The till sampling program was highly successful in mapping out the footprint of the main controlling mineralized shear at Rowan, while also defining two high caliber gold-in-till anomalies at Big Bend and Apex. Inflections and folds in mineralized shears are great places to look for high-grade gold and we are excited to test these new targets with future drilling campaigns.”
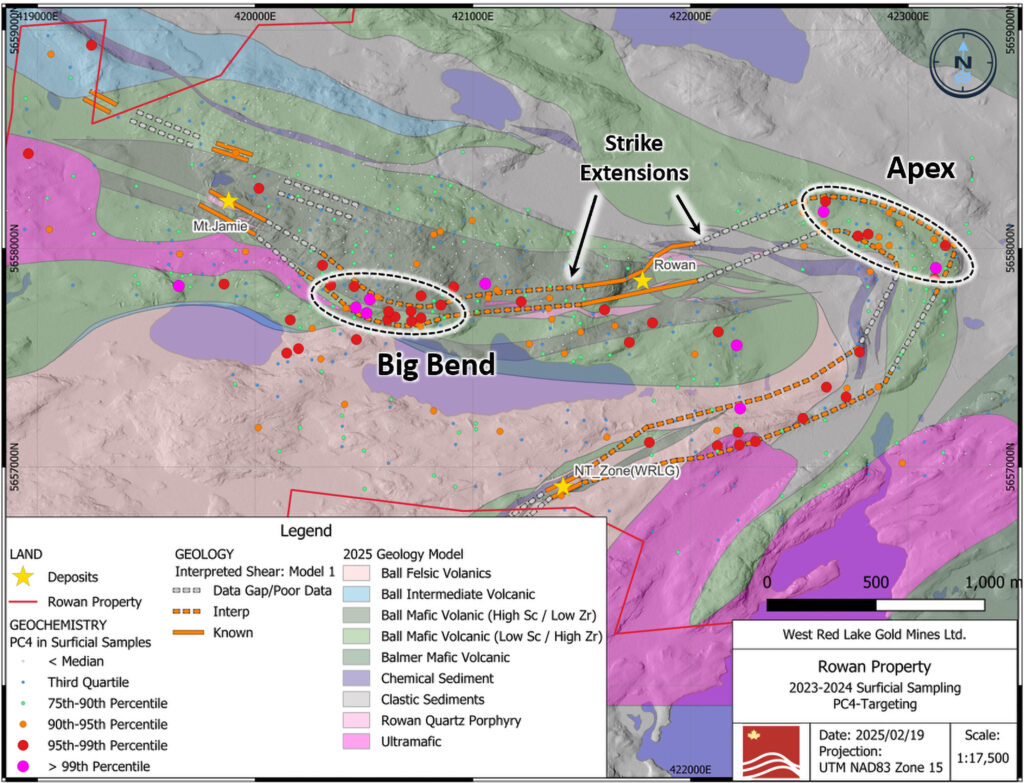
Figure 1. Map showing new target areas defined through 2023-2024 surface till sampling and characterized by strong K-alteration and Ag-Cd-Zn loading. The areas immediately northeast and southwest of the main Rowan deposit remain high-priority expansion targets.
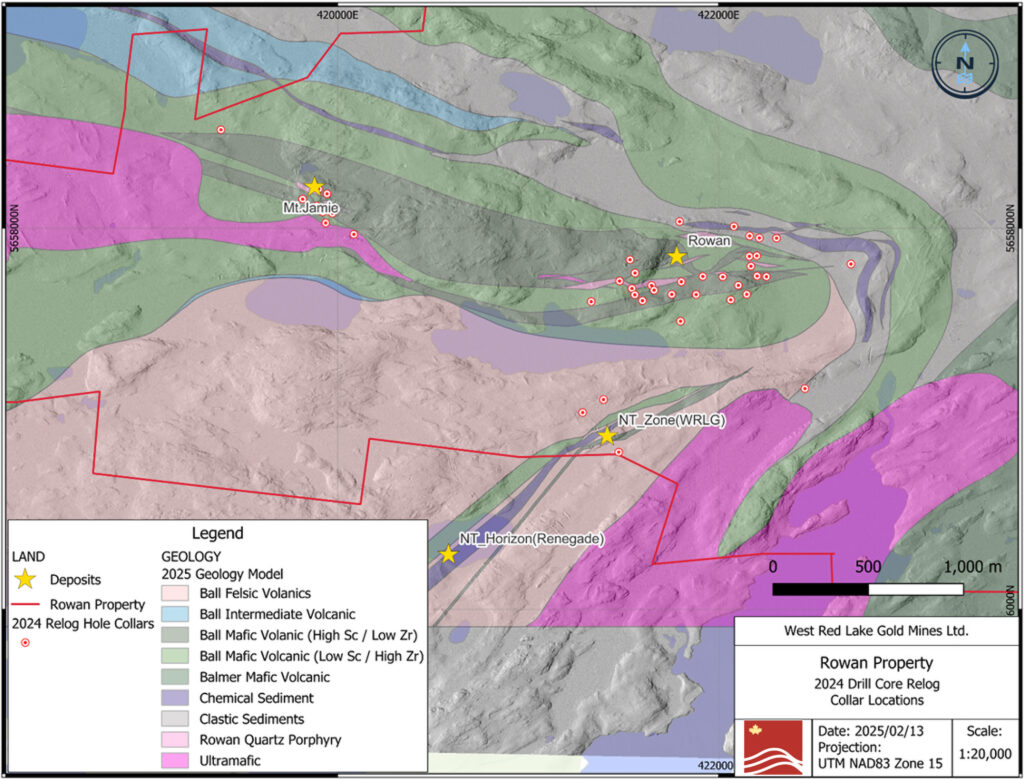 Figure 2. Map showing location of drill collars for re-logged holes relative to known gold deposits and mineral occurrences. Newly interpreted 2025 geology map shown as underlay. Figure 2. Map showing location of drill collars for re-logged holes relative to known gold deposits and mineral occurrences. Newly interpreted 2025 geology map shown as underlay.
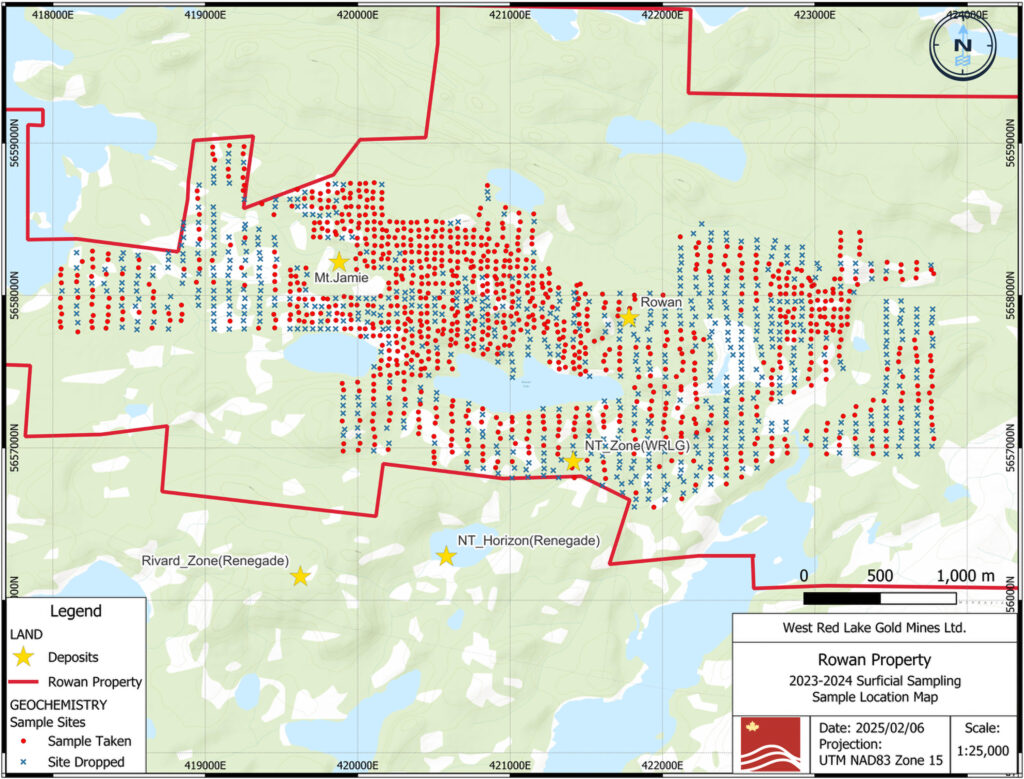 Figure 3. Map showing location of 2023-2024 till sampling grid with sampled and non-sampled sites displayed. Non-sampled sites were due to lack of viable sample material and/or swampy terrain. Figure 3. Map showing location of 2023-2024 till sampling grid with sampled and non-sampled sites displayed. Non-sampled sites were due to lack of viable sample material and/or swampy terrain.
DISCUSSION
Drill Core Re-logging and Sampling Program
The re-logging program included 50 diamond drill holes for a total of 16,830m of drill core – this core was predominately from historic drilling campaigns from Rowan, Mount Jamie, Red Summit and the NT Zone (Table 1). A total of 3,070 samples were collected over 4,604m of core to fill analytical gaps in the historic data set and update mineralized domains at Rowan. Sample preparation and gold analysis were conducted at SGS in Red Lake, subsequent to which the master analytical pulps were picked up by WRLG contract employees and transported to ALS Minerals in Thunder Bay for multi-element ICP analysis.
Table 1. Summary of drill holes, primary samples and QAQC samples from 2024 Rowan re-logging and sampling program.
| Hole ID | Target Area | Hole Depth (m) | Meters Sampled | No. Samples | CRMs | Blanks | Field Dup’s | Prep Dup’s | | | HYR-07-01 | Strat Interp. | 575 | 0 | 0 | 0 | 0 | 0 | 0 |
| | RLG-22-125 | Strat Interp. | 300 | 0 | 0 | 0 | 0 | 0 | 0 | | | HY-07-09 | Mount Jamie | 155 | 92.3 | 55 | 2 | 2 | 1 | 1 | | | HY-07-10 | Mount Jamie | 101 | 49.8 | 28 | 1 | 1 | 1 | 0 | | | HY-07-13 | Mount Jamie | 152 | 98.7 | 59 | 2 | 2 | 1 | 1 | | | HY-07-14 | Mount Jamie | 152 | 115.8 | 76 | 3 | 3 | 1 | 1 | | | HY-07-35 | Mount Jamie | 300 | 35.6 | 20 | 0 | 1 | 0 | 1 | | | HY-07-38 | Mount Jamie | 360 | 80.55 | 42 | 2 | 1 | 1 | 1 | | | MJ-17-01 | Mount Jamie | 108 | 0 | 0 | 0 | 0 | 0 | 0 | | | MJ-17-02 | Mount Jamie | 102 | 0 | 0 | 0 | 0 | 0 | 0 | | | MJ-17-08 | Mount Jamie | 141 | 60.3 | 38 | 2 | 1 | 0 | 1 | | | MJ-17-11 | Mount Jamie | 201 | 61.4 | 39 | 1 | 2 | 1 | 0 | | | MJ-17-13 | Mount Jamie | 108 | 42.2 | 26 | 1 | 1 | 1 | 0 | | | RLG-19-70 | NT Zone | 273 | 0 | 0 | 0 | 0 | 0 | 0 | | | RLG-19-72 | NT Zone | 327 | 0 | 0 | 0 | 0 | 0 | 0 | | | RLG-22-119 | NT Zone | 339 | 0 | 0 | 0 | 0 | 0 | 0 | | | RLG-23-128 | Red Summit | 408 | 0 | 0 | 0 | 0 | 0 | 0 | | | RLG-15-24 | Fold Hinge | 396 | 0 | 0 | 0 | 0 | 0 | 0 | | | HYR-07-02 | Rowan | 350 | 115.5 | 72 | 2 | 3 | 2 | 1 | | | HYR-07-03 | Rowan | 475 | 262.1 | 146 | 5 | 6 | 3 | 2 | | | HYR-07-04 | Rowan | 336 | 218 | 136 | 5 | 5 | 3 | 3 | | | HYR-07-06 | Rowan | 528 | 152.4 | 95 | 4 | 3 | 2 | 2 | | | HYR-07-07 | Rowan | 650 | 217.8 | 139 | 5 | 5 | 3 | 2 | | | RLG-14-011 | Rowan | 90 | 23.1 | 16 | 1 | 0 | 0 | 1 | | | RLG-14-013 | Rowan | 141 | 0 | 0 | 0 | 0 | 0 | 0 | | | RLG-14-014 | Rowan | 216 | 46.25 | 30 | 1 | 1 | 1 | 1 | | | RLG-14-015 | Rowan | 240 | 30 | 16 | 1 | 0 | 0 | 0 | | | RLG-14-018 | Rowan | 153 | 19 | 10 | 0 | 1 | 0 | 0 | | | RLG-15-019 | Rowan | 300 | 187.1 | 114 | 5 | 4 | 2 | 2 | | | RLG-15-020 | Rowan | 261 | 208 | 127 | 5 | 5 | 2 | 2 | | | RLG-16-034 | Rowan | 465 | 353.25 | 316 | 11 | 12 | 3 | 9 | | | RLG-16-035 | Rowan | 351 | 288.7 | 242 | 8 | 9 | 6 | 3 | | | RLG-16-036 | Rowan | 474 | 181.55 | 116 | 4 | 4 | 3 | 2 | | | RLG-16-037 | Rowan | 275 | 236.3 | 170 | 6 | 7 | 3 | 2 | | | RLG-16-038 | Rowan | 355 | 93.8 | 66 | 2 | 3 | 1 | 1 | | | RLG-16-039 | Rowan | 150 | 54.1 | 34 | 2 | 1 | 1 | 0 | | | RLG-17-045 | Rowan | 357 | 251.2 | 180 | 6 | 7 | 3 | 3 | | | RLG-17-046 | Rowan | 433 | 161.8 | 99 | 4 | 4 | 1 | 2 | | | RLG-17-047 | Rowan | 405 | 307.9 | 218 | 9 | 8 | 5 | 3 | | | RLG-17-048 | Rowan | 522 | 144 | 99 | 4 | 3 | 2 | 2 | | | RLG-17-050 | Rowan | 600 | 108.64 | 66 | 2 | 3 | 1 | 2 | | | RLG-17-051 | Rowan | 650 | 143.04 | 93 | 3 | 4 | 1 | 2 | | | RLG-17-052 | Rowan | 351 | 163.88 | 96 | 3 | 4 | 2 | 1 | | | RLG-21-109 | Rowan | 486 | 0 | 0 | 0 | 0 | 0 | 0 | | | RLG-23-157 | Rowan | 471 | 0 | 0 | 0 | 0 | 0 | 0 | | | RLG-23-159 | Rowan | 351 | 0 | 0 | 0 | 0 | 0 | 0 | | | RLG-23-172 | Rowan | 708 | 0 | 0 | 0 | 0 | 0 | 0 | | | RLG-23-175 | Rowan | 447 | 0 | 0 | 0 | 0 | 0 | 0 | | | RLG-23-177 | Rowan | 432 | 0 | 0 | 0 | 0 | 0 | 0 | | | RLG-23-184 | Rowan | 309 | 0 | 0 | 0 | 0 | 0 | 0 | | | Total | 16,830 | 4,604.06 | 3,079 | 112 | 116 | 57 | 54 |
Till Sampling Program
A total of 1,328 till samples (exclusive of duplicates) were taken by contracted field personnel between both phases of surficial sampling on the Rowan property in 2023 and 2024. Of these 1,328 samples, 984 were prepared in the lab with a -63 µm passing sieve, whereas the remaining samples were sieved to the -180+63 µm fractions size. The average sample weight received at the lab was 1.75 kg, with a following average weight of 245 g of sample material passing the -63µm fraction screen during preparation. Of the 984 field samples, 12 returned with insufficient material for analysis (“NSS”). These NSS samples had an average receival weight of 1.39 kg, but a post screen average weight of 36.07 grams. A review of sample commentary and field data shows that these 12 samples were taken either in sand rich till, or over shallow subcrop with low volumes of the appropriate sample medium. With a required nominal weight of 50 g required for the AuME-ST44™ analysis method, field sampling protocols are deemed adequate to ensure the required volume of material has been collected. At a failure rate of 1.2 %, this is deemed to be within acceptable tolerance for sample collection.
QUALITY ASSURANCE/QUALITY CONTROL
The Rowan Mine deposit presently hosts a National Instrument 43-101 – Standards of Disclosure for Mineral Projects (“NI 43-101”) Indicated resource of 195,746 ounces (“oz”) of gold grading 12.78 g/t Au and an Inferred resource of 115,719 oz of gold grading 8.76 g/t Au. Mineral resources are estimated at a cut-off grade of 3.80 g/t Au and a gold price of US$1,800/oz. Mineral resources that are not mineral reserves do not have demonstrated economic viability. Please refer to the technical report entitled “Technical Report on The Updated Mineral Resource Estimate for The Rowan Property, Ontario, Canada”, prepared by SIMS Resources LLC and dated April 26, 2024 (the “Rowan Report”). The Rowan Mine Resource Estimate has an effective date of March 1, 2024. A full copy of the Rowan Report is available on the Company’s website and on SEDAR+ at www.sedarplus.ca.
The technical information presented in this news release has been reviewed and approved by Will Robinson, P.Geo., Vice President of Exploration for West Red Lake Gold and the Qualified Person for exploration at the West Red Lake Project, as defined by NI 43-101 “Standards of Disclosure for Mineral Projects”.
ABOUT WEST RED LAKE GOLD MINES
West Red Lake Gold Mines Ltd. is a mineral exploration company that is publicly traded and focused on advancing and developing its flagship Madsen Gold Mine and the associated 47 km2 highly prospective land package in the Red Lake district of Ontario. The highly productive Red Lake Gold District of Northwest Ontario, Canada has yielded over 30 million ounces of gold from high-grade zones and hosts some of the world’s richest gold deposits. WRLG also holds the wholly owned Rowan Property in Red Lake, with an expansive property position covering 31 km2 including three past producing gold mines – Rowan, Mount Jamie, and Red Summit.
ON BEHALF OF WEST RED LAKE GOLD MINES LTD.
“Shane Williams”
Shane Williams
President & Chief Executive Officer
FOR FURTHER INFORMATION, PLEASE CONTACT:
Gwen Preston
Vice President Communications
Tel: (604) 609-6132
Email: investors@wrgold.com or visit the Company’s website at westredlakegold.com
Neither the TSX Venture Exchange nor its Regulation Services Provider (as that term is defined in the policies of the TSX Venture Exchange) accepts responsibility for the adequacy or accuracy of this release.
CAUTIONARY STATEMENT AND FORWARD-LOOKING INFORMATION
Certain statements contained in this news release may constitute “forward-looking information” within the meaning of applicable securities laws. Forward-looking information generally can be identified by words such as “anticipate”, “expect”, “estimate”, “forecast”, “planned”, and similar expressions suggesting future outcomes or events. Forward-looking information is based on current expectations of management; however, it is subject to known and unknown risks, uncertainties and other factors that may cause actual results to differ materially from the forward-looking information in this news release and include without limitation, statements relating to the potential for mineralization in the Red Lake district, the anticipated value of the dataset for advancing targets on the Rowan property, and all other plans for the potential restart of mining operations at the Madsen Mine, the potential of the Madsen Mine; any untapped growth potential in the Madsen deposit or Rowan deposit; and the Company’s future objectives and plans. Readers are cautioned not to place undue reliance on forward-looking information.
Forward-looking information involve numerous risks and uncertainties and actual results might differ materially from results suggested in any forward-looking information. These risks and uncertainties include, among other things, risks associated with mineral exploration and development activities, environmental risks, market volatility; the state of the financial markets for the Company’s securities; fluctuations in commodity prices; timing and results of the cleanup and recovery at the Madsen Mine; and changes in the Company’s business plans. Forward-looking information is based on a number of key expectations and assumptions, including without limitation, that the Company will continue with its stated business objectives and its ability to raise additional capital to proceed. Although management of the Company has attempted to identify important factors that could cause actual results to differ materially from those contained in forward-looking information, there may be other factors that cause results not to be as anticipated, estimated or intended. There can be no assurance that such forward-looking information will prove to be accurate, as actual results and future events could differ materially from those anticipated in such forward-looking information. Accordingly, readers should not place undue reliance on forward-looking information. Readers are cautioned that reliance on such information may not be appropriate for other purposes. Additional information about risks and uncertainties is contained in the Company’s management’s discussion and analysis for the year ended November 30, 2023, and the Company’s annual information form for the year ended November 30, 2023, copies of which are available on SEDAR+ at www.sedarplus.ca.
The forward-looking information contained herein is expressly qualified in its entirety by this cautionary statement. Forward-looking information reflects management’s current beliefs and is based on information currently available to the Company. The forward-looking information is made as of the date of this news release and the Company assumes no obligation to update or revise such information to reflect new events or circumstances, except as may be required by applicable law.
For more information on the Company, investors should review the Company’s continuous disclosure filings that are available on SEDAR+ at www.sedarplus.ca. |


