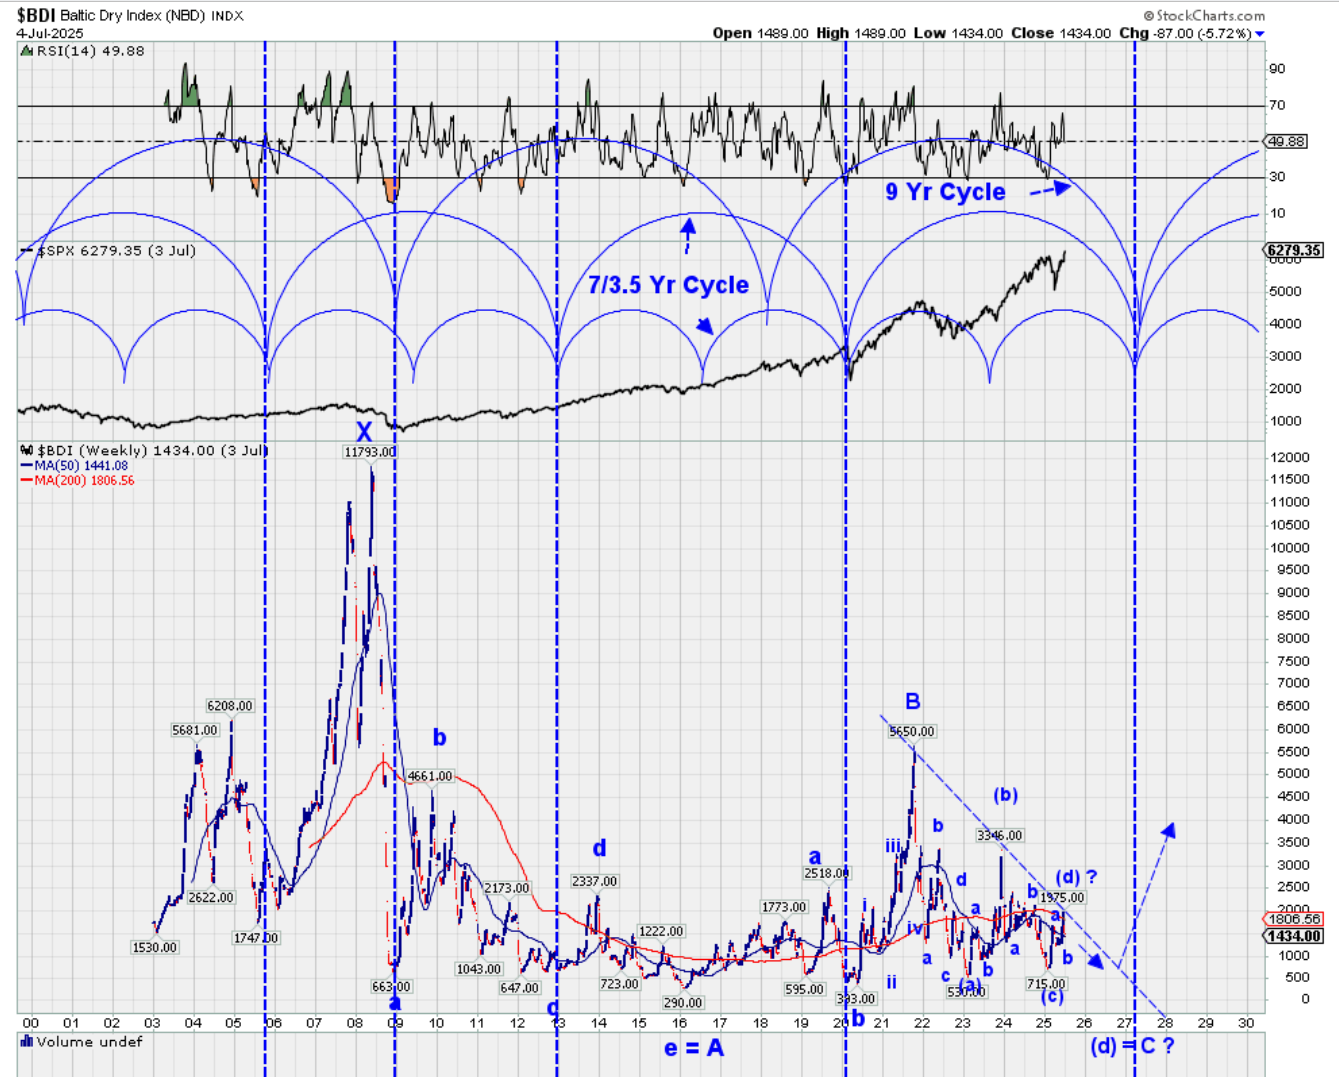
| | | The $BDI at an interesting juncture. Something for you and nw to constructively discuss?
Opportunities come around every so often, it pays to be patient as heck, and get the timing right. And maybe have a bit of luck along the way. The timing part can really be difficult.
I have been tracking/stalking the BDI for a few years here now.
Tweets
- The last big move in the BDI happened very late cycle, w/r to general market cycles. We are getting along down the road in this general market cycle, looks like a possible repeat setting up.
- The first A down is an abcde triangle. The B up was a fake out.
- Since the top of the B, it sort of looks like a possible abcde triangle again, if so this would be an ending diagonal triangle. So what we have going on is kind of fractal of the previous move down, which are not uncommon. Prechter often talks about fractals.
- For this to remain valid, the BDI has to trend down here, from the putative (d). And if that happens, we could get a slightly higher low relative to the (c), awa a probable early ending. The triangle looks to be slightly contracting. And then the BDI would take off, probably head to a new ATH.
- GLBS still trending down, watching all this with keen interest, and lots of patience.
- Afa cycles I have a primary cycle of about 7 yrs, nothing unusual, it shows up in things. A possible secondary 9 yr cycle, what is especially interesting is they meet at a common low about end of 2026. When that happens it is usually a bullish low. And the ending would be about 18 yrs (2 X 9) post the 2009 bottom. Awa 7 yrs post the 2020 bottom.
- Again I do not do options, but there is also the BDRY which roughly tracks the BDI index. It would do very well IF this scenario comes to fruition.
- It is possible the (c) marked the wave bottom, but right now I favor what is shown.
- Note an intriguing feature of the whole chart, not a lot of overhead on the way to the upside.
 |
|


