Charted: Global Gold Production by Region
September 10, 2025
By Niccolo Conte
Article/Editing:Graphics/Design:
See this visualization first on the Voronoi app.

Use This Visualization
Visualizing Gold Production by RegionThis was originally posted on our Voronoi app. Download the app for free on iOS or Android and discover incredible data-driven charts from a variety of trusted sources.
Key Takeaways- Africa leads with 1,010 tonnes of gold, driven by Ghana, Mali, and South Africa.
- China (380t) and Russia (330t) are the world’s top national producers.
- Australia (284t) stands as the largest Western producer.
Gold remains one of the world’s most valuable natural resources, central to everything from central bank reserves to jewelry and electronics.
During 2025, the yellow metal set multiple price records, driven by a soft dollar, strong central bank buying and heightened global uncertainty.
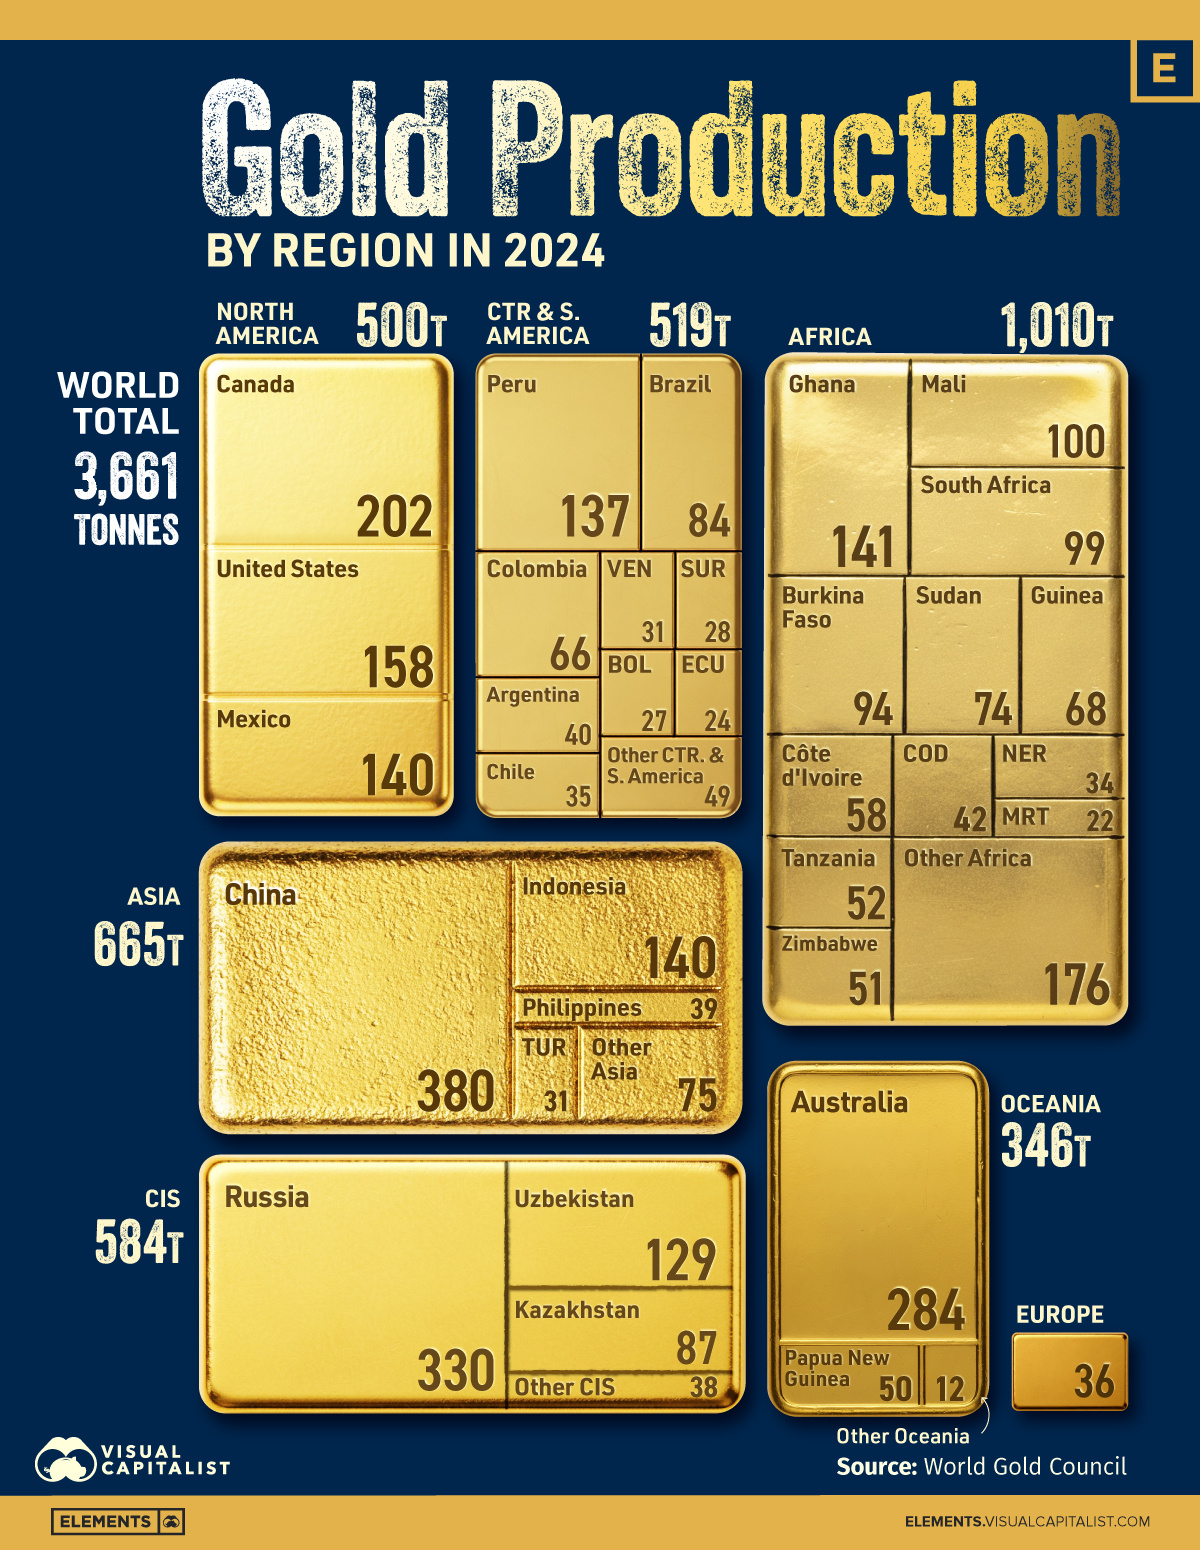
This visualization breaks down global gold production by region in 2024, spotlighting the top-producing countries and their contributions to the region supply landscape. The data for this visualization comes from the World Gold Council.
Africa Leads Global Output
Africa is the world’s top gold-producing region, generating 1,010 tonnes in 2023. Ghana leads the continent with 141 tonnes, followed by Mali (100 tonnes) and South Africa (99 tonnes).
RegionProduction (tonnes)Largest Contributors|
| Africa | 1,010 | Ghana (141), Mali (100), South Africa (99) | | Asia | 665 | China (380), Indonesia (140) | | CIS | 584 | Russia (330), Uzbekistan (129) | | North America | 500 | Canada (202), U.S. (158), Mexico (140) | | Central & South America | 519 | Peru (137), Brazil (84), Colombia (66) | | Oceania | 346 | Australia (284), Papua New Guinea (50) | | Europe | 36 | |
This dominance reflects the continent’s vast mineral resources, though political and operational challenges continue to affect output in some areas.
China, Russia, and Australia Dominate Nationally
China remains the top national producer with 380 tonnes, followed by Russia at 330 tonnes. These two countries alone account for almost 20% of global output.
Australia follows with 284 tonnes, making it the leading Western gold producer and a cornerstone of Oceania’s 346-tonne total.
The Americas Remain Strong Contributors
North America produced 500 tonnes in 2023, driven by Canada (202 tonnes), the United States (158 tonnes), and Mexico (140 tonnes).
Central and South America added 519 tonnes, led by Peru (137 tonnes), Brazil (84 tonnes), and Colombia (66 tonnes). Combined, the Americas contribute more than one-fifth of global supply. |


