Extreme Temperature Diary- Wednesday September 10th, 2025/Main Topic: Just How Accurate Are Long Term Temperature Records? – Guy On Climate
Dear Diary. One climate denialist trope is to charge climate scientists with manipulating temperature data to make it appear that there is a long-term warming trend. Those charges intersect with my findings that show more warm records being set with time instead of record chill. I have to snicker though because my database employs thousands of individual weather stations. They can’t all be manipulated. All stations go through rigorous testing to see if temperature measurements coming from them are calibrated correctly. Sure, there are a few that fall through the cracks, but not the overwhelming majority.
Zeke Hausfather has written about this in a recent essay in Substack that I am presenting today for our main subject:
Temperature data has to occasionally be corrected for measurement biases. This process is guided by the best available science. But, if you insist on using the raw data, guess what? "Raw temperatures actually show more warming"
open.substack.com/pub/theclima... — Jonathan Overpeck (@greatlakespecktwo.bsky.social) 2025-09-08T16:39:21.900Z
The raw temperature deal – by Zeke Hausfather
The raw temperature dealTemperature records are adjusted for changes in measurement techniques over time, but the net effect on global temperatures is small Zeke Hausfather
Sep 08, 2025
One long-running climate skeptic claim is that scientists are manipulating temperature records to show more warming, and that the “raw” temperature records show less severe climate change.
Reality is more mundane: we’ve changed the way we’ve measured temperatures a number of times over the past 250 years, scientists are trying to account for these changes, and the corrections we make to the record only have a modest impact on global temperatures.
Let’s dive into how ocean temperature measurements have changed over time as an example. Prior to the early-to-mid 1900s, sailors used to toss buckets over the side of wooden ships, pull those buckets up, and stick a thermometer in to measure sea surface temperature. But it turns out that evaporation cools water as the bucket is being pulled up, so the deck height of the ship and whether the bucket was made of wood or canvas could change the resulting temperature measurements by a few tenths of a degree C.
Once wooden ships with sails were replaced by modern vessels, temperature measurements were taken in the engine room intakes (where water is pulled in to cool the engine). These were more accurate than bucket-based measurements but – engine rooms being warm – tended to be slightly warmer than actual sea surface temperatures. In recent decades, ship-based measurements have largely been replaced by autonomous buoys that float around the ocean taking measurements, and send their data up to satellites.
If you ignore changes in instrumentation and just slap everything together into a single record, you end up with a biased result: spurious warming when we switched from buckets to ship engine room measurements in the mid-20th century, and spurious cooling over the last few decades as we transitioned to buoy measurements. It’s easy to prove this, as records from just one type of instrument show broad agreement with each other (and other independent data from satellites or Argo floats).
For land temperatures there are similar challenges, though they vary a bit more based on specific country practices. In the US, for example, we systematically changed the time at which temperature measurements were taken (when observers reset their min/max thermometers) from late afternoon to early morning in an effort to improve rain gauge measurements. These time of observation shifts introduced a bias as stations that would occasionally double count maximum temperatures (e.g. where a 5 PM measurement is a high for the following 24 hour period as well) when measuring in the afternoon switched to occasionally double counting lows when measuring in the morning.
A shift from liquid in glass thermometers to electronic thermistors in the 1980s-2000s introduced a cooling bias of about 0.5C in max temperature readings due differences in instrumentation that shows up clearly in side-by-side comparisons, as well as a slight warming bias (~0.1C to 0.2C) in minimum temperatures likely associated with a move closer to buildings in some cases for power hookups.
Most long-lived stations have also moved once or twice over their lifetimes. For example, many stations were moved from urban rooftops to newly built waste water treatment plants or airports in the 1940s and 1950s, resulting in cooler temperature readings post-move. The environment around stations has also changed as urban areas have expanded and impermeable surface areas have increased. The fundamental challenge is that older weather stations were set up to measure the weather (and its large short-term variations), rather than being optimized to detect more modest but persistent changes of 1C or 2C over century timescales.
Scientists understandably try to correct for changes in measurement practices over time to get a more accurate temperature record. This is done in a number of ways: side-by-side comparisons of different measurement techniques (liquid in glass thermometers vs thermistors), temporal and spatial comparison of records from different measurement approaches (buckets vs ship engine rooms vs buoys), using hourly data to assess the impact of changing observation times, etc.
One of the most effective ways that researchers have used to detect and correct for biases in land stations (which, unlike ocean records, have the advantage of being stationary) is through neighbor comparisons. Climate changes are generally quite spatially correlated over space and time; it thermodynamically difficult for one region to warm by 1C over the course of decades while another a few miles away to cool by 1C. When one station shows a change that persists over time that is not apparent in the records of any of its neighbors, it is indicative of a localized bias (e.g. a station move or instrument change). These biases, once detected, can be corrected by subtracting the persistent offset from neighboring stations (as NOAA does) or by treating everything after a breakpoint as a new station (as Berkeley Earth does). These “pairwise homogenization” algorithms can also be blindly tested on synthetic data where the underlying “truth” is known to ensure they are accurately detecting and correcting breakpoints without introducing their own biases.
There are other ways to assess the effect of changes in measurement techniques over time. You can use independent measurements from satellites. You can set up climate reference networks that are optimally sited and use triple redundant thermometers to detect and correct for any sensor drift. You can compare subsets of stations (e.g. urban vs rural, liquid in glass thermometers vs electronic thermistors, etc.) to track biases over time and see how well these are corrected for in adjusted data. There are hundreds of studies over the years looking at these details in detail; their takeaway is that while there are always improvements to be made in how we account for past biases, the temperature record we have today is broadly accurate and well characterized by assessed uncertainties.
Raw temperatures actually show more warmingSay you are a climate skeptic who, despite the manifold reasons for accounting for changing measurement techniques over time, dogmatically insists on simply using raw measurements as taken between 1850 and today. You would, at least based on arguments I come across on social media, tend to naively assert that the raw data would show less warming. And, at least for global temperatures, your assumption would be wrong.
Here are what global temperatures look like when only using raw data (dashed line) compared with adjusted land (GHCHv4) and ocean (ERSSTv5) records (solid line). Raw and adjusted temperatures are quite similar prior to 1940, after which the shift to ship engine room intake valves creates a spurious spike in raw temperatures. This is somewhat compensated for by subsequent adjustments to land temperature records, but global raw temperatures continue to show more warming compared to homogenized data through 2024.
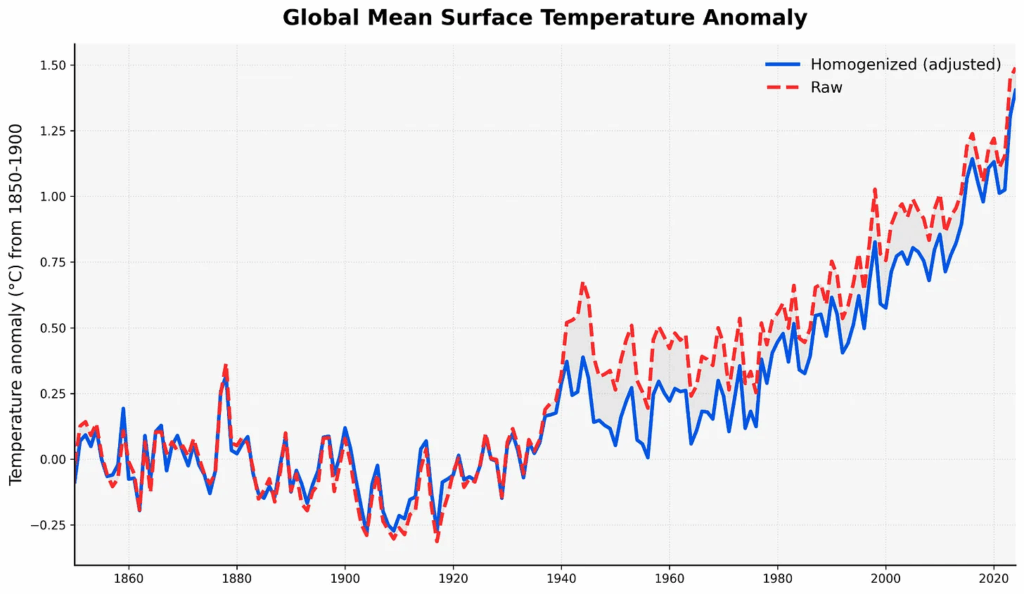 Global raw temperature records ( GHCNv4 unadjusted combined with SST raw fields) compared with homogenized data ( GHCNv4 adjusted combined with ERSSTv5). Global raw temperature records ( GHCNv4 unadjusted combined with SST raw fields) compared with homogenized data ( GHCNv4 adjusted combined with ERSSTv5).
If we just look at land temperatures, there is some additional warming introduced by homogenized over time, which addresses the various biases in land-based stations discussed earlier. But even the raw land data shows a broadly similar story of rapid warming over the past 50 years.
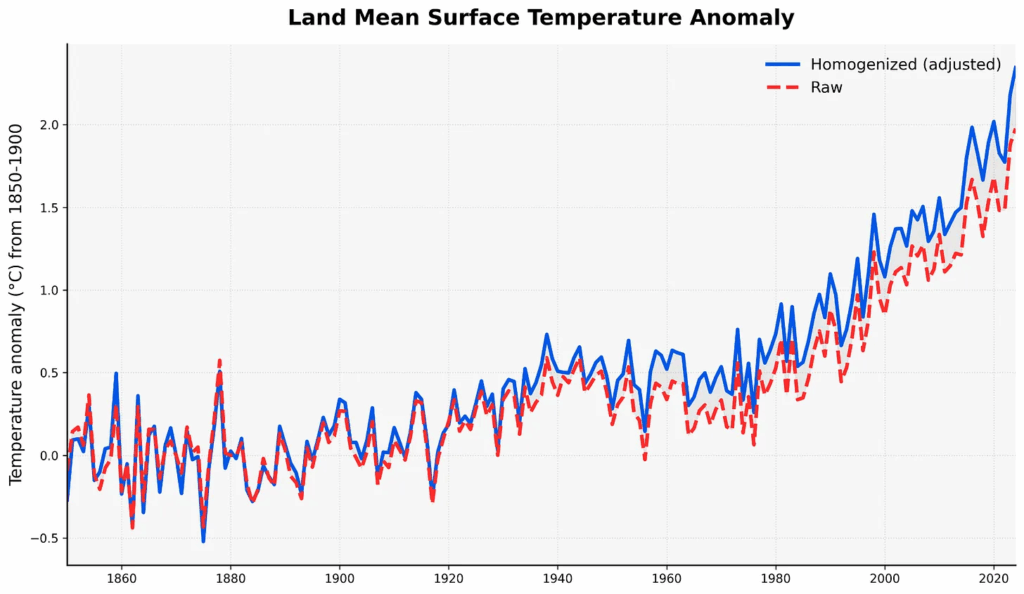 Land raw temperature records ( GHCNv4 unadjusted) compared with homogenized data ( GHCNv4 adjusted). Land raw temperature records ( GHCNv4 unadjusted) compared with homogenized data ( GHCNv4 adjusted).
In ocean temperatures we see the opposite, with raw data showing much more warming since preindustrial, largely due to biases introduced by changes in measurement techniques introduced around the WW2 era:
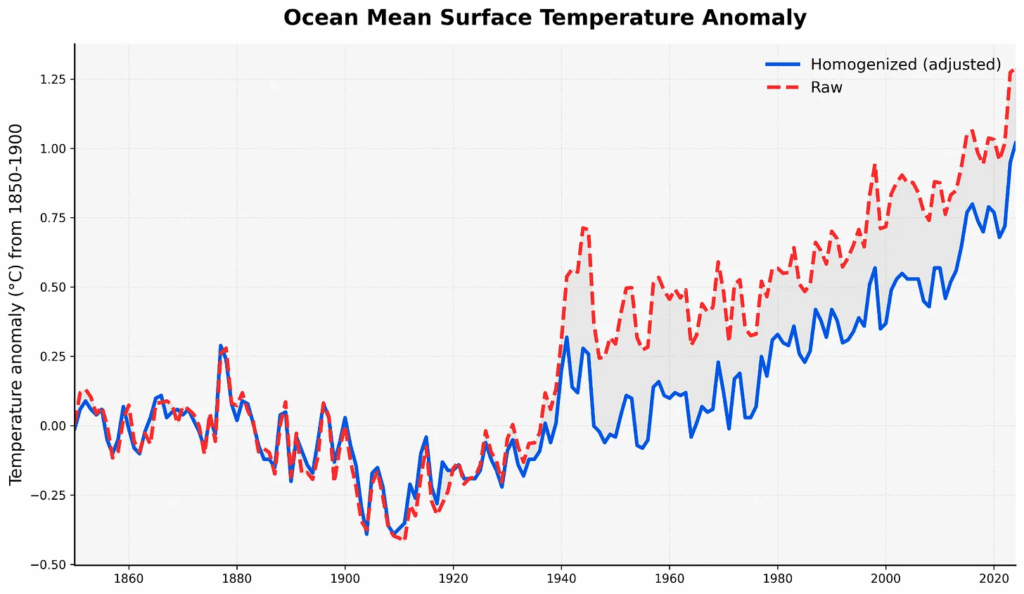 Ocean raw temperature records ( SST raw fields) compared with homogenized data ( ERSSTv5). Ocean raw temperature records ( SST raw fields) compared with homogenized data ( ERSSTv5).
Remaining uncertainties are concentrated in the oceansAs I noted earlier, the work of correcting for changes in measurement techniques over time remains an active area of scientific research, and there are a number of research groups around the world working on the problem. These include NOAA, NASA, and Berkeley Earth in the US, the UK Met Office Hadley Center in the UK, Copernicus ECMWF in the EU, the Japanese Meteorological Agency, and the China Meteorological Administration.
These produce quite similar records over land, where stations do not move and the detection and correction of localized biases is easier, though there are still some notable differences in the early record (pre-1900) that arise from which stations are included and how the gaps between more spatially sparse measurements are filled in.
Over the oceans, however, differences between groups are much larger. The two main ocean temperature records are NOAA’s ERSSTv5 and the Met Office’s HadSST4. These differ much more substantially due to different approaches in correcting for changing measurement techniques, with particularly large differences in the WW2 era and in more recent decades:
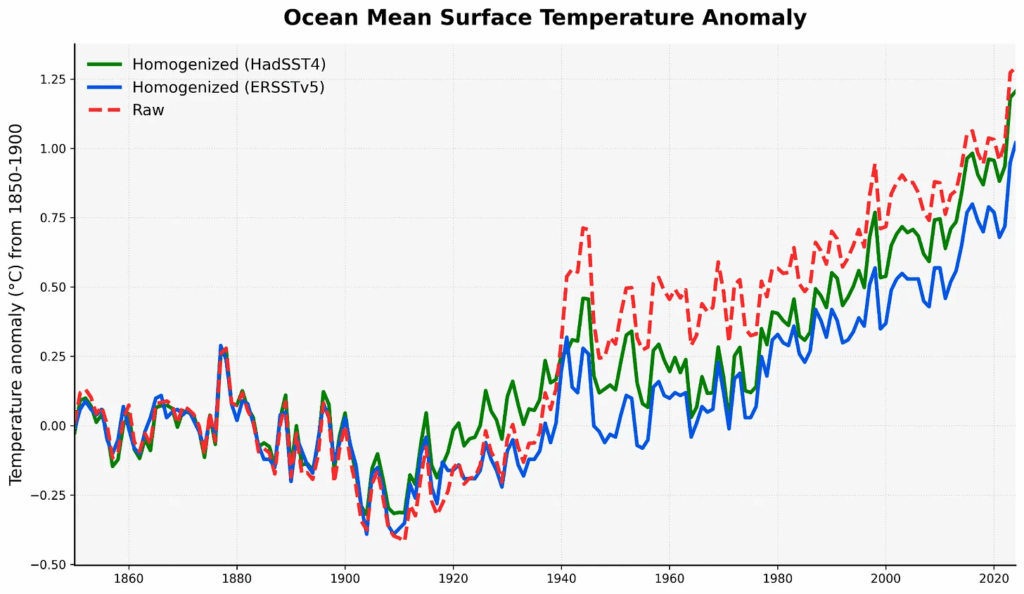 Ocean raw temperature records ( SST raw fields) compared with homogenized data from both ERSSTv5 (blue) and HadSST4 (green) Ocean raw temperature records ( SST raw fields) compared with homogenized data from both ERSSTv5 (blue) and HadSST4 (green)
If we compare global raw and adjusted data using HadSST4 rather than ERSSTv5 for the oceans, the difference in warming between the two is much smaller, reflecting the smaller difference in historical warming in the ocean between raw and adjusted data in the HadSST4 dataset:
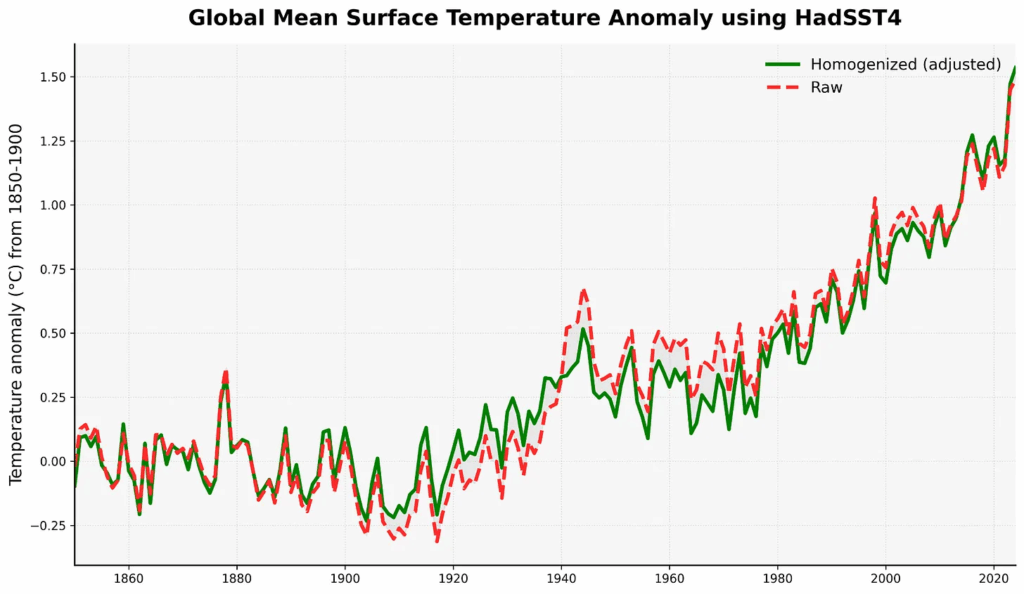 Global raw temperature records ( GHCNv4 unadjusted combined with SST raw fields) compared with homogenized data ( GHCNv4 adjusted combined with HadSST4). Global raw temperature records ( GHCNv4 unadjusted combined with SST raw fields) compared with homogenized data ( GHCNv4 adjusted combined with HadSST4).
Science is an ongoing process of discovery and self-correction, and it’s quite possible that the historical temperature record will continue to evolve over time as we both collect and digitize more historical data and develop better ways to detect and correct for changing measurement techniques and conditions. But however you parse the data – whether you use our best estimate of bias corrections or just throw all the raw data in a pot and stir it around – the results are the same: the world is rapidly warming.
Here are more “ETs” recorded from around the planet the last couple of days, their consequences, and some extreme temperature outlooks, as well as any extreme precipitation reports:
MEDITERRANEAN HISTORIC HEAT WAVE
Record heat has been sweeping the Mediterranean from West to East to West again for weeks
Today TUNISIA broke more September records
HIGHEST MAX
42.8C Djerba Island (tie)
HIGHEST MINS
30.2 Kebili
28.4 Sfax
More records tomorrow,specially in Libya — Extreme Temperatures Around the World (@extremetemps.bsky.social) 2025-09-10T18:35:57.396Z
MIDDLE EAST HEAT WAVE
New world highest temperature for September 2025 recorded yesterday:
49.1C at Shabankareh, IRAN
Fierce heat is spreading allover Asia from
41C in Turkmenistan to 34C in Mongolia.
The mid-September record heat will last for the rest of the week. — Extreme Temperatures Around the World (@extremetemps.bsky.social) 2025-09-10T15:26:15.605Z
More exceptional autumn warmth in SCANDINAVIA
On Sunday 25.2C at Saupstad and Skjetlein in NORWAY. new records for September.
Today another warm night with Minimums up to 18C in Finland and Estonia
Next 36 hours will see an accelaration of the warmth,followed by a quick cooling — Extreme Temperatures Around the World (@extremetemps.bsky.social) 2025-09-10T12:03:11.781Z
Another record in JAPAN
34.2C at Yoron Island today, it ties its September record of highest temperature.
No end in sight for this endless record heat — Extreme Temperatures Around the World (@extremetemps.bsky.social) 2025-09-10T11:36:01.014Z
So, sea level rise is just a hoax? Not if you live near the ocean. It’s starting to look bad, real bad.
apple.news/AFwzzm10XT4W... — Jonathan Overpeck (@greatlakespecktwo.bsky.social) 2025-09-10T00:42:30.502Z
Climate changes is heating up and drying out Amazonia, but it looks like deforestation is leading to less rain as well. “We were expecting to see deforestation as a driver, but not this much” = bad news for the region, its biodiversity & carbon storage. www.nytimes.com/2025/09/02/c... — Jonathan Overpeck (@greatlakespecktwo.bsky.social) 2025-09-04T15:42:26.503Z
Trump. Breaking Wind. — Rowan Hooper (@rowhoop.bsky.social) 2025-09-10T18:43:11.612Z
First the Beatles. Then Fleetwood Mac! 😢
Now the Dastardly Deniers: www.cnn.com/2025/09/10/c...
#ScienceUnderSiege — Michael E. Mann (@michaelemann.bsky.social) 2025-09-10T18:49:59.738Z
First the Beatles. Then Fleetwood Mac! 😢
Now the Dastardly Deniers: www.cnn.com/2025/09/10/c...
#ScienceUnderSiege — Michael E. Mann (@michaelemann.bsky.social) 2025-09-10T18:49:59.738Z
All @climate.noaa.gov counts of Chinese records are now online. There were no reports in the NOAA system before 1970. Chinese warming trends due to #climatechange are quite stark. guyonclimate.com/2023/08/29/n... guyonclimate.com/2023/08/26/n... guyonclimate.com/2023/08/24/n... @katharinehayhoe.com — Guy Walton..."The Climate Guy" (@climateguyw.bsky.social) 2025-09-10T01:25:11.205Z
WRT the the recent US DOE climate report & lack of real scientific peer-review...
"This is a recipe for a review process that is an unscientific sham & it would demonstrate in no uncertain terms that the DOE is uninterested in legitimate scientific debate."
www.theclimatebrink.com/p/the-fix-is... — Jonathan Overpeck (@greatlakespecktwo.bsky.social) 2025-09-04T18:35:27.375Z
A reminder - a majority of Americans in every state are aware of climate change and are worried about what it means for the future. climatecommunication.yale.edu/visualizatio... — Jonathan Overpeck (@greatlakespecktwo.bsky.social) 2025-09-01T17:13:27.367Z
Today is Sep 10—the climatological peak of the Atlantic hurricane season—and right now there are no named tropical cyclones anywhere on Earth. 🤔🤔🤔
Total accumulated cyclone energy for 2025 is at 59% of the NH's year-to-date average.
Lots to study here!
tropical.atmos.colostate.edu/Realtime/ — Bob Henson (@bhensonweather.bsky.social) 2025-09-10T18:42:32.961Z
See also the experts cited in our Sept 8 post below at @climateconnections.bsky.social. Among other things, midlatitude ocean and air temps have been incredibly warm, which distorts the normal global circulation and complicates hurricane/typhoon formation.
yaleclimateconnections.org/2025/09/anot... — Bob Henson (@bhensonweather.bsky.social) 2025-09-10T18:52:42.895Z
Good perspective here on the Atlantic. Note that only 1 of the 6 named Atlantic storms thus far has packed winds above 60 mph (that one was Cat 5 Erin). But I wouldn't be surprised if the Atlantic has a back-loaded season. Beware the ides of October!
www.scientificamerican.com/article/atla... — Bob Henson (@bhensonweather.bsky.social) 2025-09-10T18:48:14.591Z
90k deaths/year: “Given those consequences, life without fossil fuels looks inviting. It also looks desirable for pocketbooks”
apple.news/AqnUOlMQURhC... — Jonathan Overpeck (@greatlakespecktwo.bsky.social) 2025-09-09T00:40:59.676Z
“Right now the whole idea of CDR [CO2 removal from the atmosphere] … is kind of a Wild West scene, with lots of actors promising to do things that may or may not be possible...
...The priority has to be on reducing emissions, not on durable CDR at this point”
grist.org/accountabili... — Jonathan Overpeck (@greatlakespecktwo.bsky.social) 2025-09-09T15:00:00.741Z
EVs now the clear winner. "When you actually look at total life cycle emissions for vehicle manufacturing & production and then energy used through vehicle lifetime & end-of-use processing of vehicles through recycling and disposal, EVs always come out ahead"
www.detroitnews.com/story/busine... — Jonathan Overpeck (@greatlakespecktwo.bsky.social) 2025-09-08T16:23:09.191Z
As the work nears peak oil use, we’re going to see more of this: www.reuters.com/business/wor... — Jonathan Overpeck (@greatlakespecktwo.bsky.social) 2025-09-04T15:49:34.443Z
Check out our new Ann Arbor Sustainable Energy Utility. We're slashing emissions and energy costs at the same time we get more reliable electricity. www.fastcompany.com/91395511/ann... — Jonathan Overpeck (@greatlakespecktwo.bsky.social) 2025-09-02T16:01:35.964Z
Wildfire up due to warming. Better management, not just timber harvesting, is needed. "If global warming continues on its current trajectory, the amount of forest area burned each year could double or even triple by midcentury."
theconversation.com/boosting-tim... — Jonathan Overpeck (@greatlakespecktwo.bsky.social) 2025-09-08T13:59:25.535Z
Cost, pollution, energy hog…“Everybody loves the idea of a silver bullet…But desalination has a lot of problems.”
www.washingtonpost.com/climate-solu... — Jonathan Overpeck (@greatlakespecktwo.bsky.social) 2025-09-09T11:27:31.105Z
|


