Connatix
V2064555287
How This Stock Market ‘Epidemic’ Is Messing With Options Strategies
Rob Isbitts - Barchart - Fri Sep 26, 6:30AM CDT Columnist

Down market by Artit Wongpradu via Shutterstock
There’s an epidemic that has infected the stock market, in a way that is wreaking havoc on those of us who like to write options as part of a broader strategy. To be clear, I said epidemic, not pandemic. And, this one could be vanquished fairly soon.
But ironically, that would actually be worse for the stock market.
OK, enough of the cryptic chatter. I’m talking about the epidemic that has appeared in the form of low volatility. In particular, the CBOE Volatility Index ($VIX), which measures the expected price range of the S&P 500 Index ($SPX) over the next 30 days. In other words, the VIX measures how volatile the market will be.
Generally speaking, low volatility translates to stable or upwardly mobile stock prices, and high volatility is typically present at the scene of market declines.
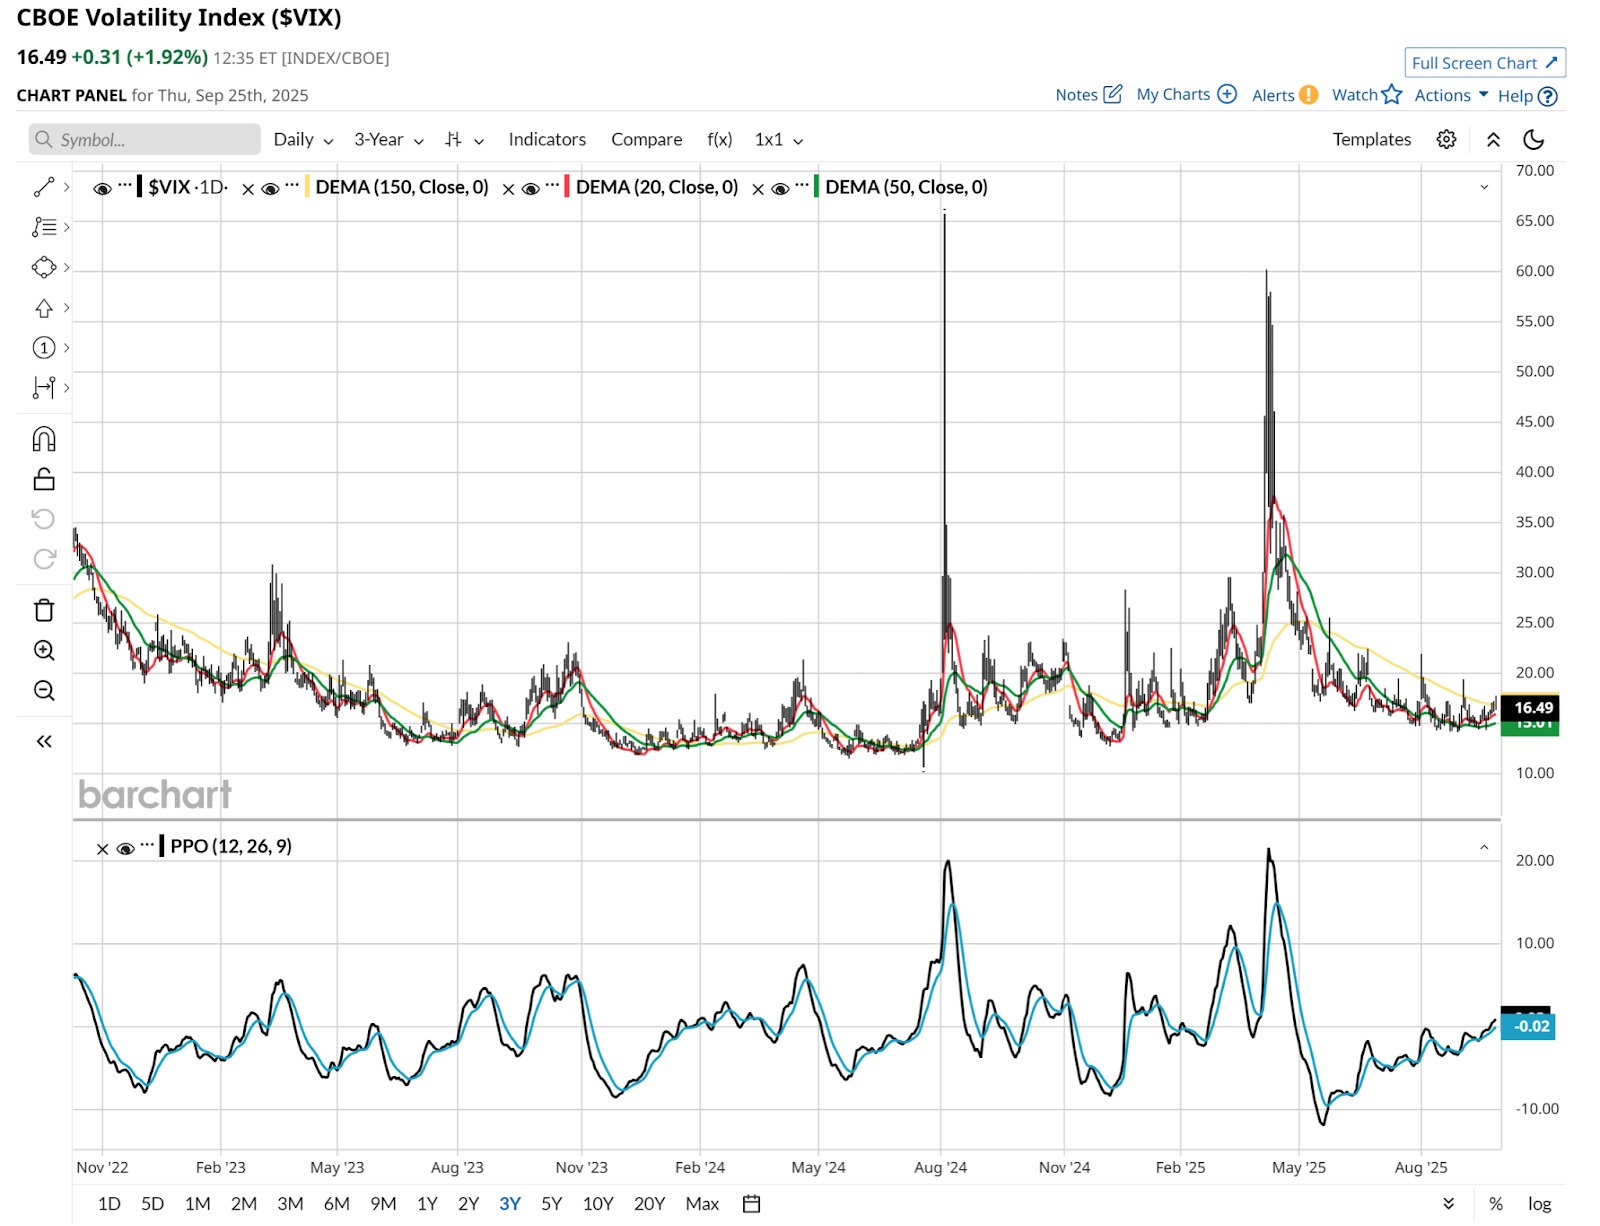 www.barchart.comAs the chart above shows, $VIX has been quite low over the past three years, yet also prone to quick, violent spikes. We saw that during the Japanese Yen “event” in August 2024, and again this past March and April, before and after “Liberation Day” in the U.S. www.barchart.comAs the chart above shows, $VIX has been quite low over the past three years, yet also prone to quick, violent spikes. We saw that during the Japanese Yen “event” in August 2024, and again this past March and April, before and after “Liberation Day” in the U.S.
How Low Volatility Affects Selling OptionsThat a rising VIX is synonymous with a falling S&P 500 Index, and the opposite also being true, is more obvious than actionable. So let’s talk about how this can impact options sellers. That includes everything from:
- Covered call writing on stocks or ETFs we own,
- Covered call ETFs, and their ability to deliver high income payouts,
- Selling puts below the current price to get paid while daring a security to fall, while obligating yourself to buy it at that price during a set time frame,
- And the strategy I’ve written about here the most, which is using covered calls as the other side of an option collar strategy. And by doing so, knocking down the cost of the put options I purchased to set a “line in the sand” below which I am not exposed to a drop in the price of the underlying security.
Simply said, a persistently low VIX, a VIX “epidemic” such as we’ve had for much of this year, does not eliminate those option-selling trades. But it does two things that should concern investors.
- You are getting paid less to either cap your upside, or for taking downside risk. Neither is a good thing in my book.
- Your expectations for how those strategies, especially covered call ETFs, will work, are likely severely inflated.
The good news, I suppose, is that the market is showing hints that volatility is bottoming. That’s my take in looking at the daily chart above, particularly through the eyes of the Percentage Price Oscillator (PPO) indicator, which is trying to nudge into positive territory and remain there.
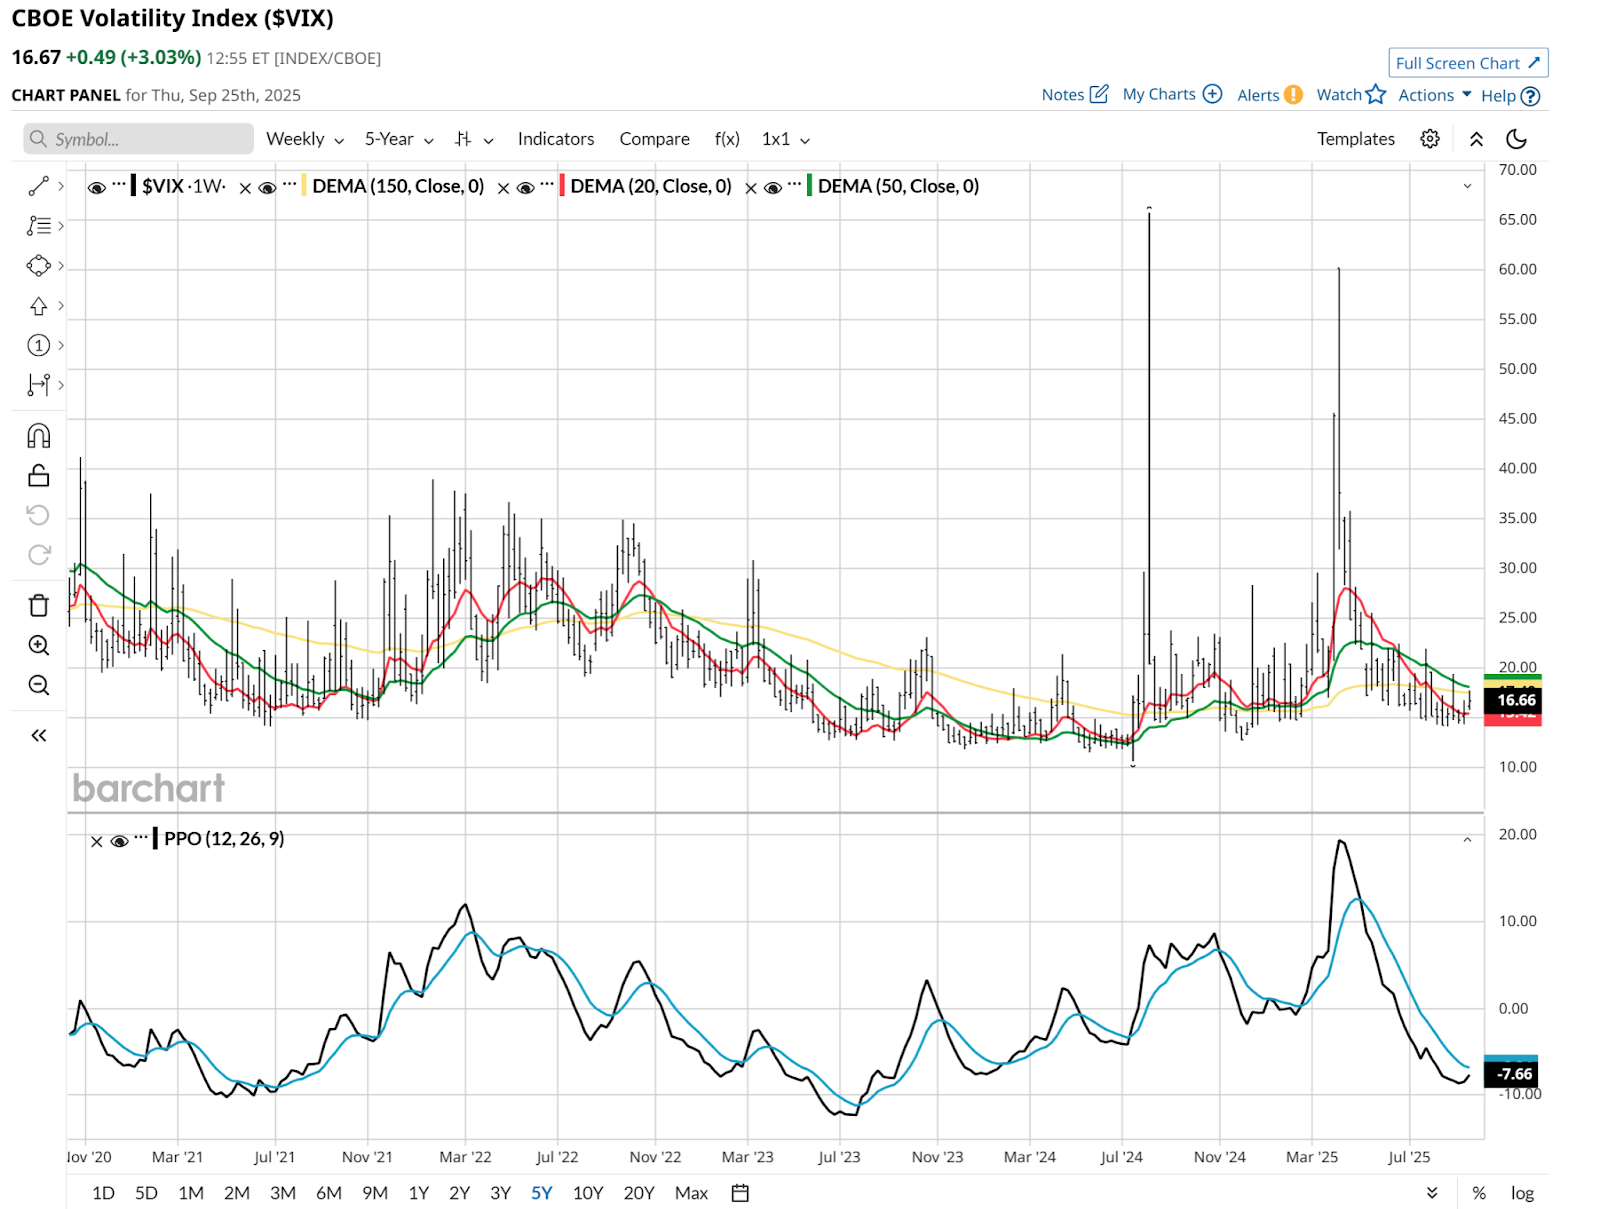
However, it’s early. That’s what this weekly chart below indicates to me.
Still, the nature of volatility, as shown plainly below, is that it often does not send a flare up to warn us that it is about to spike. So this is one of those market indicators that I tend to try to “front run” when trading it directly. That is, buy it when it is “overdue” to spike, and not commit too much capital to it.
The goal: Win big, or lose small.
 www.barchart.comHowever this continues to mess with those options strategies that pay us up front. Here’s a quick example, using a collar on the SPDR S&P 500 ETF (SPY), which I have made a central “anchor” in my broader trading. www.barchart.comHowever this continues to mess with those options strategies that pay us up front. Here’s a quick example, using a collar on the SPDR S&P 500 ETF (SPY), which I have made a central “anchor” in my broader trading.
Below, I’m showing you a marked up, extended version of what I usually post when providing an option collar sample. Why show so many call option selling possibilities versus a $635 strike price put option through year-end? Because it clearly illustrates the low-VIX issue.
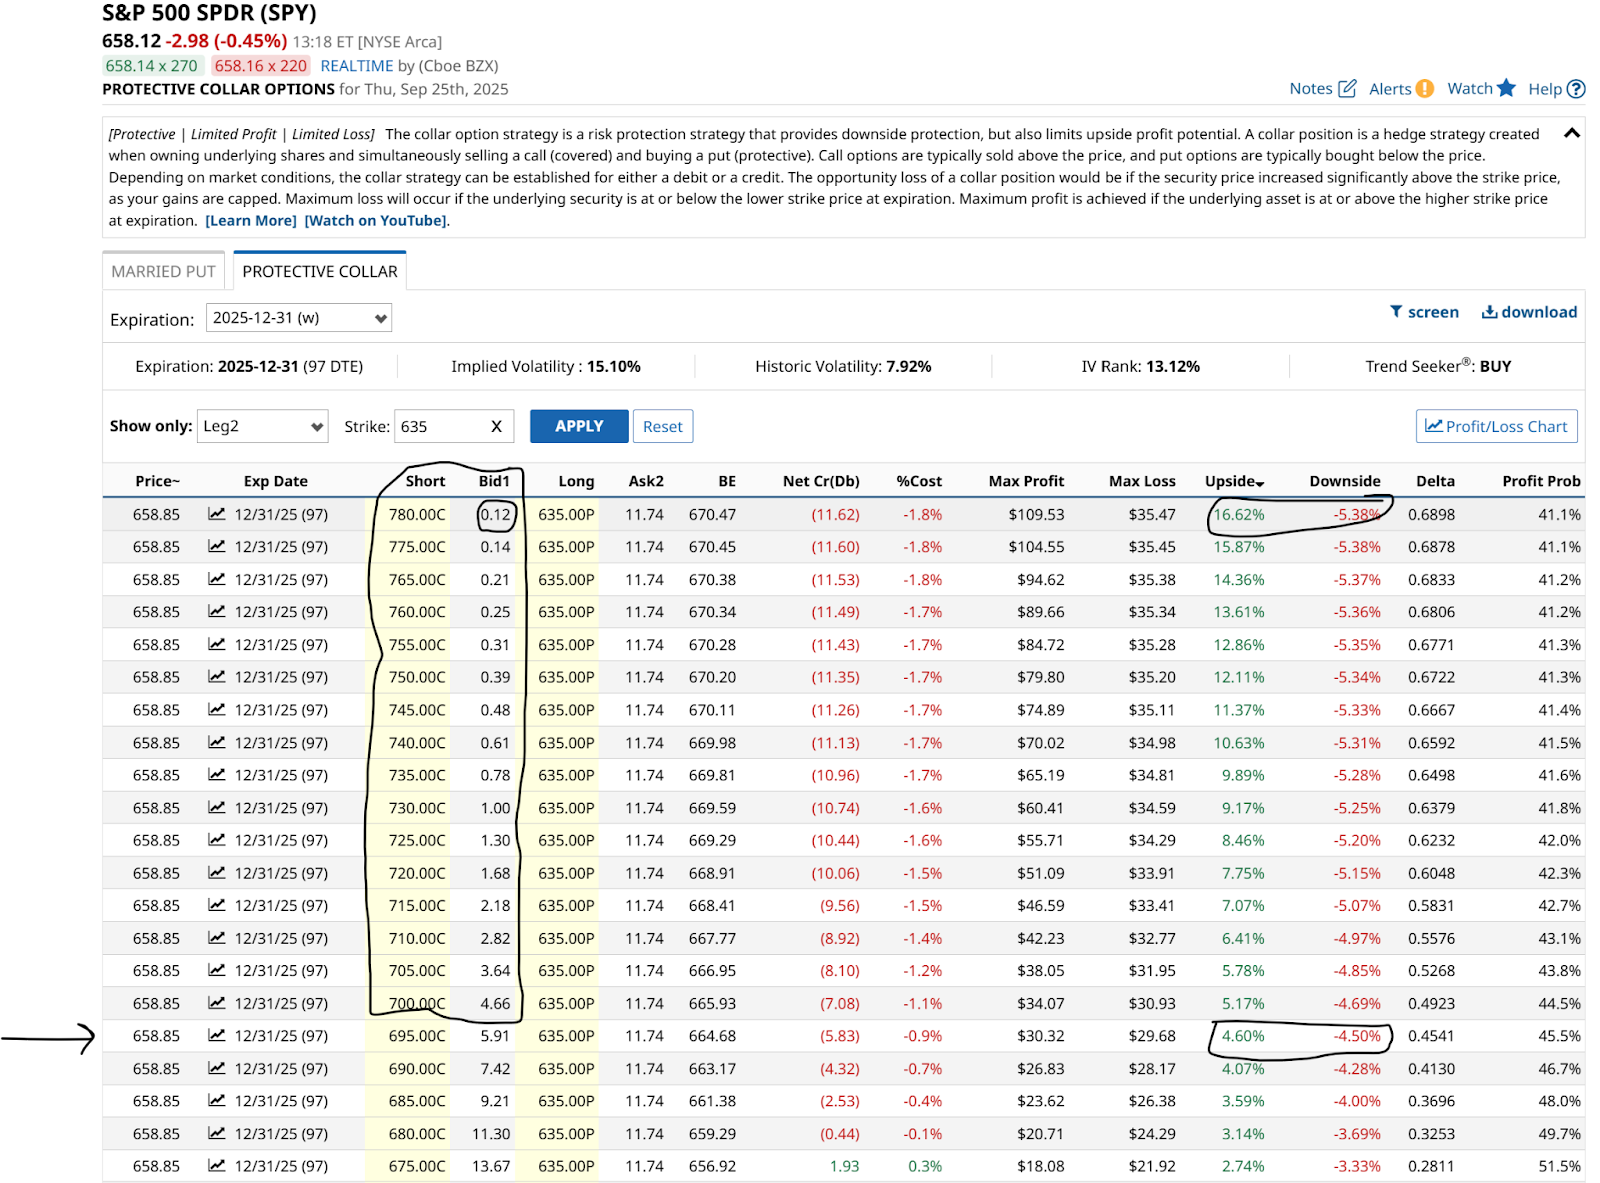 www.barchart.comAt first glance, doesn’t that top one look nice? 5% downside versus more than 16% upside over the next three months. Not bad. Except for one thing. www.barchart.comAt first glance, doesn’t that top one look nice? 5% downside versus more than 16% upside over the next three months. Not bad. Except for one thing.
Is It Low V?That low volatility in the SPY ( IV Rank is 13%, meaning it is toward the low end of its 12-month range) makes it so that if I want to get that nice up/down ratio, I have to accept a mere $0.12 a share. In other words, I’d be about as well off just skipping the call side of the collar. Which is exactly what I’ve been doing for a while now.
Finally, as we move down the page, I’m looking for a point at which I can offset the $11.74 cost for the put. Not entirely, but maybe half of it. That does not occur until way down at the $695 strike price. Yikes! If you look to the right, I’ve circled where it shows that by doing that put/call strike combination, I am down to a 1:1 collar tradeoff. Which I’m not inclined to do. Ever.
So if you like selling options, perhaps you should be rooting for a rise in the VIX. Higher volatility will pay you more. Or, you can trade stocks or ETFs with higher volatility, since the market does not trade entirely in sync with S&P 500 volatility.
But be careful what you wish for, since a rising VIX is essentially Wall Street’s fear gauge rising. And that presents a host of other issues for us to grapple with.
On the date of publication, Rob Isbitts did not have (either directly or indirectly) positions in any of the securities mentioned in this article. All information and data in this article is solely for informational purposes. For more information please view the Barchart Disclosure Policy here.
More News from Barchart
Related Symbols
SymbolLastChg%Chg| $VIX | 15.29 | -1.45 | -8.66% | | CBOE Volatility Index | | $SPX | 6,643.70 | +38.98 | +0.59% | | S&P 500 Index | | SPY | 661.82 | +3.77 | +0.57% | | S&P 500 SPDR |
 Don’t Miss a Minute of Daily Action Don’t Miss a Minute of Daily Action
Our exclusive midday newsletter highlights top stories, big movers, and breakout charts.
By clicking Sign Up Now to receive this free newsletter, you will also receive free Barchart Partner emails. Opt-out any time. See Terms of Service and Privacy Policy for details.
Most Popular News
/AI%20(artificial%20intelligence)/Artificial%20intelligence%20and%20machine%20learning%20concept%20-%20by%20amgun%20via%20iStock.jpg) 1 1
From $4 to $16 in Just One Year, This Growth Stock Is Unstoppable
 2 2
Jane Street Is Betting Big on Opendoor Stock. Should You?
 3 3
3 Dividend Aristocrats Up 20%+ YTD With More Upside Ahead
 4 4
This Nuclear Energy Stock Just Scored a Big Win. Should You Buy Shares Here?
 5 5
Google Stock Is No Longer So Undervalued. Should You Buy or Sell GOOG Now?
Log In Sign Up
Market:
HOME
Stocks
Options
ETFs
Futures
Currencies
Investing
News
Tools
Learn
Site News2
B2B SOLUTIONS
Contact Barchart
Site Map
Back to top
Change to Dark mode
Membership Barchart Premier Barchart Plus Barchart for Excel Create Free Account
Resources Site Map Site Education Newsletters Advertise
Barchart App Business Solutions Market Data APIs Real-Time Futures

Stocks: 15 minute delay (Cboe BZX is real-time), ET. Volume reflects consolidated markets. Futures and Forex: 10 or 15 minute delay, CT. Market Data powered by Barchart Solutions. Fundamental data provided by Zacks and Morningstar.
Barchart is committed to ensuring digital accessibility for individuals with disabilities. We encourage users to Contact Us with feedback and accommodation requests.
© 2025 Barchart.com, Inc. All Rights Reserved.
About Barchart | Affiliate Program | Terms of Service | Privacy Policy | Do Not Sell or Share My Personal Information | Cookie Settings |


