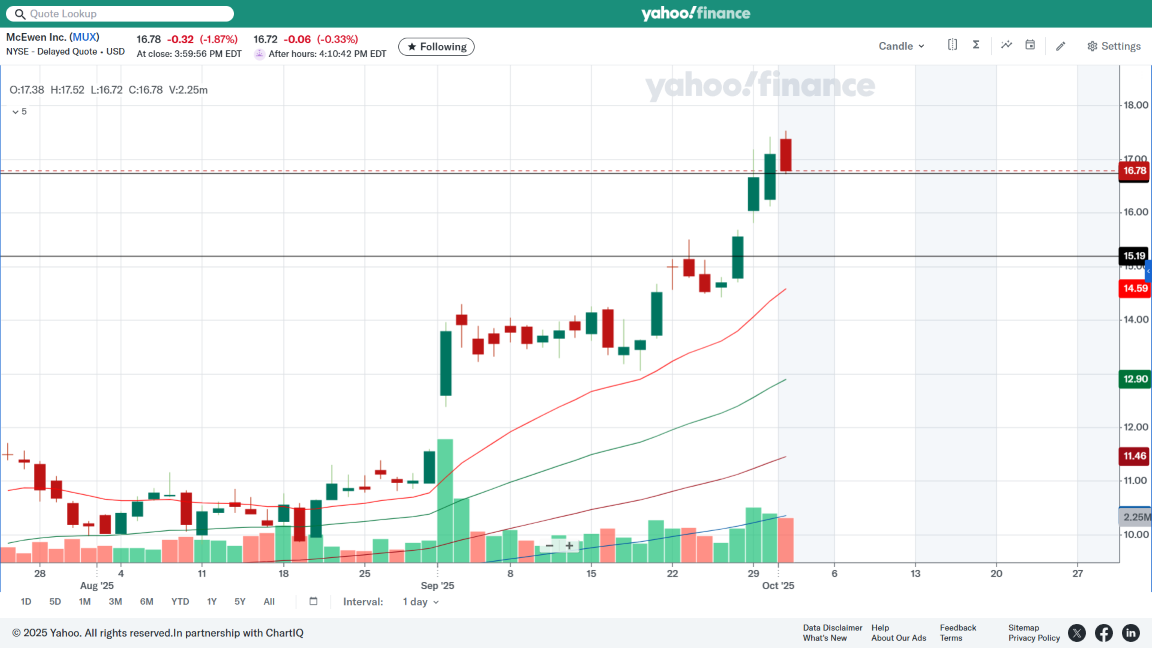
MUX moved yet higher on the daily chart this week, forming higher highs and higher lows after Fridays gap-up. The highest closing price we've had so far is $17.10 which was on Tuesday and with a high of $17.52 which was today while forming a red candlestick.
The upper black line is Tuesdays pivot point ($16.76) and todays low was $16.72, while closing just above the pivot line at $16.78. The lower black line is the open pivot-point that never filled from last Thursday (9/26/25) with a rather large gap in between.
We will soon have direction I'm sure, we need a base above the upper black line for at least a few days to as much as a few weeks and also, ...gaps don't always fill, especially with stocks that have strong momentum, but were talking about MUX!!
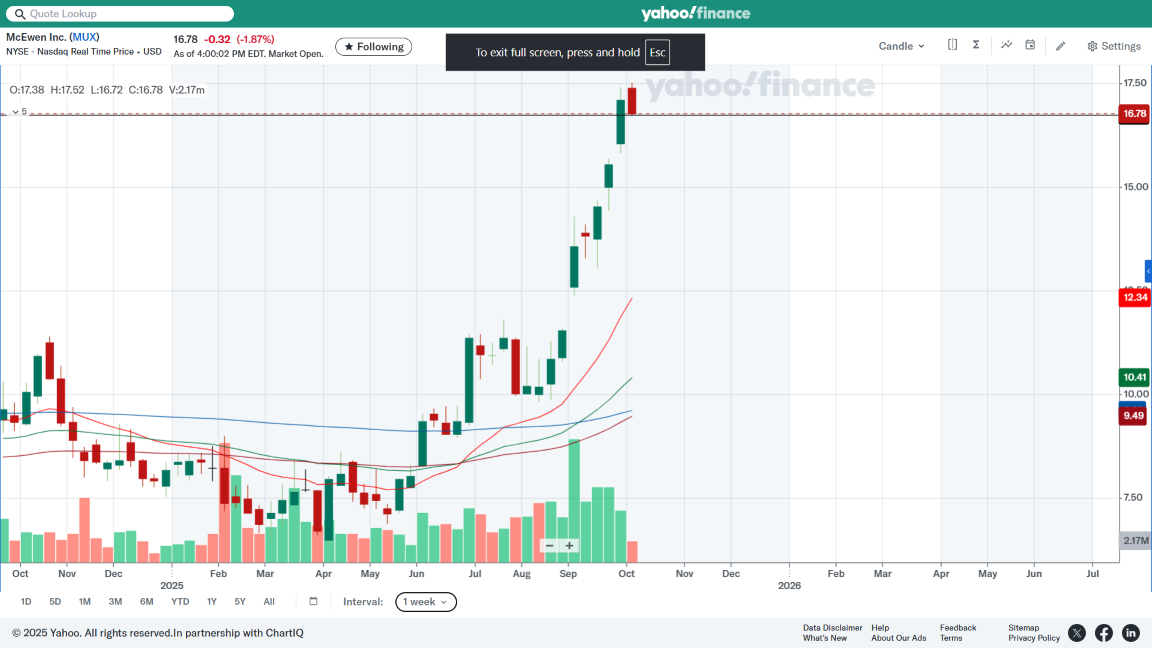
The weekly chart below looks similar to 08/01/2005s performance when it took off sharply, it can be seen on any good stock charting website, that rally ended with a close of $8.43 pre-split or ($88.43 post split) and the high was $9.84 or ($98.47 post split.) before it ended. The 100 week line is still rising to the 200.
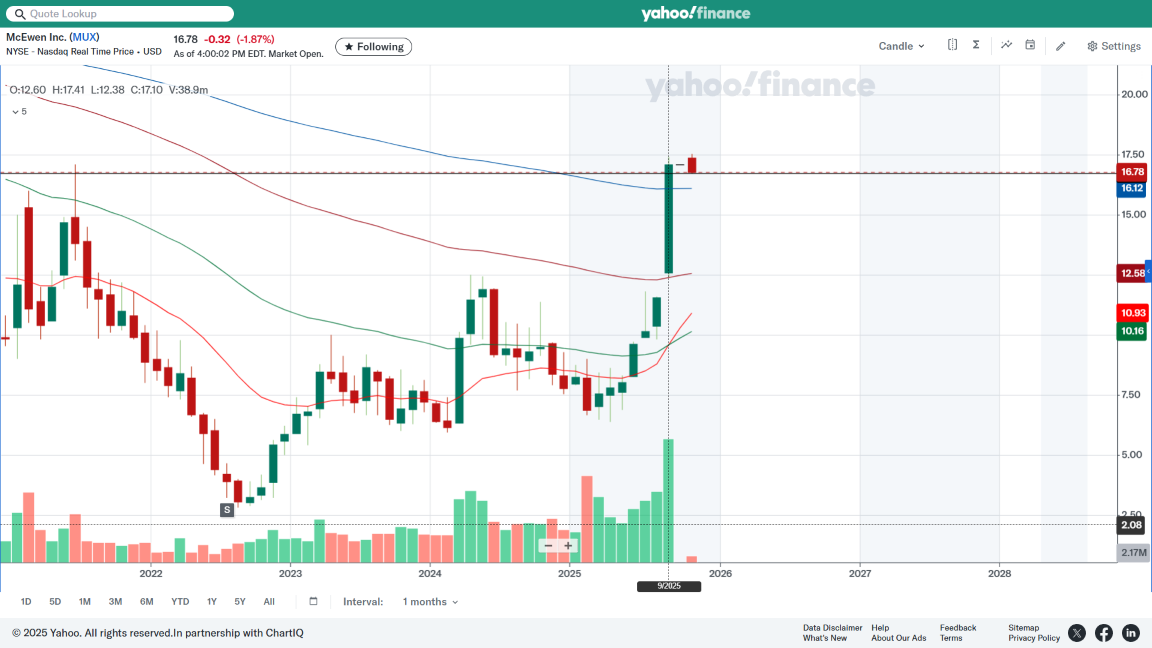
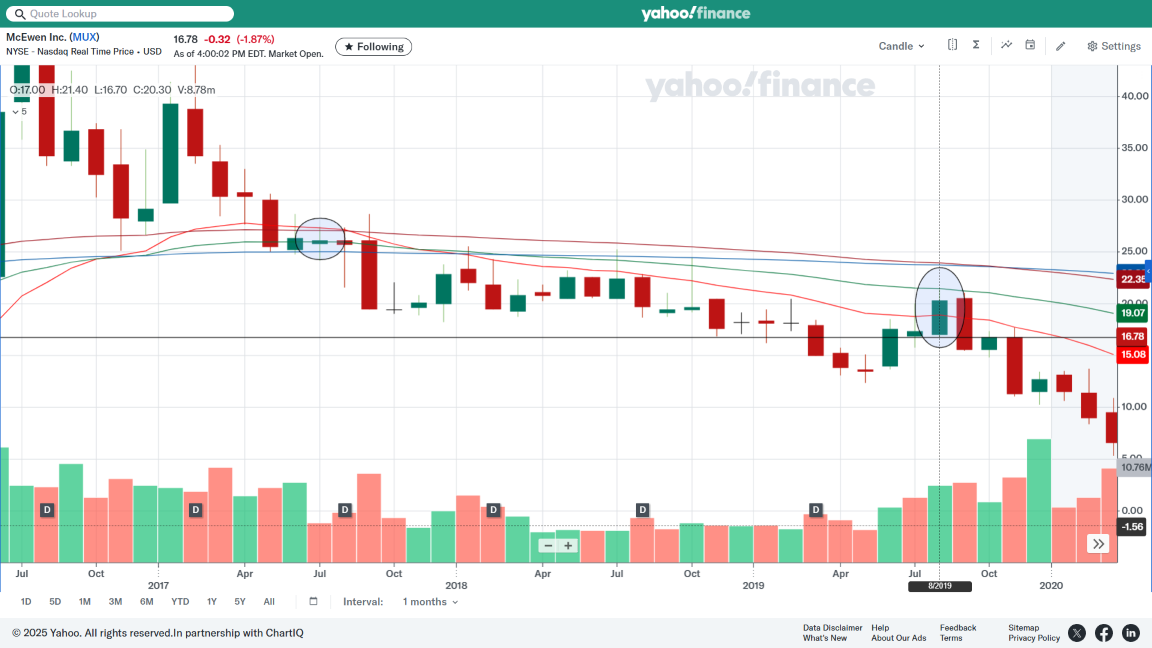
Two monthly charts below:
The record amount of monthly volume in the first chart is huge, over 39.8-million, this is first time its printed these many shares, the monthly volume back in 8/2005 was only 1.38 million, its been over 20 years, which is about the amount of time some of us have held this stock.
Also, I see the stock closed above the 20-month EMA as it tested the 100 below, also, the 20 month EMA crossed above the 50 this past month, some backfill might happen, the monthly pivot is quite a ways down, but we know "anything can happen with MUX".
The second monthly chart goes back to 2016/17 when it kept on tanking. The black circle on the left (July) is the last time MUX closed above the 200-month EMA, its been over 8yrs, I now feel really old in my 70s, which is why I don't trade intermediately like I used to years ago, but I managed to hang on to 5k+ shares.
The black circle on the right is a high point ($21.40) and a low of $16.70 from 08/2019 which I hope is its next technical target.
Best of luck to all.
James
|


