Visualized: Where is the Most Natural Gas Production?
October 8, 2025
By Ryan Bellefontaine
Graphics & Design
The following content is sponsored by Shale Crescent USA

Visualized: Where is the Most Natural Gas Production?
Key Takeaways- Nine countries account for over 70% of natural gas production.
- Shale Crescent USA ranks third globally at 369 Bcm/Year across Ohio, West Virginia, and Pennsylvania.
- Shale Crescent USA’s regional gas abundance can translate into cost, reliability, and siting benefits for manufacturers and energy-intensive operations.
Natural gas production is heavily concentrated in a few countries. Dense and abundant supply significantly influences costs, security, and industrial strategy. As energy demand grows, proximity to energy becomes more critical for manufacturers competing on energy and logistics.
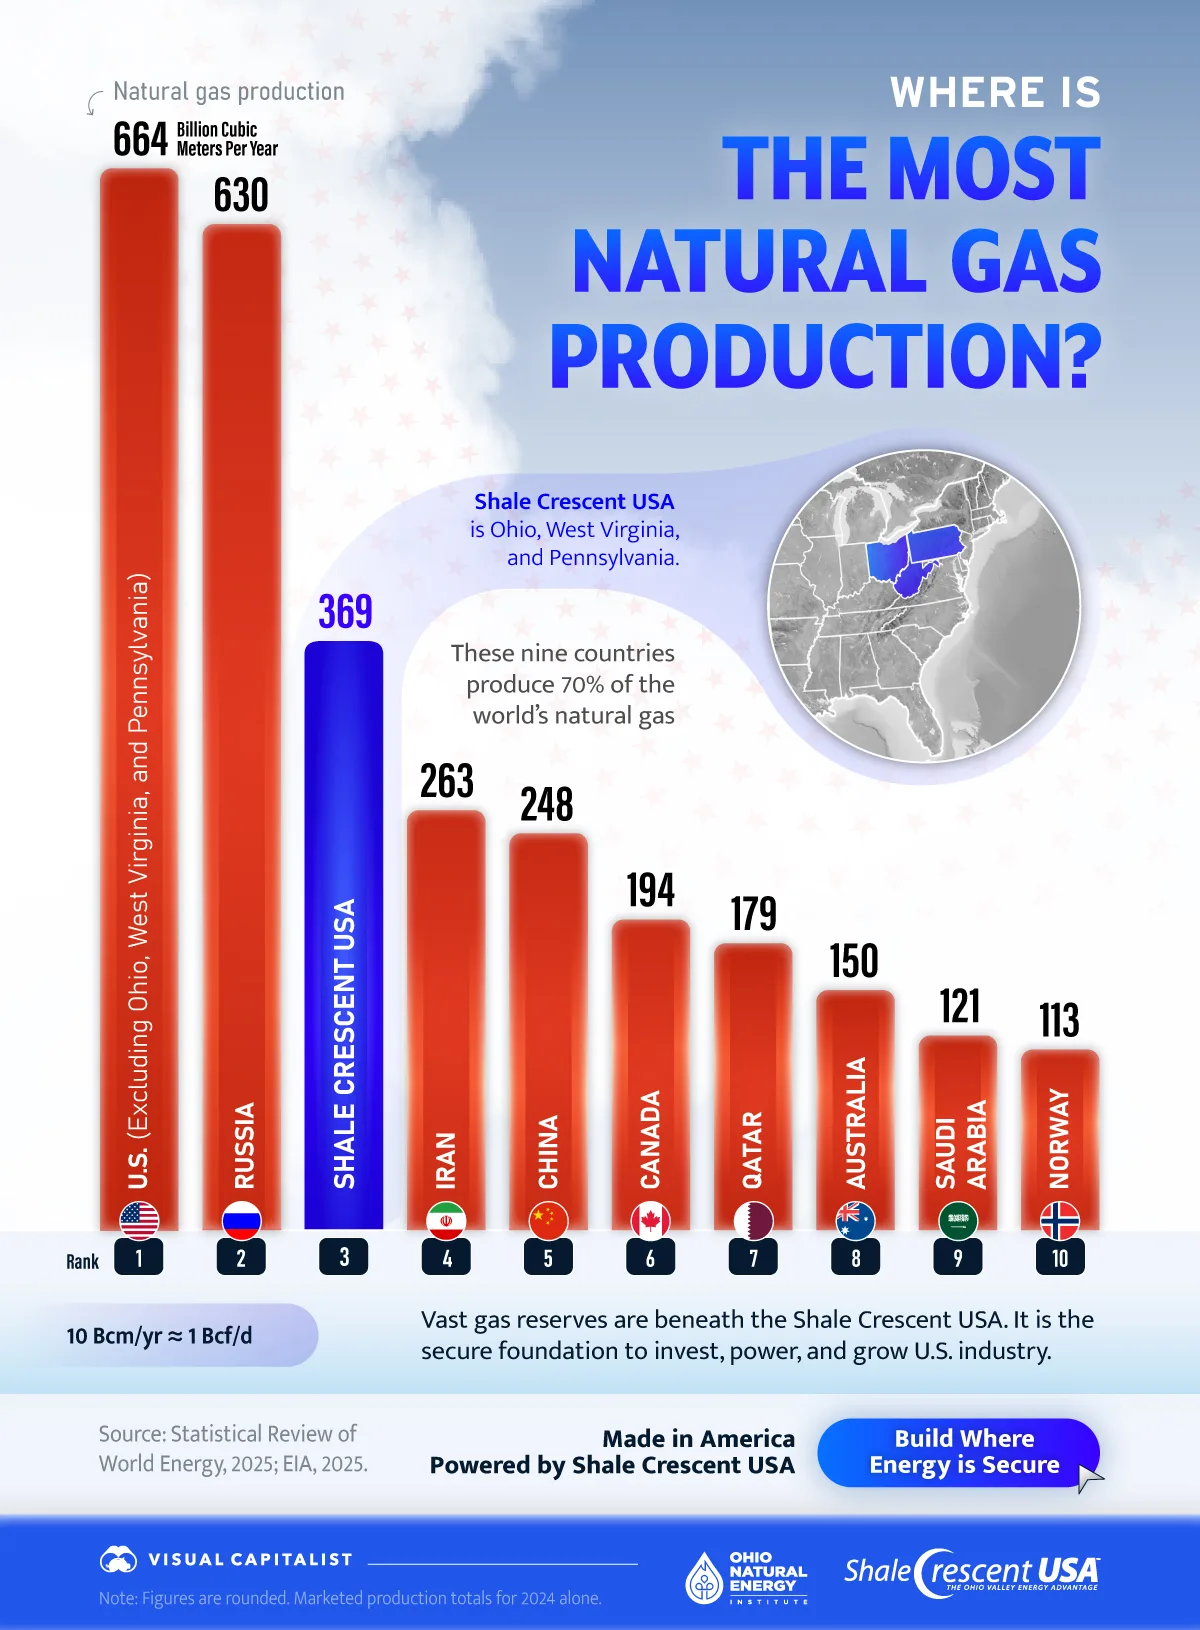
This chart, in partnership with Shale Crescent USA, shows the concentration of global natural gas production in 2024 and the dominance of the top nine producers in supply. Data is from the Energy Institute’s Statistical Review of World Energy and the EIA.
How Global Production Stacks UpHere is a table that shows global natural gas production in billion cubic meters per year and billion cubic feet per day.
RankCountry2024 Bcm/y2024 Bcf/d|
| 1 | ???? U.S. (excl. OH, WV, PA) | 664 | 64 | | 2 | ???? Russia | 630 | 61 | | 3 | ???? Shale Crescent USA | 369 | 36 | | 4 | ???? Iran | 263 | 25 | | 5 | ???? China | 248 | 24 | | 6 | ???? Canada | 194 | 19 | | 7 | ???? Qatar | 179 | 17 | | 8 | ???? Australia | 150 | 15 | | 9 | ???? Saudi Arabia | 121 | 12 | | 10 | ???? Norway | 113 | 11 |
Output is concentrated, with the U.S. (excluding Ohio, West Virginia, and Pennsylvania) producing 664 Bcm/year, and Russia producing 630 Bcm/year. Shale Crescent USA ranks third at 369 Bcm/year, followed by Iran (263), China (248), Canada (194), Qatar (179), Australia (150), Saudi Arabia (121), and Norway (113).
Together, these nine countries produce over 70% of the global supply. Consequently, reliable supply and energy security are only experienced in a few regions.
The Shale Crescent Abundance
Shale Crescent USA includes the states of Ohio, West Virginia, and Pennsylvania. Because the region sits atop Appalachian reserves and dense midstream infrastructure, manufacturers gain reliable and low-cost access to fuel and feedstock.
Beneath the Shale Crescent, resources are vast. The U.S. Geological Survey estimates the Marcellus and Point Pleasant–Utica formations hold a mean of 214 trillion cubic feet of undiscovered, technically recoverable natural gas—evidence of a durable, long-term supply for the region.
Abundant, stable gas lowers power and feedstock costs; it also shortens supply lines. Therefore, energy-intensive projects can invest, scale, and operate with greater certainty across the U.S. industrial base. |


