re <<uh, scary. careful!>>
zerohedge.com
What Is Everyone Else Doing: Market Positioning And Technicals Cheat Sheet
BY TYLER DURDEN
TUESDAY, OCT 14, 2025 - 11:32 AM
While positioning has undergone a thunderous reset in the past 48 hours, as a market that was extremely overbought heading into Trump's Friday tweetfest selloff has suddenly and violently reset to just about neutral (as both we and Morgan Stanley QDS explained)...
[url=]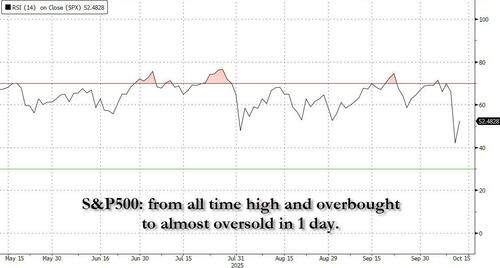 [/url] [/url]
... traders are desperate for some insight into how everyone else is positioning after the washout for one simple reason: since fundamentals haven't mattered in this market in about 3 years and only technicals and positioning are relevant (much more so than economic data which is delayed due to the government shutdown but which is manipulated propaganda garbage to begin with, constantly revised in a way that suits whoever is in charge), suddenly nobody has any idea what to do, and sure enough, Goldman's US Panic Index soared from 5.7 to over 9...
[url=] [/url] [/url]
... in one of the biggest 1-day increases on record.
[url=] [/url] [/url]
To help the hordes of confused, overpaid portfolio managers, here is a handy, one-chart primer from the Goldman trading desk, breaking out the bank's most important positioning axes and technical metrics, including sentiment, institutional and hedge fund, systematic, retail, and derivative indicators.
The bottom line: while sentiment remains bullish it is far from euphoric on a consolidated basis (Goldman has it at 7 out of 10 in terms of overall length) with several pockets of the market crowded, but overall positioning is neutral at the index level as macro uncertainty picks up and earnings kick off.
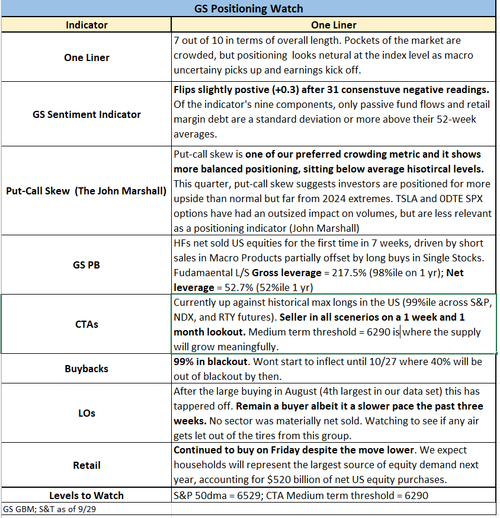
For those not very pressed for time, here are some more positioning details:
1. Short trend has flipped to slightly more negative in a subset (roughly 20%) of global markets, with the remaining 80% more positive, and 100% of medium-longer term signals still positive. S&P short-trend became a touch negative below 6580, but is positive again intraday Monday. Overall coming into today, models expect a modest $18bn of global equity 1 week sales – predominately in US markets, though S&P reestablishing positive short trend would mitigate that – and a similar figure over the cumulative 1 month, so the baseline sales are not extending further currently, and with contributions from both CTA/trend followers and the vol-based investors. If the market rebounds and vol subsides, the selling would be even smaller, and conversely there is ample room to grow larger if downside continues, with length near an 8.5 out of 10. Short trend is positive by 1.7% in the median global market currently, while medium trend is somewhat further away at >5% below spot and near 6300 in SPX.
[url=]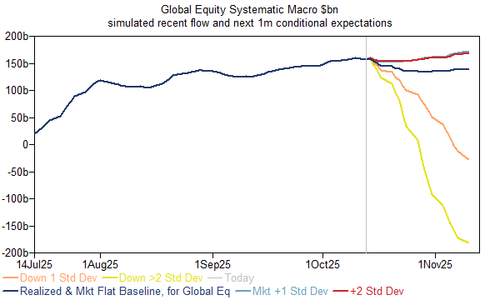 [/url] [/url]
[url=]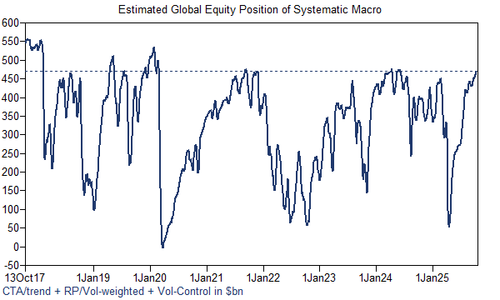 [/url] [/url]
2. S&P gamma is generally pro-cyclical currently, and could exacerbate market moves for the time being as one risk factor. During Friday’s selloff dealers went from long being long ~$9b gamma to long ~$4b. The -$5b drop during a single trading session was the largest in 3+ years. Why does this matter? Dealers hedging activity will not dampen volatility as much as it has been as of late. In order to stay hedged (when dealers are long gamma) they buy underliers when prices fall and sell when prices rise which leads to tighter trading ranges and lower realized volatility. When dealers are short gamma (which they are not right now...they are just less long) the opposite occurs (sell into declines and buy into rallies, amplifying price moves).
[url=]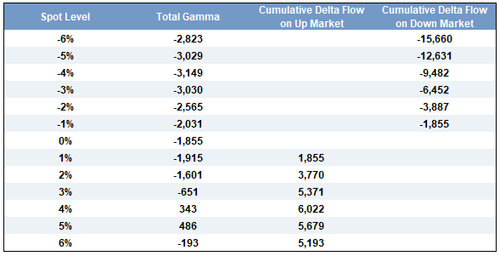 [/url] [/url]
[url=]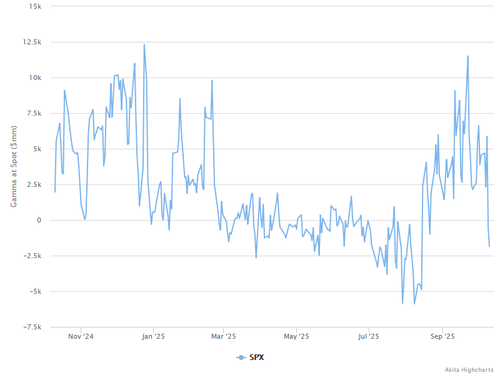 [/url] [/url]
3. NEIXCTAT (CTA trend following performance) became slightly positive on the year last week before Friday, the first time since February and after being down 12% in May. This was driven by the equity and commodity buckets lately, and could be challenged as one risk factor if equity performance faltered. Goldman expects CTA/trend followers to renew buying govt bonds (excluding JGB) led by the German 5-10 year sector, and round out their oil/energy selling in the next one week in the baseline scenario.
[url=]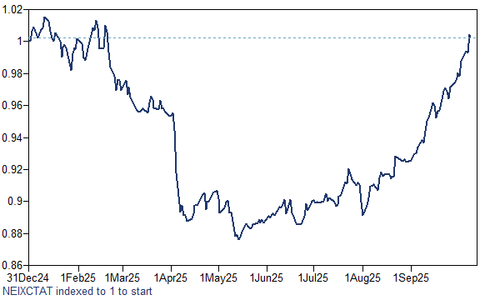 [/url] [/url]
[url=] [/url] [/url]
4. CFTC/COT data remains offline during the shutdown. In Goldman's overall desk observations last week, they observed hedge fund led US index selling, with new shorts somewhat greater than trimmed longs though both contributing, and the heaviest activity on Friday and proportionally heavier in Nasdaq. This is in addition to some overall selling the previous week during quarter-end. Activity in major European markets was relatively quieter last week, and Asian markets mixed, with Japan index buying (and JGBs selling) and China selling led by Friday given the headlines
[url=]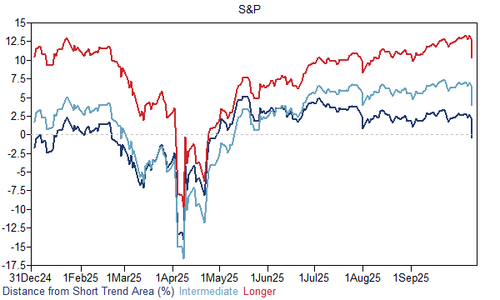 [/url] [/url]
5. Buybacks: The current blackout period will end Oct 24 (approx. 40% will be in open window after that). Corporates typically exit blackout ~1-2 days post earnings so companies will start to enter open window periodically starting mid October when earnings start.
[url=]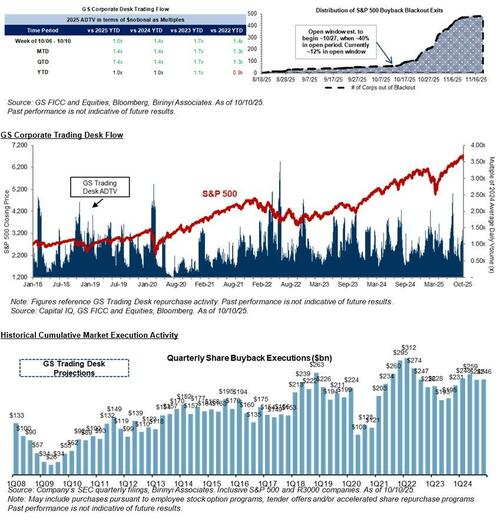 [/url] [/url]
6. Liquidity. Huge 1-day collapse, near the Liberation Day lows and among the lowest reading of the decade.
[url=]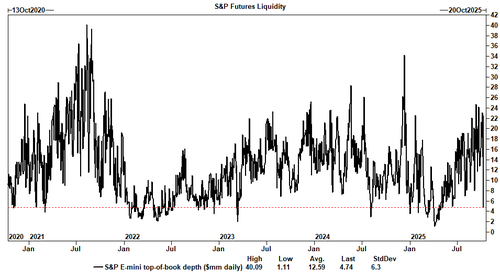 [/url] [/url]
[url=]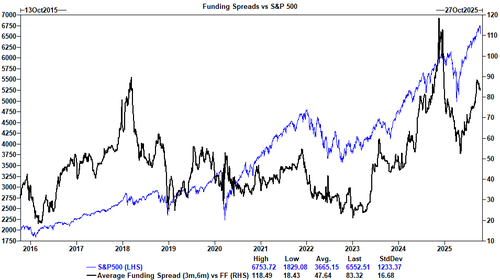 [/url] [/url]
More in the full Goldman note available to pro subs. |


 [/url]
 [/url]
 [/url]
 [/url]
 [/url]
 [/url]
 [/url]
 [/url]
 [/url]
 [/url]
 [/url]
 [/url]
 [/url]