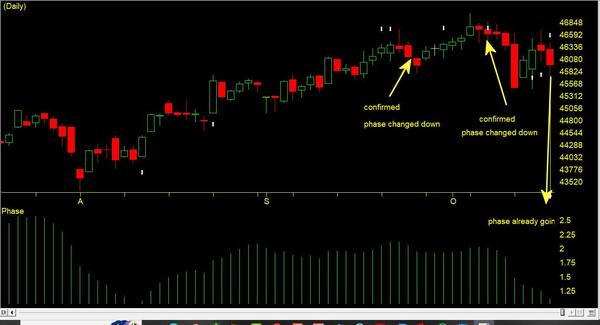
They sent me this. The Price Phase hasn't crossed over yet. In the current gradual uptrend, the MACDs have given false crossovers since the declines are either shallow or short. The most recent one was 6% and the market appears to be trying to make new highs. The current negative bias in seasonality for the indices and breadth are approaching the end in late October in my opinion. I've noticed in recent years that the February to April period has become a more pronounced negative period than September to October.
AIQ TradingExpert Pro Market Timing Update – October 19, 2025AI Confirms a Strong Market Sell SignalAIQ TradingExpert Pro’s market-timing system fired a strong confirmed sell signal on October 16, 2025, marking a notable shift in market momentum.
This follows two unconfirmed buy signals earlier in the week and a prior confirmed down signal on October 7, which correctly preceded a 1100-point market drop over the next three sessions.
While the mid-month buy attempts suggested possible support, the AI-based phase model never confirmed a trend reversal — and as of now, the bears are clearly regaining control.
?? What Triggered the October 16 Sell SignalAIQ’s expert system combines multiple technical indicators to identify major turning points.
On October 16, several key bearish rules fired simultaneously — a rare and powerful confluence:
Price Phase, Volume Accumulation %, and Advance/Decline Oscillator are All Decreasing
In a sideways market, this cluster is viewed as a short-term bearish setup, often preceding a decline in prices.
Exponentially Smoothed Advance/Decline Line Turns Negative
When combined with negative readings in both the Up/Down Volume Oscillator and Advance/Decline Oscillator, this signals broad internal market weakness and precedes downward pressure.
Up/Down Volume Oscillator Turns Negative
Reinforcing bearish momentum — this condition historically confirms that buyers are losing control of volume leadership.
Advance/Decline Oscillator Turns Negative
When all three internal breadth measures align to the downside, AIQ interprets this as a strong probability of a continued short-term decline.
New High/New Low Indicator Reverses to the Downside
This is one of the system’s most reliable bearish signals. In a sideways market, it often marks the early stage of a new downtrend.
?? Recent Market HistoryOctober 7, 2025: Confirmed down signal. Followed by a 110-point market drop over the next three days. Driven by internal breadth weakness and a reversal in the New High/New Low indicator.
October 13–14: Two short-lived buy signals appeared but were not confirmed by phase change — indicating limited upside conviction.
October 16, 2025: Confirmed strong sell signal (100 strength) — multiple bearish rules aligned across price, volume, and breadth.
?? AIQ’s InterpretationIn the current sideways-to-rolling-over market, the system views this cluster of signals as a warning that a new short-term downtrend may be underway.
While confirmation from price action is still developing, internal data — especially breadth and volume metrics — show deterioration beneath the surface.
Traders should remain cautious, tighten stops on long positions, and prepare for potential follow-through to the downside.
?? Key TakeawayAIQ TradingExpert Pro’s expert system is once again highlighting the power of combining breadth, volume, and price phase indicators to identify turning points before they appear in the indexes.
The October 16 cluster of bearish rules echoes the early October pattern — suggesting that weakness beneath the surface is deepening, and the path of least resistance may remain downward in the near term.
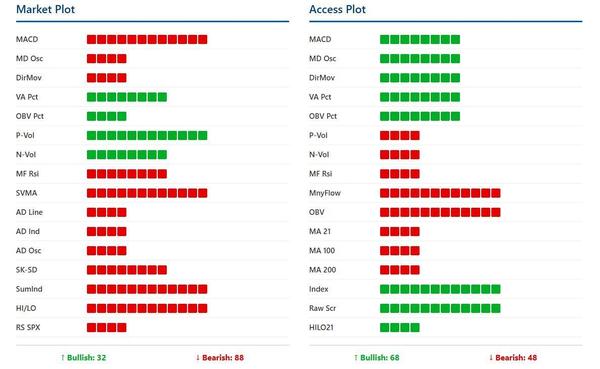
The visual representation below of the AI system on 10-16-25 on the market shows a majority bearish sentiment in the internal market indicators, whereas the Access Plot (all 500 of the SP 500 stocks measured by technical indicators) shows a mixed sentiment.
|
AIQ Systems
Stephen Hill
CEO
|
|


