Top Countries Behind U.S. Tariff Revenue
October 20, 2025
By Julia Wendling
Graphics & Design
The following content is sponsored by Terzo

Top Countries Behind U.S. Tariff Revenue
Key Takeaways- At the beginning of 2025, the United States implemented higher tariff rates on imported goods from many major trading partners.
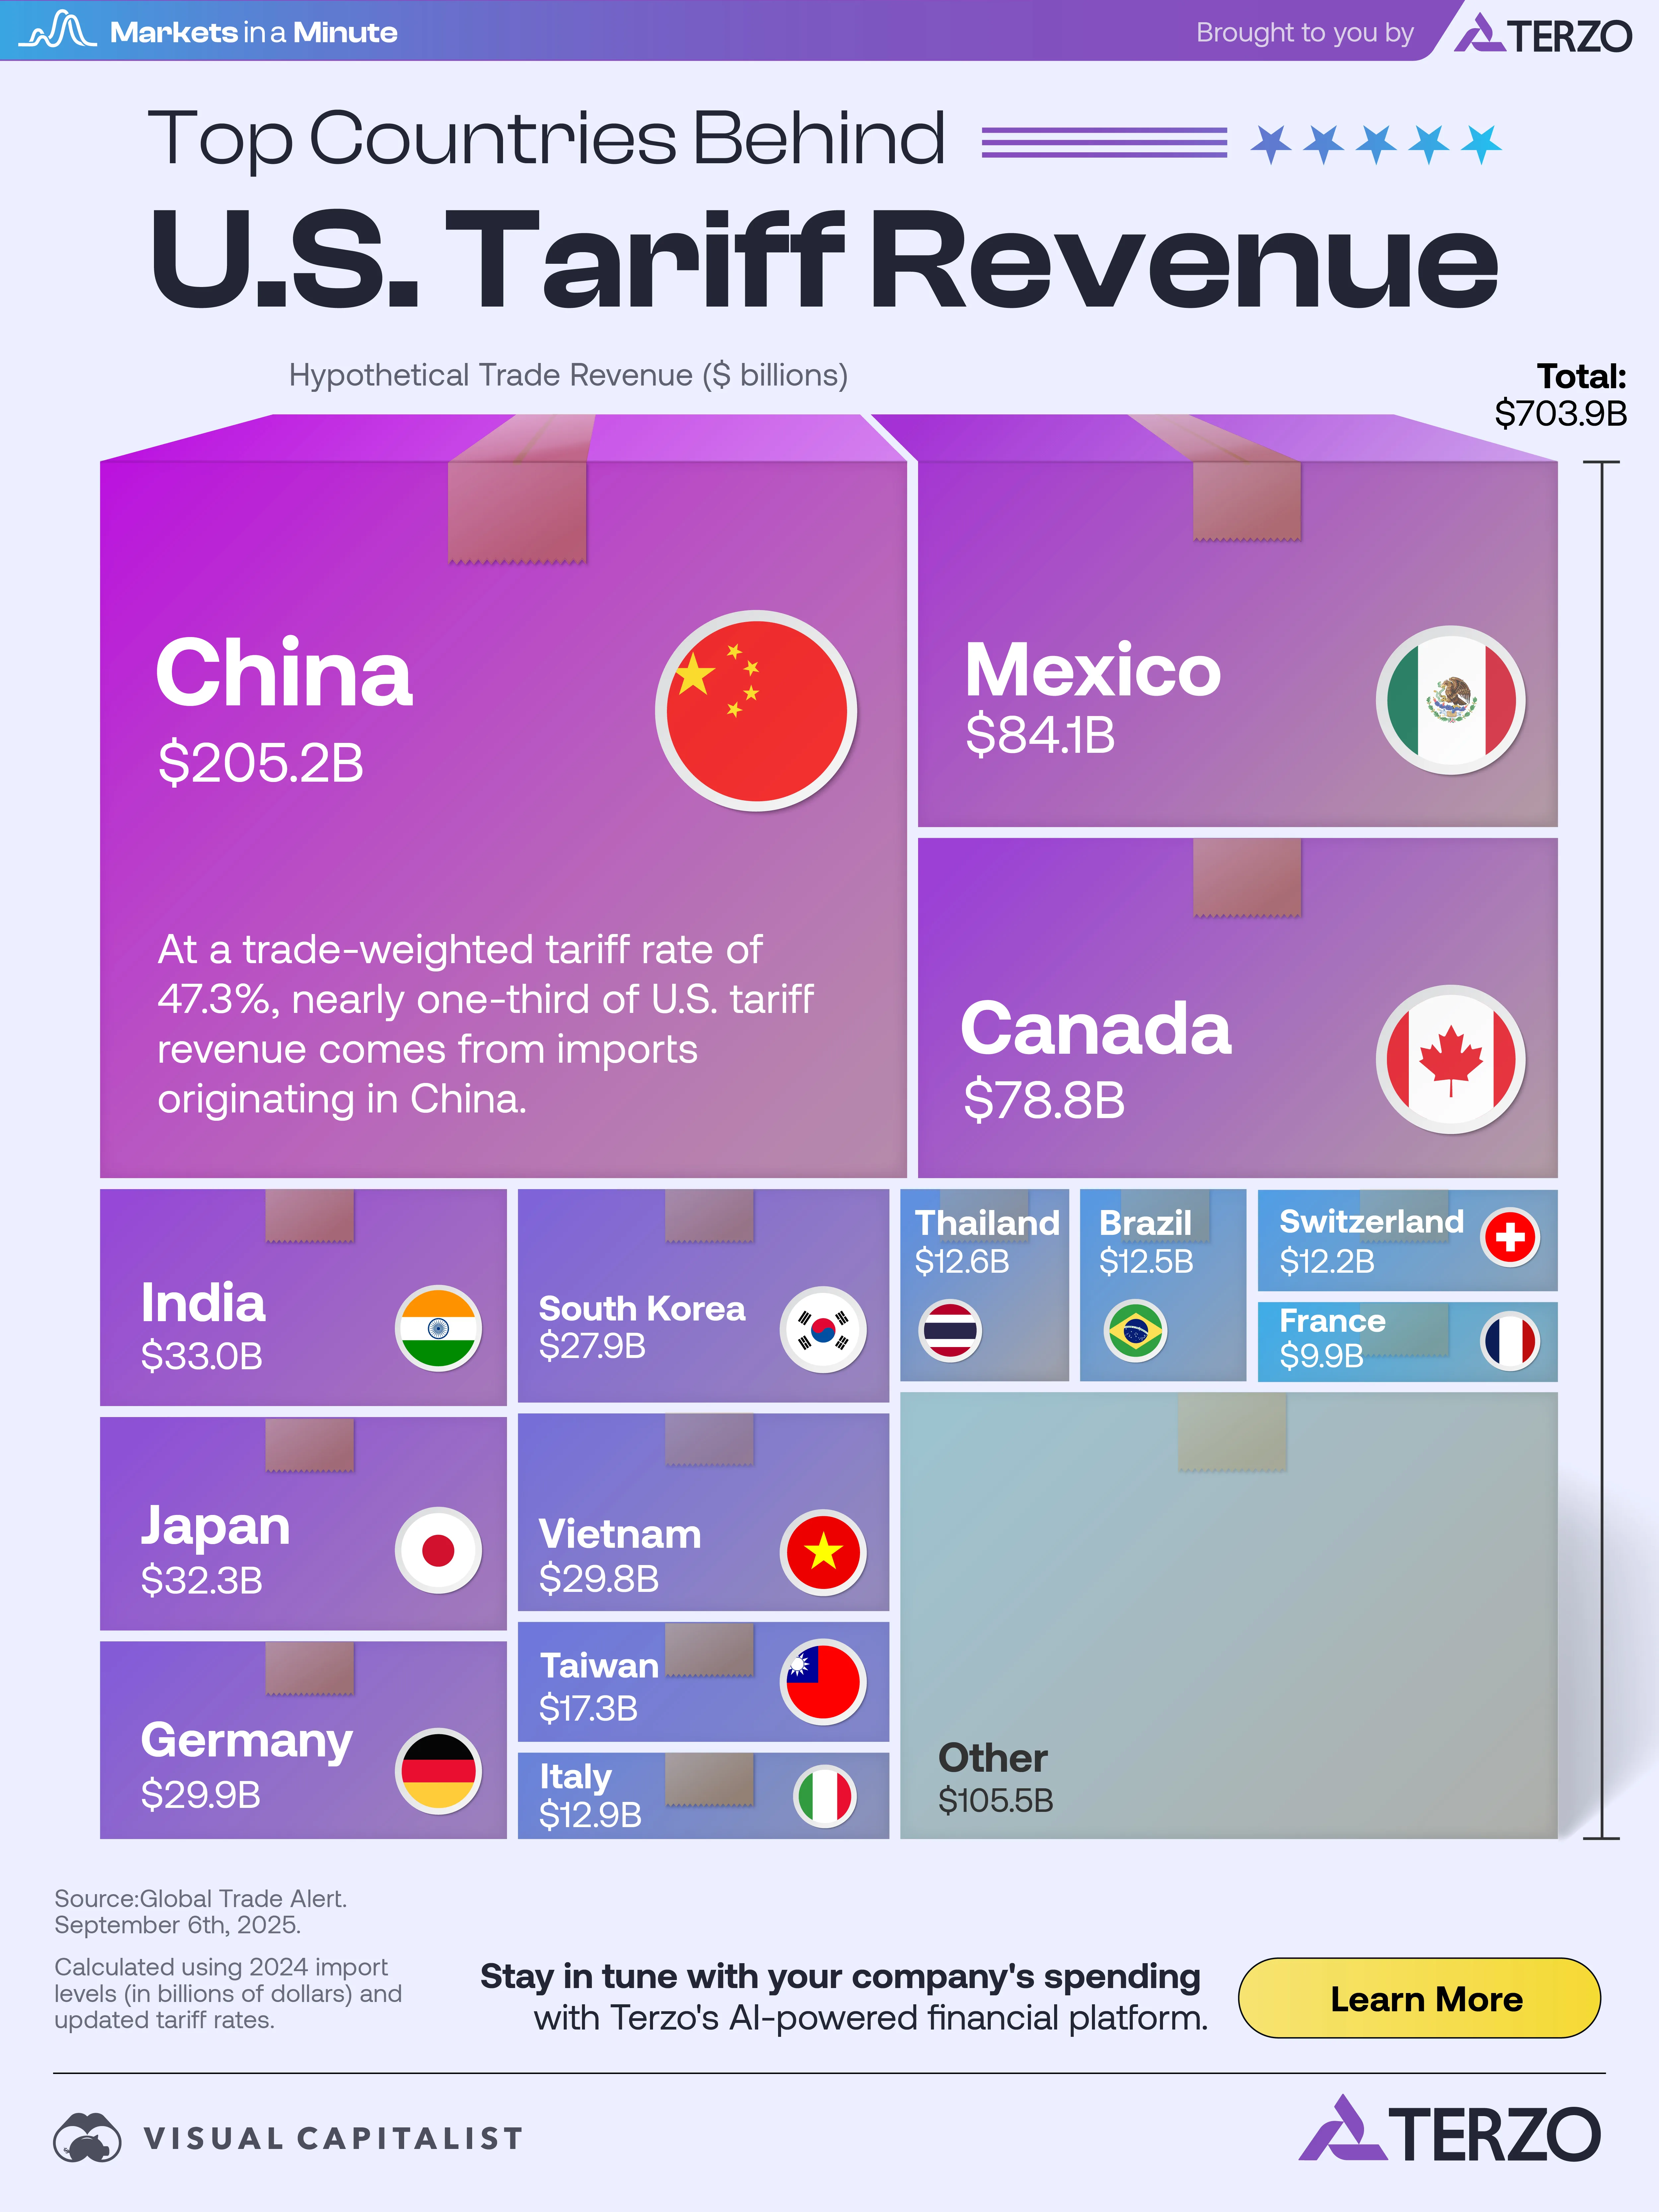
- At a trade-weighted tariff rate of 47.3%, nearly one-third of U.S. tariff revenue is collected on imports originating from China.
- Despite long-standing free trade agreements under NAFTA and later the USMCA, imports from Mexico and Canada now generate the second- and third-highest tariff revenues for the U.S.
Tariff rates vary by country, as does the value of goods each nation exports to the U.S. As a result, their contributions to U.S. tariff revenue differ significantly.
In this Markets in a Minute graphic, created in partnership with Terzo, we break down which countries generate the most U.S. tariff revenue through imports under the new rates.
Top Sources of U.S. Tariff Revenue by Country
Amid rapidly shifting trade policies, exact revenue figures are hard to confirm. Global Trade Alert approximated tariff revenue by applying current tariff rates to 2024 import data. The data comprises the country’s top 20 trading partners.
Here are the results:
Exporter Hypothetical Tariff Revenue ($ billions)|
| China | 205.2 | | Mexico | 84.1 | | Canada | 78.8 | | India | 33.0 | | Japan | 32.3 | | Germany | 29.9 | | Vietnam | 29.8 | | South Korea | 27.9 | | Taiwan | 17.3 | | Italy | 12.9 | | Thailand | 12.6 | | Brazil | 12.5 | | Switzerland | 12.2 | | France | 9.9 | | Other | 105.5 |
China’s imports top the list, generating an estimated $205.2 billion in U.S. trade revenue. This is nearly 30% of the projected $703.9 billion total. The high volume of Chinese imports and a steep trade-weighted tax rate of 47.3% largely drive this.
Despite long-standing free trade agreements under NAFTA and later the USMCA, imports from Mexico and Canada now generate the second- and third-highest trade revenues for the country. They totaled $84.1 billion and $78.8 billion, respectively.
Other Trading Partners
The remaining $335.7 billion is split between imports from a variety of countries. India ($33.0 billion) and Germany ($32.3 billion) are also estimated to be heavy contributors.
The U.S. once considered imposing punitive tariffs on Switzerland before reversing the proposal. As a result, its imports are estimated to contribute $12.2 billion.
Uncertainty Ahead
With geopolitical tensions and trade dynamics evolving quickly, policies may continue to shift. Investors can benefit from staying informed on these macroeconomic developments. |


