Extreme Temperature Diary- Monday December 8th, 2025/Main Topic: U.S. November and Fall 2025 Record Scoreboard and Climatological Review – Guy On Climate
Dear Diary. It’s time for our monthly climatological review. Here on this site, we usually present monthly summaries near the 8th of each month, and each is available by clicking the link below:
guyonclimate.com
I’m repeating this mantra every month:
Some people ask me, why track record temperatures? More heat does not affect me, so why should I care? Because record warmth is a big symptom of the climate's health over the last few decades, giving us warning of what may come. Heed the drip drip drip coming into the Titanic. @katharinehayhoe.com — Guy Walton..."The Climate Guy" (@climateguyw.bsky.social) 2025-09-09T20:28:25.534Z
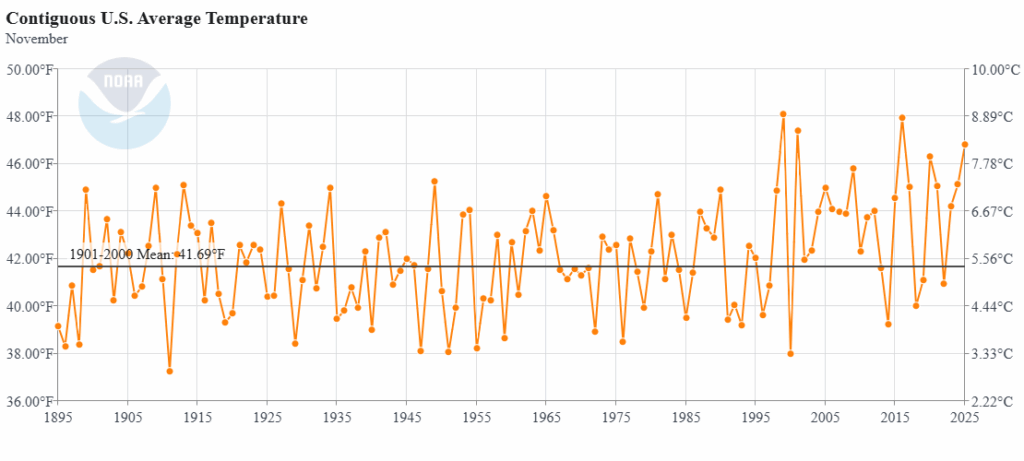
November 2025 got ranked by the National Center for Environmental Information for the lower 48 states as 4th warmest or 128th coolest since records began being kept in 1895 at +5.12°F above the 1901-2000 average.
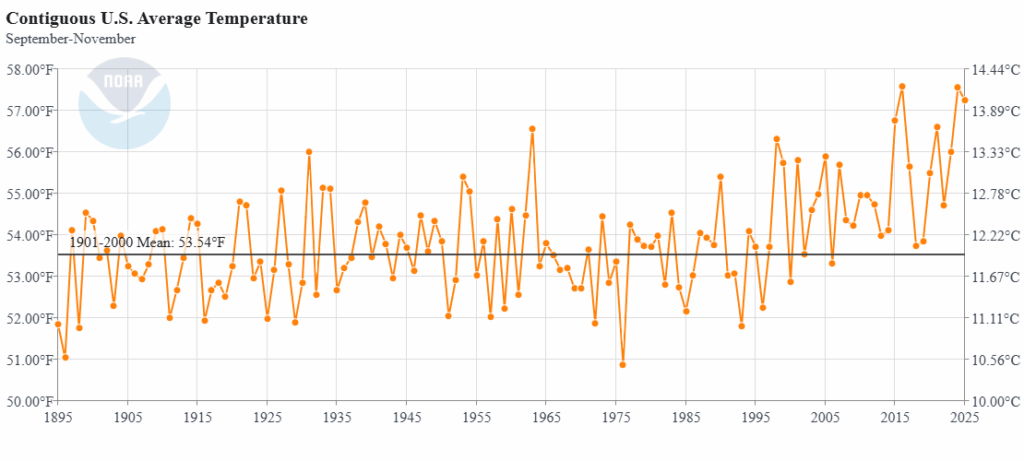
  Fall 2025 got ranked by the National Center for Environmental Information for the lower 48 states as 3rd warmest or 129th coolest since records began being kept in 1895 at +3.7°F above the 1901-2000 average. Fall 2025 got ranked by the National Center for Environmental Information for the lower 48 states as 3rd warmest or 129th coolest since records began being kept in 1895 at +3.7°F above the 1901-2000 average.
  The above data was from: The above data was from:
ncdc.noaa.gov
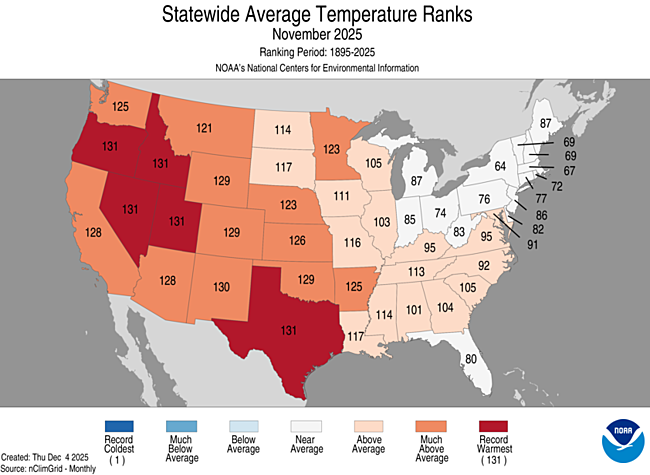
During November the warmest conditions were in the western and central portions of the nation. Many western states and Texas had their record warmest November and fall. Reports of record chill were quite sparse nationwide. Most reports of record warmth occurred in the western part of the nation.
You can check out record totals for yourself on my NCEI record archives:
NCEI Record Count Archive – Guy On Climate
Here are my two U.S. Daily Record Scoreboards updated through 12/08/2025 (data compiled from the following NCEI site):
ncdc.noaa.gov
I’m also keeping tabs on record report totals to verify a scientific study I helped to complete in the decade of the 2000s. We’ll eventually see how skewed ratios of record warm to cold reports get by the year 2100, which the study mentions as 50-1 for DHMX vs. DLMN:
Relative increase of record high maximum temperatures compared to record low minimum temperatures in the U.S. – Meehl – 2009 – Geophysical Research Letters – Wiley Online Library
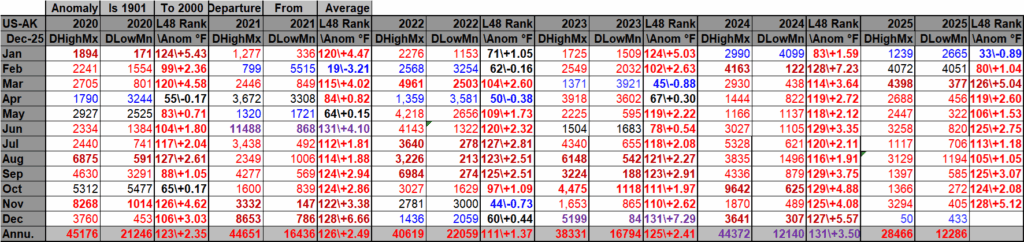 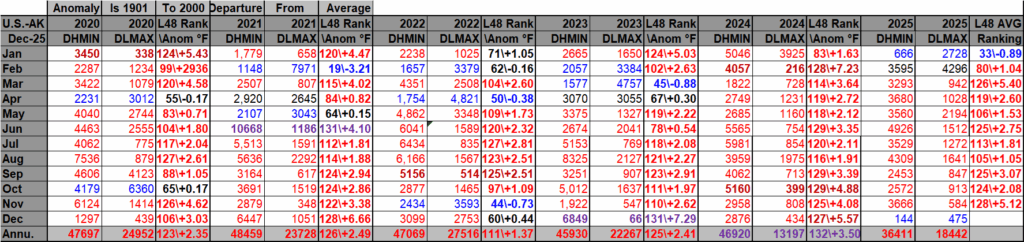 DHMX= Daily High Max Reports. DLMN= Daily Low Min Reports. DHMN= Daily High Min Reports. DLMX=Daily Low Max Reports. DHMX= Daily High Max Reports. DLMN= Daily Low Min Reports. DHMN= Daily High Min Reports. DLMX=Daily Low Max Reports.
Boldly highlighted red, blue, or purple colored months, such as December 2023 and June 2021, that have ratios of >10 to 1 daily or <1 to 10 of daily warm to low records are either historically hot or cold, most of which have made news. NCEI rankings are for the lower 48 states with the warmest ranking since 1895 of average temperatures being 131 and 1 being the coldest as of 2025. Blue colors represent cold months and red warm. Those months and years with counts close to a 1 to 1 ratio of highs to lows are colored black. All-time record hottest or coldest months and years are boldly colored in purple. NCDC rankings have been color coded (under tabs in each file) such that values of 55 to 75 are black representing neutral months or years (+ or – 10 from the average ranking of 64).
Totals are record reports for the entire United States including all territories minus those from Alaska. I’ve subtracted those from Alaska to get a better representation of what has occurred across the lower 48 states in association with lower 48 state rankings.
November 2025 had approximately a 14 to 3 ratio of record DHMX to DLMN individual record counts, so the color I used for that month was dark red on the top chart.
November 2025 had approximately a 37 to 6 ratio of record DHMN to DLMX individual record counts, so the color I used for that month was red on the bottom chart.
Due to climate change, we are seeing fewer blue colors on these Record Scoreboards with time.
The average temperature lower 48 state ranking for November 2025 was 128, which was colored red since it was warmer than average. We are seeing fewer blue colors on my charts, and November 2025 was yet another red or warm month.
I color rankings of +10 to -10 from the average ranking for the lower 48 states of 65 black, indicating that these are near average temperature wise. The top warmest ranking for 2025 would be 131 since rankings began in 1895.
Looking at the type and number of record reports, December 2025 has gotten off to a cold start, start, but meteorological models are consistently forecasting a warming trend for the rest of the month except across the northeast third of the nation. Will 2025 get book ended by two colder than average winter months? Stay tuned.
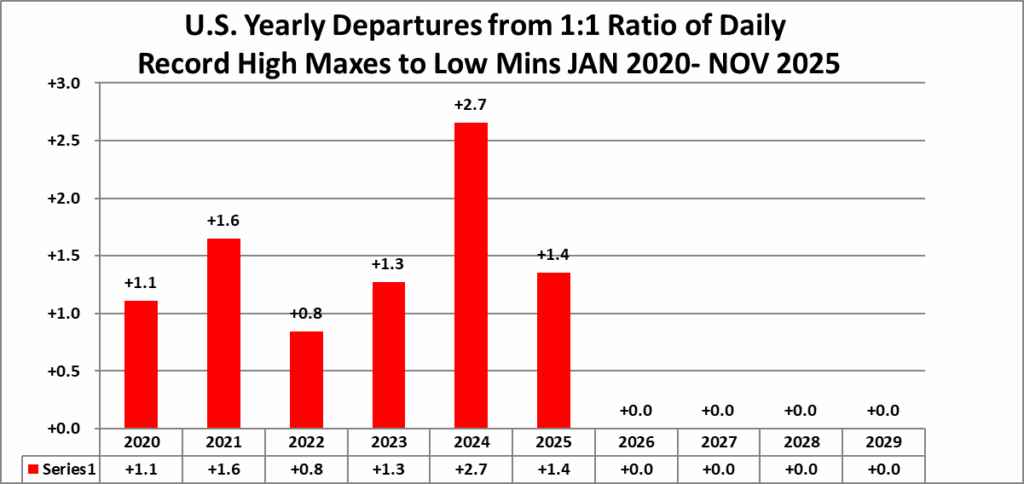
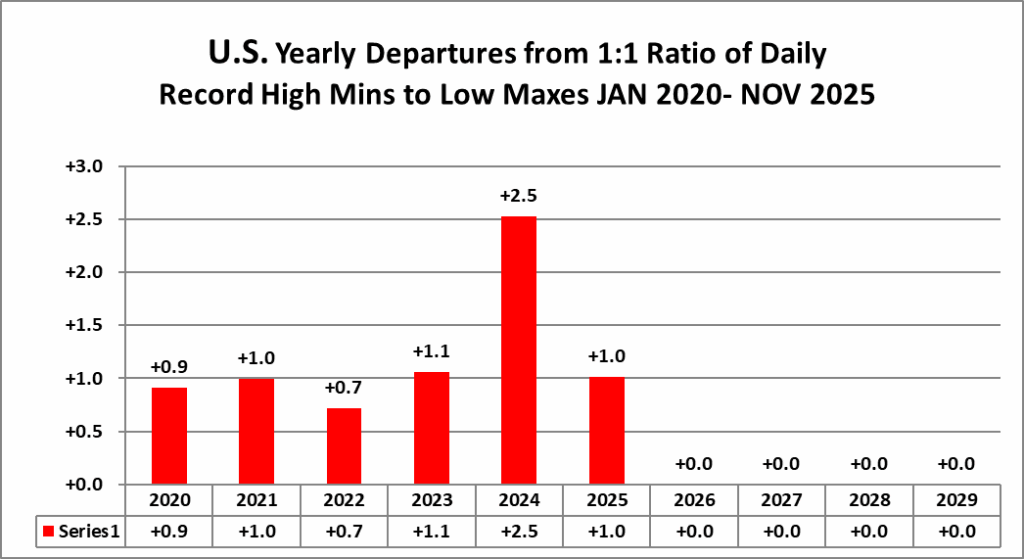
Interestingly, here is what we see as far as overall yearly ratios go for the 2020s so far. Warmth is key here:
  Here is much more detailed climatology for November and Fall 2025 as complied by NOAA: Here is much more detailed climatology for November and Fall 2025 as complied by NOAA:
Assessing the U.S. Temperature and Precipitation Analysis in November 2025 | News | National Centers for Environmental Information (NCEI)
Assessing the U.S. Temperature and Precipitation Analysis in November 2025November and fall rank among warmest on record and it was exceptionally dry across much of the East Courtesy of Canva.com Courtesy of Canva.com
Published December 8, 2025
Key Points:- November was unusually warm nationwide, ranking as the fourth warmest on record, with five states setting November temperature records.
- Meteorological fall ranked third warmest on record, with seven states setting fall temperature records.
- Dry conditions dominated the eastern U.S., with the Southeast seeing its driest fall since 1978.
 Map of the U.S. notable weather and climate events in November 2025.Other Highlights:TemperatureThe average temperature of the contiguous U.S. (CONUS) in November was 46.8°F, 5.1°F above the 20th-century average, ranking as the fourth-warmest November in the 131-year record. Much-above-average warmth covered most of the western and central U.S., while much of the eastern third remained near average. Five states—Idaho, Nevada, Oregon, Texas and Utah—set new statewide records for November temperature, with Utah (44.4°F) surpassing its 2017 record by more than 1°F. New Mexico had its second-warmest November and Colorado, Oklahoma and Wyoming each recorded their third warmest. At the county level, 100 Texas counties set new records for their warmest average November temperatures, with 30 counties recording average daily highs more than 10°F above the 20th-century average. Map of the U.S. notable weather and climate events in November 2025.Other Highlights:TemperatureThe average temperature of the contiguous U.S. (CONUS) in November was 46.8°F, 5.1°F above the 20th-century average, ranking as the fourth-warmest November in the 131-year record. Much-above-average warmth covered most of the western and central U.S., while much of the eastern third remained near average. Five states—Idaho, Nevada, Oregon, Texas and Utah—set new statewide records for November temperature, with Utah (44.4°F) surpassing its 2017 record by more than 1°F. New Mexico had its second-warmest November and Colorado, Oklahoma and Wyoming each recorded their third warmest. At the county level, 100 Texas counties set new records for their warmest average November temperatures, with 30 counties recording average daily highs more than 10°F above the 20th-century average.
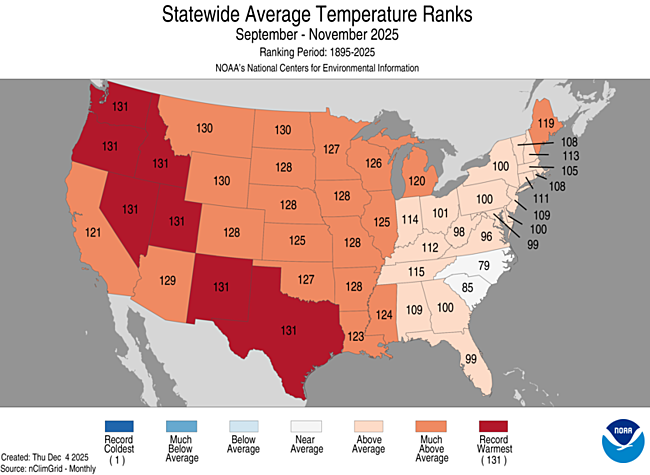
 November U.S. Mean Temperature Percentiles MapFor meteorological fall (September–November), the CONUS average temperature was 57.2°F, 3.7°F above average, ranking as the third-warmest fall in the 131-year record. Apart from the Carolinas, all CONUS states had fall temperatures more than 1°F above the 20th-century average, and seven states—Idaho, Nevada, New Mexico, Oregon, Texas, Utah and Washington—set new statewide fall temperature records. Nationwide, 275 counties—nearly 15 million people—experienced their warmest fall temperatures on record. November U.S. Mean Temperature Percentiles MapFor meteorological fall (September–November), the CONUS average temperature was 57.2°F, 3.7°F above average, ranking as the third-warmest fall in the 131-year record. Apart from the Carolinas, all CONUS states had fall temperatures more than 1°F above the 20th-century average, and seven states—Idaho, Nevada, New Mexico, Oregon, Texas, Utah and Washington—set new statewide fall temperature records. Nationwide, 275 counties—nearly 15 million people—experienced their warmest fall temperatures on record.
Alaska’s statewide November temperature was 17.3°F, 5.6°F above the 1925–2000 average, ranking in the warmest third of the 101-year period of record for the state. The state was especially warm across parts of the Interior and the North Slope, which had its fifth-warmest November on record—more than 11°F above the long-term average. For the fall season, Alaska’s average temperature was 30.2°F, 4.3°F above average and the tenth warmest on record.
For November, Hawai’i had an average temperature of 66.9°F, 0.4°F above the 1991–2020 average, ranking in the warmest third of the 35-year record. Fall temperatures also ranked in the warmest third of the historical record.
Precipitation November precipitation for the CONUS was 1.70 inches, 0.53 inch below average, ranking in the driest third of the 131-year record. Precipitation was below average across much of the U.S. east of the Mississippi River, with the Southeast region experiencing its sixth-driest November on record. The Southeast region averaged just 1 inch of rainfall for the month—less than 35% of the 20th-century average. South Carolina had its second-driest November, marking its lowest November rainfall since 1931, while Florida received less than 15% of its average rainfall for its third-driest November. In contrast, precipitation in the West was mixed; portions of California and the Southwest recorded above-average rainfall, while parts of the northern Great Basin, Northwest and Rockies received below-average precipitation.
 November 2025 U.S. Total Precipitation PercentilesThe fall season (September–November) was also dry for the CONUS, with a total of 5.97 inches of precipitation, 0.91 inch below average, ranking in the driest third of the record. While much of the Northwest and Rockies received near-average precipitation, wetter-than-average conditions prevailed in the Southwest and Plains, with several counties in southern California and southeastern Arizona recording their wettest fall on record. Further east, below- to much-below-average precipitation was seen across the middle and upper Mississippi Valley and Great Lakes, as well as a region stretching from the southern Plains across much of the South, Southeast, Mid-Atlantic and Northeast. The Southeast region recorded its driest fall since 1978 (sixth driest on record), with Georgia receiving less than half of its seasonal average for its fourth-driest fall. However, in contrast to the widespread dry trend in the east, parts of the Ohio Valley received above-average rainfall. November 2025 U.S. Total Precipitation PercentilesThe fall season (September–November) was also dry for the CONUS, with a total of 5.97 inches of precipitation, 0.91 inch below average, ranking in the driest third of the record. While much of the Northwest and Rockies received near-average precipitation, wetter-than-average conditions prevailed in the Southwest and Plains, with several counties in southern California and southeastern Arizona recording their wettest fall on record. Further east, below- to much-below-average precipitation was seen across the middle and upper Mississippi Valley and Great Lakes, as well as a region stretching from the southern Plains across much of the South, Southeast, Mid-Atlantic and Northeast. The Southeast region recorded its driest fall since 1978 (sixth driest on record), with Georgia receiving less than half of its seasonal average for its fourth-driest fall. However, in contrast to the widespread dry trend in the east, parts of the Ohio Valley received above-average rainfall.
Alaska’s average monthly precipitation in November was 2.99 inches, 0.40 inch below average, ranking in the middle third of the 101-year record. The September–November total was 12.91 inches, 0.59 inch above average and in the middle third of the record.
Precipitation across Hawai’i in November averaged 5.28 inches, 1.19 inches below average, ranking in the middle third of the 1991–2025 record. Fall precipitation was 11.70 inches (4.30 inches below average), ranking in the driest third of the record.
DroughtAccording to the December 2 U.S. Drought Monitor report, about 41.4% of the contiguous U.S. was in drought, down about 2.3% from the beginning of November. Drought contracted or was reduced in intensity across much of the western U.S., particularly the Southwest, Great Basin and parts of the Rockies and Northwest, as well as in portions of the middle Mississippi and Ohio Valleys and the Northeast. In contrast, drought developed or intensified significantly across the Southeast and in parts of the southern Plains and upper Mississippi Valley.
Monthly OutlookAbove-average temperatures are likely across much of the southern tier, from the central Rockies through the southern Plains and Southeast, while below-average temperatures are favored in the northern Plains, upper Midwest, Great Lakes and Northeast. Above-average precipitation is expected in parts of the northern Rockies and northern Plains, and along the Gulf Coast through the Carolinas and into the Northeast, while below-average precipitation is favored across the central Plains and Florida Peninsula. Visit the Climate Prediction Center’s Official 30-Day Forecasts for more details.
Drought improvement or removal is expected in parts of the Northwest and northern Rockies, the western and central Gulf Coast, much of Alabama and Georgia, the Great Lakes, the Mid-Atlantic, the Northeast and Hawai’i. In contrast, drought is likely to persist or worsen across the central and southern Rockies, portions of the Plains, the middle and upper Mississippi Valley and the Florida Peninsula, with expansion likely in western Texas and eastern New Mexico. Visit the U.S. Monthly Drought Outlook website for more details.
Significant wildland fire potential in December is above normal across portions of western Texas and western Oklahoma, as well as southern Georgia and north-central Florida. For additional information on wildland fire potential, visit the National Interagency Fire Center’s One-Month Wildland Fire Outlook.
For more detailed climate information, check out our comprehensive November 2025 U.S. Climate Report scheduled for release on December 11, 2025. For additional information on the statistics provided here, visit the Climate at a Glance and National Maps webpages.
The autumn 2025 Arctic climate summary is now posted in the Alaska and Arctic Climate newsletter. Spoiler: mildest autumn on record across the Canadian North. #Arctic #Climate #Canada #Autumn2025
alaskaclimate.substack.com/p/autumn-202... — Rick Thoman (@alaskawx.bsky.social) 2025-12-06T22:38:40.628Z
Here are some “ETs” recorded from around the planet the last couple of days, their consequences, and some extreme temperature outlooks, as well as any extreme precipitation reports:
It appears that the U.S. Environmental Protection Agency (EPA) has, within the past week, scrubbed a large amount of climate change content from its official website, as well as *removed human-caused warming* from the discussion on its "causes of climate change" page.
— Daniel Swain (@weatherwest.bsky.social) 2025-12-08T17:50:22.000Z
More than 200 environmental groups demand halt to new US #AI datacenters
Congress urged to act against energy-hungry facilities blamed for increasing bills and worsening climate crisis
www.theguardian.com/us-news/2025... — Dr Paul Dorfman (@drpauldorfman.bsky.social) 2025-12-08T14:35:11.553Z
Education program sponsored by Shell’s Queensland Gas Company is ‘climate obstruction dressed up as education’
www.theguardian.com/australia-ne... — Dr Paul Dorfman (@drpauldorfman.bsky.social) 2025-12-08T14:37:15.077Z
In a warmer world moisture transports do not only intensify - on an event basis massively - but also the distance increases...
#earth #climate — (@umsonst.bsky.social) 2025-12-08T17:11:37.580Z
"It is therefore vital that #climate change projections of European hydroclimate for the (far) future consider the possibility of #AMOC changes, & the exacerbated effects this would have on projected regional hydrological changes & consequences for ecosystems & society" — Dr. Aaron Thierry (@thierryaaron.bsky.social) 2025-12-07T17:43:06.486Z
The @uniofreading.bsky.social authors of @ipcc.bsky.social 7th assessment met in Paris with 2 @unirdg-met.bsky.social covering physical processes & climate stabilisation pathways + 1 @unirdg-law.bsky.social on #climate law aspects of mitigation:
www.ipcc.ch/assessment-r... — Richard Allan (@rpallanuk.bsky.social) 2025-12-07T14:39:57.367Z
Rather interesting collection of @natureportfolio.nature.com Climate Action papers, if I may say so myself:
Just out: A special issue I co-edited on the "Behavioral economics of climate action," with papers on everything from Veggie Days to carbon pricing
Intro: gwagner.com/climate-action-behavior — Gernot Wagner (@gwagner.com) 2025-12-07T20:39:02.752Z
🎥
Facing #Climate Anxiety: Turning Fear Into #ClimateAction
more📖 myzerocarbon.org/Blog/How-to-...
PL RP🩷💚💙
@iwillnotbebroken.bsky.social @rimaanabtawi.bsky.social
@redloribrighteyes.bsky.social @sisterswendy.bsky.social @beenthiswayb4.bsky.social @boulderjamie.bsky.social @robe87.bsky.social — My Zero Carbon #ClimateAction (@myzerocarbon.org) 2025-12-08T15:43:26.732Z
Unbelievable rain totals for dry season!
Almost 3 Decembers worth of rain in 24 hours in spots.
Normal Dec rain is 2.5”. Downtown Tampa had double that!
Areas like Tarpon Springs, Palm Harbor, East Lake, Odessa, Trinity, Keystone, Lutz, Wesley Chapel etc.., had 5 to 7 inches. — Jeff Berardelli (@weatherprof.bsky.social) 2025-12-08T01:52:24.563Z
Florida, don’t let the coming chill break your stride! Chilly, not cold, starts to the days through the rest of the week. #cold #weather #florida — Jeff Berardelli (@weatherprof.bsky.social) 2025-12-08T15:23:59.206Z
Autumn over 25 percent of Alaska had less sunshine than any other autumn since 1979 (start of the satellite era), including most of Southcentral and the central and eastern Interior. On the other hand, much more sun than usual on St. Lawrence Island. #akwx #Climate H/T @climatologist49.bsky.social — Rick Thoman (@alaskawx.bsky.social) 2025-12-07T21:16:51.340Z
New “shovel-ready” wind, solar and battery power projects jumping to front of queue to connect to UK electricity grid.
nation.cymru/news/shovel-... — Dr Paul Dorfman (@drpauldorfman.bsky.social) 2025-12-08T10:14:31.569Z
Wind power now main source of electricity from North Sea, overtaking gas
eciu.net/media/press-... — Dr Paul Dorfman (@drpauldorfman.bsky.social) 2025-12-08T10:20:19.549Z
'UK second to China in offshore wind capacity, making the country a magnet for global investment, preserving energy security. Ignore negative noise; UK energy transition real and necessary.
Each gigawatt new offshore wind adds £2 - £3 billion to UK economy.'
www.thetimes.com/comment/colu... — Dr Paul Dorfman (@drpauldorfman.bsky.social) 2025-12-08T10:07:17.806Z
'I keep hearing claims, most recently from UK Govt, about how nuclear can be used flexibly to help balance fluctuating wind and solar. But in reality nuclear is inflexible and pushes wind and solar off the grid.'
davidtoke.substack.com/p/nuclear-in... — Dr Paul Dorfman (@drpauldorfman.bsky.social) 2025-12-08T10:12:19.396Z
bbc.com/news/article... — Dr Paul Dorfman (@drpauldorfman.bsky.social) 2025-12-08T10:04:19.804Z
"The West’s Last Chance - How to Build a New Global Order Before It’s Too Late" | Must-read piece (that overlaps thematically with our recent book #ScienceUnderSiege) by Alexander Stubb, President of Finland, in the latest Foreign Affairs: www.foreignaffairs.com/united-state... — Michael E. Mann (@michaelemann.bsky.social) 2025-12-07T22:45:41.313Z
MONDAY BLUES
The Sting Rays' eco-task of aerating sediment is undermined by plastic pollution, which clog gills & reduces foraging efficiency.
Plastic polluted hotspots like the Great Pacific Garbage Patch, compounds overfishing, habitat loss & #climate change.
🦋LJC
Split #photography Dalton Hamm — Linda J. Crane (@earthkeeper22.bsky.social) 2025-12-08T10:11:45.346Z
DAY 7, #quotes
One recommendation I must add: The simulations. Two in particular. Number one: What is a world missing where everyone is in tune with their bodies?
🧵🎺
#photography #body #resist #simulations #scenarios #nature #climate #OurFutureDay7 #OurFuture #forests #forestfriends #theroad — Charlie Alice Raya (@charlie-alice-raya.org) 2025-12-08T17:15:51.351Z
|


