| | | From Macro Charts Feb 1st. He did comprehensive top analysis on 1/25 and sent a top alert on 1/29.
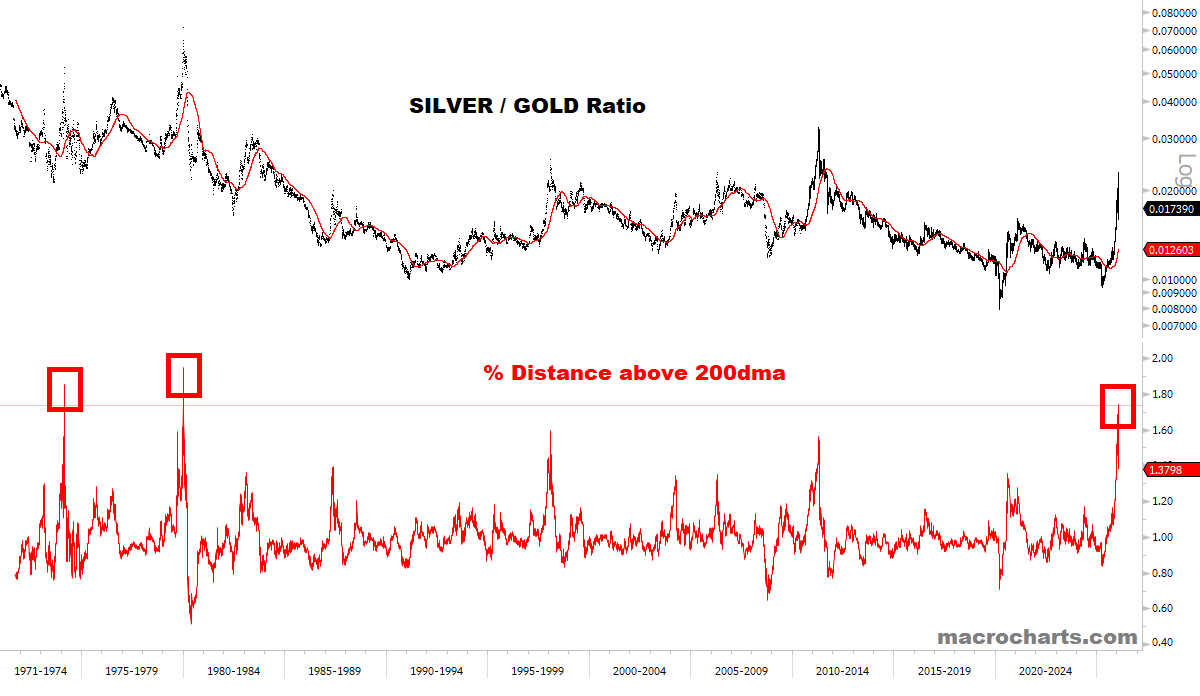
New candidate for ‘chart of the year’:
- On January 27, the Silver/Gold ratio closed at 1.74x above its 200dma.
- Only three days ever reached this level.
- In 1974, the Silver/Gold ratio traded there two days — February 26-27. February 26 was the exact top. The ratio collapsed 50% over the next 2 months.
- In 1980, the Silver/Gold ratio traded there ONE day — January 2. It was the exact top. The ratio collapsed 70% over the next 4 months.
- The ratio topped there this week and dropped 20% (Silver down 27%, Gold down 10%).
- At its low on Friday, the ratio was down 32% from its high
Which means: almost no one is prepared for what’s next.
So let’s prepare.
Is this enough for a bottom?
Not really:
?Every time the ratio put in a top, it collapsed back to the 200dma (in Bull Markets like 2004/2006 it even undercut the 200dma).
?If it was a secular top, the ratio went well below the 200dma for years after.
? Let’s be conservative and say the ratio has NOT made a secular top, remains in a Bull Market, and will retest/undercut its 200dma — which would be normal — for a drop of ~27% (based on the current value of the 200dma, which is rising).
? That could be achieved with Silver trading roughly at ~$56 (slightly below its 100dma), and Gold trading at ~$4470 (its 50dma).
? This would be an additional 9% decline for Gold, and 34% decline for Silver — before a “proper” bounce attempt begins.
? Of course, the moving averages are rising, so we’ll adjust estimates over time.
? These potential targets also tie closely with the ideal 100dma target for Silver, aligned with historical collapses (as discussed Thursday).
RECORD LEVERAGE, RECORD DROP
The record declines in the Metals on Friday (1) illustrate the scale of deleveraging, and (2) strongly suggest leverage was at the highest ever.
No market coming off a record high would stage a 75-year record decline, if it wasn’t extremely unstable/levered to begin with.
Friday was the biggest % decline in Silver’s history (-26%): |
|


