Where are Precious Metals Headed in 2008?
posted on: March 18, 2008 |
about stocks: ABX / AUY / DBS / DGL / EGO / GG / GLD / IAU / NEM / SLV
seekingalpha.com
Precious metals have appreciated considerably amidst of all the mess within the US economy. Gold has pushed from under $300 an ounce in 2002 to over $1000 - an all time high in nominal terms, while silver during the same time period rose from under $5 an ounce to over $20.
There is currently much debate over whether this secular bull market for precious metals will continue, or whether it will reverse. Many investors still remember the speculative high of $850 per ounce of gold in 1980 which caused a lot of people to lose money. This article will attempt to argue that precious metals will likely maintain their price levels this time around. We will look at relevant factors such the Gold Cartel, Money Supply Growth, Demand and Supply, The Hayekian Principle and Technical Analysis.
Gold Cartel Losing Strength
The gold rush has only recently been widely published in mass media. Previously gold was shadowed by the stock market boom from 2005 to 2007 by the federal government and the gold cartel. The gold cartel is an alliance between a few of the big bullion trading banks, several central banks with large gold holdings and the US government. This group tries to manage and control the gold price to their advantage, regardless of the disruption they cause to the free-market. Each of the cartel members has their own agenda. The US government for example aims to make the dollar look worthy of being the world’s reserve currency; the government accomplishes this by keeping the price of gold low.
Having a low price of gold suppresses the demand for gold and diverts the demand instead to the dollar. Note that the US dollar became a fiat currency in 1971 having removed any connections to the weight of gold. The central bank members within the cartel follow the US government command; they are also fiat currency, and hence want to keep the price of gold low. The bullion banks within the cartel are there to execute central bank commands, since the central banks themselves cannot actively trade gold.
Since the gold cartel has been shorting gold from the $300 level several years ago, they’ve found it increasingly harder to keep gold prices down due to growing demand for the commodity and devaluation of the US dollar. The tremendous short position accumulated over the years is not favorable for the cartel, especially when gold is at the $1000 level and is not looking to turn back any time soon. The cartel has lost the battle to keep gold prices down. What this means for gold is that if the cartel cover their positions in the next few years, then gold as some economists have already projected, may very well go beyond $3000.
Money Supply Growth
Money supply has been growing tremendously for several years; it was recently measured at a 17% annual growth rate, according to independent research. (See Exhibit 1.) The growth of money supply contributes to higher monetary inflation, which generates higher consumer price index. (See Exhibit 2.) With higher CPI comes rising interest rates. Gold performs strongly in this environment because investors question the purchasing power of the dollar and become nervous about the market uncertainty.
Manipulation by the US government has been a major reason for the increase in money supply. The government continuously shifts the blame to other factors such as greater fuel costs, or labor unions or corporations. Yet, we know the real culprit is the government, since prices would generally decrease in a free market economy. However, the government does not seem to have realized the problem, because it continues to request the Federal Reserve inflate the money supply, at increasing rates, and devaluing the dollar in the process. Although generally bad for the economy due to possibilities of hyperinflation, this trend has and will likely continue to contribute to the gold bull market.
Demand and Supply
A major reasons leading to the gold bull market goes back to economics 101 – increasing demand and decreasing supply for the metal. The increasing demand for gold is driven not only by large institutional investors who are losing confidence in the US dollar, but also by commercial industries and retail consumers in Jewelery, Retail, Industrial and Exchange Traded Funds. From Exhibit 3, we can see that the demand for gold has increased since 2003 but supply has continued to decrease. Supply has fallen by 4% from an already tight 2006 level. The constrain in the supply of gold has also restricted demand – since the metal cannot be purchased if it’s not available in the market.
China and India are two particular markets that have seen exceptional surge in demand for gold, due to the increased economic prosperity of these two countries. (Exhibit 4.) Greater china reached 363 tonnes in 2007, 23% above 2006 levels. This level of demand was good enough to overtake the United States to become the second largest retail market for gold Jewelery in volume, behind India. Looking ahead, gold demand will continue to rise and supply will likely continue to be constrained. This creates a favorable condition for the price of gold to continue to increase in the coming years.
The Hayekian Triangle
The Hayekian triangle is a heuristic device that gives analytical legs to a theory of business cycle. The right-angled triangle depicts the macroeconomy as having a value dimension and a time dimension. The bottom axis is essentially the entire value chain from raw materials to the consumer, and at each stage, there is a decrease in production time. For example, it takes longer to move from raw materials to retail than it is to go from wholesale to retail. The vertical axis is the output delivered to the consumers, or a measure of consumer spending. The slope of the triangle is the interest rate. The lower the rate of interest, the more it benefits businesses to invest in future capacity because it’s easier for projects to exceed the cost of capital. The higher the rate of interest, it is more difficult to increase capacity, because businesses can instead invest the money in long-term treasuries that pay a healthy interest without the risk. As a result, firms that are highly asset intensive like mining tend not to expand when interest rates are high. For the precious metal investor, this is a good sign since the Federal Reserve is undergoing another wave of interest rate cuts. Precious metal companies will be able to use the cash they have accumulated over the years to invest in greater exploration and production.
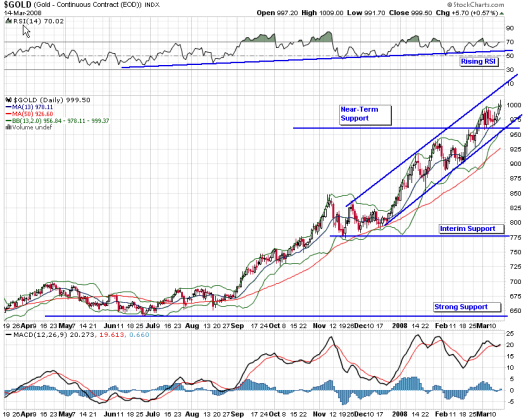
Technical Analysis
Let us now switch gears and look into the price action of gold over the past year to see if we can dissect where this commodity is headed. From the chart, we can see very aggressive growth especially in the past four month – likely due to the Fed interest rate cuts from 5% to 3% within a 2-3 month window. Both the 13 day and 50 day simple moving average are trending up. The commodity is trading in a healthy channel and does not show signs of breaking down. Short-term support is set at around $960 with medium range support at $755. The RSI has been increasing for some time now, which shows increasing momentum in the price action. In conclusion, most of the indicators are currently showing bullishness for gold.
As we have clearly shown in this report, gold is here to stay. Despite reaching record levels of $1000, there seems to be much more room for gold to grow in the coming months and years, as the M3 money supply continues to increase, driving up inflation and devaluing the dollar. For most investors, it is not too late to invest in this commodity. There are several ways to catch the gold rush:
1. Purchase futures contracts from NYMEX or CBOT.
2. Purchase stocks in the large gold producers such as Barrick Gold (ABX), Goldcorp (GG), or New Mont Mining (NEM) – although many of these have already significantly increased in share prices.
3. Purchase junior gold exploration or producer companies such as Yamana Gold (AUY), Alamos Gold [AGI.TO], or Eldorado Corp (EGO) – many of these smaller mining companies are lagging spot gold prices which may be a better play if you’re looking for greater returns (also higher risks).
4. Purchase gold ETFs such as the Streettracks gold shares (GLD).
5. Finally, for those people who do not want to take too much risk in the market, you may want to purchase gold bullion coins.
Appendix
Exhibit 1
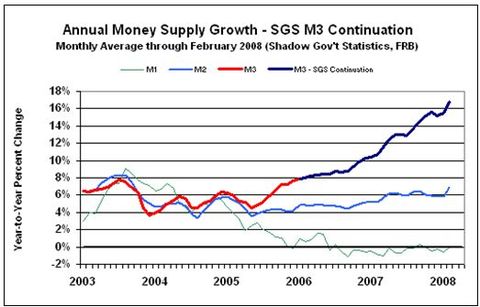
US Money Supply – 2003 - 2008
John Williams’ Shadow Government Statistics
Exhibit 2
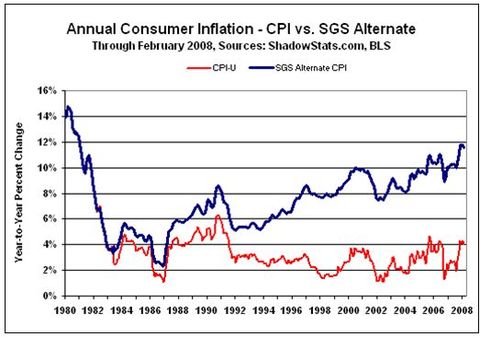
Reported CPI and Adjusted 1980-2008
John Williams’ Shadow Government Statistics
Exhibit 3
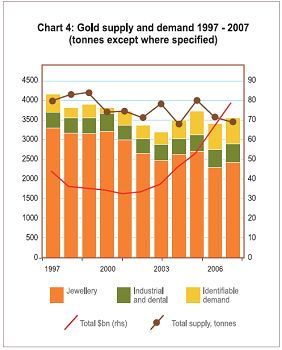
Gold Demand and Supply – 1997-2007
World Gold Council
Exhibit 4
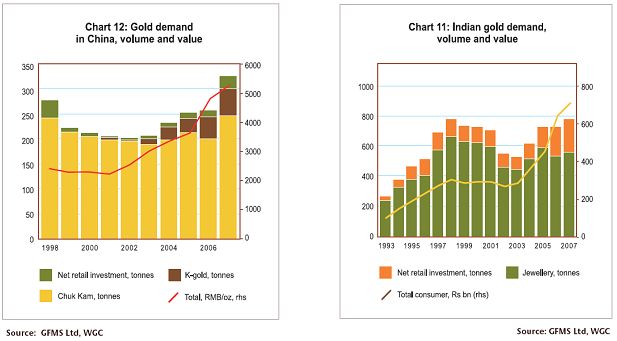
Gold Demand by China and India
World Gold Council
Exhibit 5
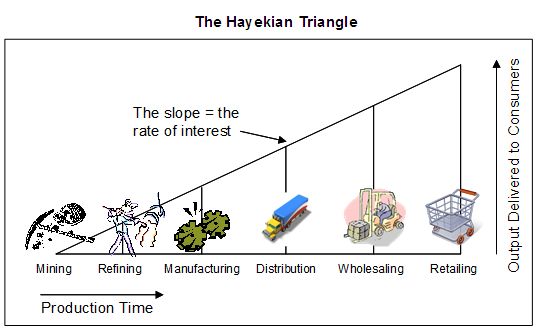
The Hayekian Triangle
Auburn University
Disclosure: Author holds long positions in some of the above-mentioned securities |


