As I said I can't speak to your family, but the general trend is to larger houses, larger and more powerful cars, more devices, gimmicks and conveniences in each, also more of each (more cars per household, even though people per household is down, and more people have a house).
but that was because they were not yet invented
But if they had been invented adding them would have added to the cost of the car. We have cars with these things now which is one way current cars are better.
Still I would rather have a larger faster car without cruise control over the dull cars we now have. Yes you can buy more exciting cars, but not easily with my budget.
A large fast car with cruise control would have cost a larger percentage of the typical person's income back then. Cars have gone up a lot in nominal price, but incomes have gone up more in nominal dollars.
And its not just cars. Generally people can buy things with a smaller portion of their income then in the past.
----------------------
As Share of Disposable Income, Food Is Still Cheap
 Just like with gas prices, we hear a lot about food prices being at record levels, but we don't hear as much about disposable income also being at record high levels. How do food prices compare to disposable personal income? Just like with gas prices, we hear a lot about food prices being at record levels, but we don't hear as much about disposable income also being at record high levels. How do food prices compare to disposable personal income?
According to data available from the USDA, expenditures on food as a share of disposable personal income have decreased from a high of 25.2% in 1933 to a low of 9.7% in 2004 (see chart above). In 2005 and 2006, there were insignificant increases to 9.8% and 9.9%, respectively...
mjperry.blogspot.com
The Rich Are Getting Richer and the Poor Are Getting Richer; The Good Old Days Are Now
Click to enlarge. 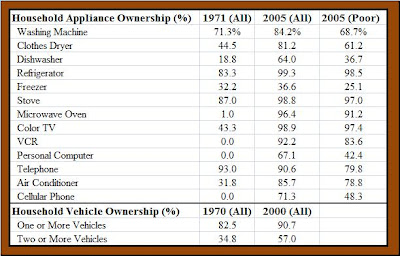 Steve Horwitz at the Austrian Economists blog has a good post based on Census Bureau data that were recently released on " Living Conditions in the United States, 2005." The chart above (click to enlarge) shows the percentage of all U.S. households owning various household appliances in 1971 and 2005, and the percentage of poor households (below the official poverty line) owning those appliances in 2005. The data show a significant improvement in living standards between 1971 and 2005, as the percentage of households with clothes dryers increased from 44.5% to 81.2%, the percentage of households with dishwashers increased from 18.8% to 64%, and the percent of household with air conditioners increased from 31.8% to 85.7%. Steve Horwitz at the Austrian Economists blog has a good post based on Census Bureau data that were recently released on " Living Conditions in the United States, 2005." The chart above (click to enlarge) shows the percentage of all U.S. households owning various household appliances in 1971 and 2005, and the percentage of poor households (below the official poverty line) owning those appliances in 2005. The data show a significant improvement in living standards between 1971 and 2005, as the percentage of households with clothes dryers increased from 44.5% to 81.2%, the percentage of households with dishwashers increased from 18.8% to 64%, and the percent of household with air conditioners increased from 31.8% to 85.7%.
Related data from the Department of Energy (based on Census Data) in the chart show that the percentage of households owning two or more vehicles increased from 34.8% in 1970 to 57% in 2000, and has likely increased since then.
What's most impressive though is the comparison of the living standards of households living below the poverty line in 2005 to all U.S. households in 1971. By almost every measure of appliance ownership, poor American households in 2005 had much better living conditions than the average American household in 1971, since poor households in 2005 had much higher ownership rates for basic appliances like clothes dryers, dishwashers, color TVs, and air conditioners than all households did in 1971.
As Steve Horwitz concludes "Life for the average American is better today than 35 years ago, life for poor Americans is much better than it was 35 years ago, and poor Americans today largely live better than the average American did 35 years ago. Hard to square with a narrative of economic stagnation or decline."
The reasons for the significant improvements in living standards for all Americans (at all income levels) include innovation, technology improvements, supply chain efficiencies, increases in productivity and other market-driven efficiencies that drive prices lower and lower year by year, measured in what is most important: our time, and the amount of labor it takes to earn the money to purchase household appliances and other goods and services.
Time Value of Common Household Appliances, 1973 vs. 2009
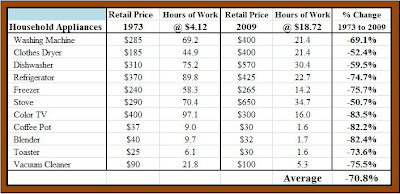 The chart above (click to enlarge) shows retail prices for eleven different household appliances in both 1973 ( data here) and 2009 ( data here), and the cost of those appliances measured in "hours of work" at the average hourly wage for all industries ( BLS data here, $4.12 in 1973 vs. $18.72 today). The charts shows significant reductions in the real cost of basic household appliances between 1973 and today of from -50.7% for a basic kitchen stove (70.4 hours in 1973 vs. 34.7 hours in 2009) to -83.5% for color TVs (97.1 hours in 1973 vs. 16 hours in 2009), and an average reduction in real cost of more than 70% between 1973 and 2009. In other words, to purchase those 11 basic household appliances in 1973 would have taken 551.1 hours of work, 13.8 weeks or 3.4 months working full-time at the average hourly wage in 1973. To purchase those same eleven appliances in 2009 would have only taken 171 hours of work, or 4.3 weeks or 1.1 month. Or the typical worker in 1973 would have had to work from January 1 until the second week of April to earn enough income to purchase those 11 appliances (pre-tax), whereas a worker today would only have to work from January 1 until the first few days of February to earn income for those appliances. The chart above (click to enlarge) shows retail prices for eleven different household appliances in both 1973 ( data here) and 2009 ( data here), and the cost of those appliances measured in "hours of work" at the average hourly wage for all industries ( BLS data here, $4.12 in 1973 vs. $18.72 today). The charts shows significant reductions in the real cost of basic household appliances between 1973 and today of from -50.7% for a basic kitchen stove (70.4 hours in 1973 vs. 34.7 hours in 2009) to -83.5% for color TVs (97.1 hours in 1973 vs. 16 hours in 2009), and an average reduction in real cost of more than 70% between 1973 and 2009. In other words, to purchase those 11 basic household appliances in 1973 would have taken 551.1 hours of work, 13.8 weeks or 3.4 months working full-time at the average hourly wage in 1973. To purchase those same eleven appliances in 2009 would have only taken 171 hours of work, or 4.3 weeks or 1.1 month. Or the typical worker in 1973 would have had to work from January 1 until the second week of April to earn enough income to purchase those 11 appliances (pre-tax), whereas a worker today would only have to work from January 1 until the first few days of February to earn income for those appliances.
Bottom Line: As much as we hear about declines in median income, economic stagnation, the disappearance of the middle class, falling real wages, increasing income inequality, the data tell a much different story: The rich are getting richer and the poor are getting richer.
mjperry.blogspot.com
The Miracle of the Market

With some help from the Student Entrepreneur Society at the University of Michigan-Flint (especially Jennifer Moore), and an old 1950 Sears catalog purchased from Ebay, we were able to compare the costs of 16 typical household items in 1950 to the costs of those same items today, measured in the cost of our time to purchase those household items. Using the average hourly manufacturing wage of $1.30 in 1950 and $18.01 today, the hours of work to purchase those 16 household items in both 1950 and 2009 are displayed above (click to enlarge). In all cases, we tried to match the size and quality of the items as closely as possible in both years.
Bottom Line: In 1950, it would have taken almost 8 months of full-time work at the average manufacturing wage to earn the $1,650 needed to purchase the 16 items above at the retail prices in 1950 (or 31.7 weeks, 158.4 days, or 1,267 hours). Today, it would take only 1.6 months of work at the current average hourly wage of $18.01 to earn the $4,580 necessary to purchase those same items at today's retail prices (or 6.4 weeks, 31.8 days or 254.5 hours).
To what do we owe this significant 80% reduction in the time cost of household goods over time? It's all part of the miracle of the market economy.
mjperry.blogspot.com
Christmas Shopping for a VCR/DVD: 1981 vs. 2009
 Cost of a Sears VCR in 1981: $1389.88, or 187.3 hours of work (23.4 days or 4.7 weeks) at the average hourly wage of $7.42 (total private industries). Cost of a Sears VCR in 1981: $1389.88, or 187.3 hours of work (23.4 days or 4.7 weeks) at the average hourly wage of $7.42 (total private industries).
Cost of a Sears VCR/DVD combo in 2009: $74.99 or 4hours of work at the current average hourly wage of $18.74.

Bottom Line: If we paid the same price ("time cost") today for a VCR as in 1981 (187.3 hours at the average hourly wage of $18.74), a VCR today would cost $3,510. Or equivalently, consumers in 1981 actually paid the equivalent of $3,510 in today's dollars. Alternatively, the typical consumer today would earn enough money on a single day before lunch (4 hours) to purchase a brand new VCR/DVD player, and the typical consumer in 1981 had to work full-time for almost five weeks to earn enough money to purchase a VCR then.
This is the best holiday season ever, see Reason.tv video.
mjperry.blogspot.com
Also see
coyoteblog.com
mjperry.blogspot.com
mjperry.blogspot.com
mjperry.blogspot.com
|


