>> The top 1% now is not the same as the top 1% then.
Can you prove this?
Its pretty ridiculous to ask for proof of such a basic and obvious point. You can dispute the significance of the point, or the extent of the change, but its obvious that the top 1% does change over time whatever the exact rate.
Addressing the rate -
"The turnover of people is substantial in all brackets — and is huge in the top 1%. Most people in that bracket are there for only one year in a decade."
news.investors.com
Addressing a related question, turnover at the very top
"The IRS has a new report on the 400 taxpayers reporting the highest adjusted gross incomes (AGI) from 1992 to 2006, summarized in the table above. The 6,000 tax returns (400 highest earners x 15 years) from 1992 to 2006 represented 3,305 unique, individual taxpayers, since some taxpayers made it into the top 400 earner group more than one year. The data show that:
1. Of the group of 3,305 top earners from 1992-2006, 2,394 individuals made it into the top 400 only one time during the 15-year period. Those 2,394 one-timers represent 72.44% of the total (3,305), so only 27.56% made it into the top 400 more than once (see columns 2 and 3).
2. Moreover, 2,394 earners made it into the top 400 once (72.44%), and another 408 (12.34%) made it into the top group twice. So 84.78% made it into the top group either once or twice, and only 15.22% made it into the top group more than twice (see columns 2 and 3).
3. There were only 8 taxpayers out of 3,305 (1/4 of 1%) who were in the top 400 in all of the 15 years.
4. In any given year, on average, about 40% of the returns were filed by taxpayers that are not in any of the other 14 years (see columns 4 and 5).
According to the IRS, "the data shown in the table mostly represent a changing group of taxpayers over time, rather than a fixed group of taxpayers.""
mjperry.blogspot.com
Getting back to household income growth over time -
libertarianjew.blogspot.com
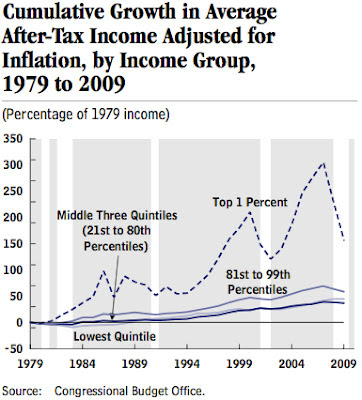
Notice that all quintiles grow since 1979, since 1984, since 1989, and since 1994 and apparently since 1999. And that's even using the misleading stat of household income. (Misleading because households have shrunk, and misleading for the poor since it doesn't include non-cash benefits.)
considering real income per person

super-economy.blogspot.com

super-economy.blogspot.com
...Wages, household earnings and earnings of tax units appear to grow slowly. Between 1970-2008 real wages grew 15%, median household income 16%, and according to Pickety&Saez taxable income of "The Bottom 99 Percent" by 12%...
1. Taxable income is only part of total income. In 2008 taxable income as reported by Pickety&Saez was only 58 percent of GDP, a decline from 1970. We can’t just ignore the rest of national income. There is a similar income-base problem with BLS wage data.
2. Average Household and Taxable Unit sizes have been shrinking since 1970, both growing at around one and a half time the rate of population.
3. Inflation is systematically miss-measured, as the Boskin-comission found. When calculating GDP a different and less biased inflation measure is used than CPI-U-RS.
The Congressional Budget Office made their own estimates, accounting for the first two problems, though not for inflation. They confirms that the share of post-tax income going to the top one percent increased from 8% to 17% (a bit lower than Pickety&Saez, perhaps because of household size adjustment and a broader income base). Since the CBO estimate of income growth of 62 percent in the shorter period covered is very close to GDP numbers, their estimates of real middle class income growth are also higher, at 46 percent.
A careful new study by Bruce Meyer and James Sullivan corrects for the aforementioned problems. Similar adjustments are done by Burkhauser et al. (2011) and Gordon (2009). Like the CBO, all these studies correspond better with GDP data, and produce higher estimates of middle class income growth (results summarized bellow).
My simple method is combining the best income-distribution estimate (from Pickety&Saez) with the best income-growth estimates (from GDP numbers). This method shows that that between 1970-2008 the real per capita income of the "Bottom 99 Percent" grew by 80%, and the income of the "Bottom 90 Percent" grew by 60%.
super-economy.blogspot.com
Some might respond "but what about inequality".
1 - I don't care about inequality. I do care about the absolute living standard of the poor, and more generally the non-rich, but all else being equal, the rich getting richer is positive not negative.
2 - Income inequality hasn't grown much in recent years. Its growth was mainly in the 80s and the 90s.
3 - Income inequality stats don't count all income. Expenditure inequality is noticeably lower and hasn't increased in the same way.
4 - Wealth inequality is far from its peak, and generally declined over the 20th century

blog.american.com
Reversal of the Trend: Income Inequality Now Lower than It Was under Clinton
taxfoundation.org
Income inequality myths: No, the rich didn’t steal all the money
blog.american.com
1979-2007: Rich Got Richer, Poor Got Richer

WASHINGTON – "Today, the Employment Policies Institute (EPI) announced the publication of new research by economists Dr. Richard V. Burkhauser of Cornell University, Dr. Jeff Larrimore of the Joint Committee on Taxation and Dr. Kosali Simon of Indiana University, the results of which appear in the most recent issue of the Journal of Policy Analysis and Management (link fixed).
In his recent speech on deficit reduction, President Obama defended his support of higher taxes on wealthy Americans by echoing a widely-held view that the rich are getting richer while the poor and middle class are falling behind. But Burkhauser et al. find that this popular notion is mistaken; in reality, growth in after-tax household income has been substantial across the entire income distribution over the last thirty years (see table above).
“By leaving out additional sources of income – like fringe benefits or employer-provided health insurance – past studies have dramatically understated American households’ access to after-tax resources.” said Dr. Burkhauser. “What we found is that the rich did get richer over the last 30 years, but so did the middle class, the working class and the poorest.”
By taking into account previously unmeasured shifts in household size and the tax units in them, the taxes and transfers of government, and the increasing importance of fringe benefits, the research shows a picture of growth that spans all income groups.
Burkhauser continued: “For instance, the conventional wisdom holds that the poorest households saw their income shrink by a third over the last three decades. But accounting for income transfers and the value of fringe benefits, this research shows that the bottom 20 percent of households actually experienced after-tax income growth of more than 26 percent.”
Burkhauser concluded: “This isn’t a zero sum game, where one group wins at the expense of others. The growth in productivity of Americans in the top twenty percent of tax units increased the size of the economic pie sufficiently to register major gains across the entire distribution of after-tax income.”
mjperry.blogspot.com
Increasing inequality in the distribution of earnings has become one of those stylized facts that everyone “knows.” The nightly news reminds viewers that ordinary workers have not fared well in the labor market over the last 25 years, while corporate executives have. Many professional economists and a recent CBO report have supported this view as well. While it is true that the cash explicitly paid to employees has become more unequal over the last generation, the…more benign explanation for the change in cash compensation over a generation is the dramatic increase in health insurance costs. …inequality in total compensation has not increased because the fixed costs of health insurance are a much larger percentage of the total compensation of lower-earnings workers. Burkhauser and Simon explore this explanation. They add the value of employer-provided health insurance as well as Medicaid and Medicare to the pre-tax, post-cash-transfer household income data and find that the bottom three income deciles actually exhibit higher growth than the top seven deciles from 1995 to 2008. …Warshawsky makes a similar discovery. Using unpublished BLS total compensation data, including employer health insurance expenditures, from 1999 to 2006, he finds that the growth in compensation by earnings decile (from the 30th to the 99th) averages 35 percent, with 41 percent growth at the 30th percentile (workers earning $10–$14 an hour) and only 35.8 percent growth at the 99th percentile (workers earning $59–$80 an hour).
cato.org
Translating all this into simple English, it turns out that the rich are getting richer slower than the rest of us are getting richer.
danieljmitchell.wordpress.com
Adjusting for inflation, the Census Bureau measure of median household income increased by 10% between 1973-2008. This is a broader and in my view better measure of income than BLS wages.
Contrary to popular perception, aggregate hours worked per adult are no higher than in 1973. Furthermore, this comparison does not take into account changing demographics. Compared to 1973, America has taken in millions of unskilled Hispanic workers, who earn less and depress the median. If we look at non-Hispanic white households, real median income increased by 15%. For African Americans, real median household income increased by 22%.
super-economy.blogspot.com
...If we really want to know what happened to the poor of 1979, we need to be able to track specific households through time. Fortunately, we can. According to researchers at the University of Michigan, households in the bottom fifth in 1975 earned an average of almost $28,000 more per year by 1991, adjusted for inflation. According to U.S. Treasury data, a whopping 86 percent of households in the bottom fifth in 1979 had climbed out of poverty by 1988... (And that's not considering that households have gotten smaller - Tim)
philly.com
"...Incomes for the poorest one-fifth of all earners have grown on average 3.9% a year since 1994. Meanwhile, those in the middle three-fifths of incomes — broadly speaking, the middle class — have grown by 3.4% to 3.6% a year..."
ibdeditorials.com
"...After one year, about one-third of workers in the bottom income quintile move to a higher one; about one-quarter of those in the top quintile move to a lower one.
Only 29 percent of workers remain in the same income quintile after 15 years.
On average, individuals can expect to move from the 20 th percentile of the earnings distribution at the beginning of their career to about the 60 th percentile during their peak earning years.
Less than one third (31 percent) of children are in the same income quintile as their parents..."
taxesandgrowth.ncpa.org |


