You are just a thoughtless fellow grinding an axe from Stupid Town.
climate.nasa.gov
NASA
Global Climate Change
Vital Signs of the Planet

Skip Navigation
Science
Evidence Causes Effects Consensus Vital Signs Questions (FAQ)
Articles
News Features Blog
NASA's Role
Earth System Science Missions History Making a Difference
Solutions
Mitigation and Adaptation Government Resources Energy Innovations
Explore
Interactives Eyes on the Earth Images of Change Beautiful Earth NASA's Earth Minute
Resources
Graphics and Multimedia For Meteorologists For Educators
Follow Global Climate Change
 Twitter Twitter  Facebook Facebook  Google_plus Google_plus  RSS RSS
Science Evidence Causes Effects Consensus Vital Signs Questions (FAQ)
Climate change: How do we know?
<img class="main_image" alt="This graph, based on the comparison of atmospheric samples contained in ice cores and more recent direct measurements, provides evidence that atmospheric CO2 has increased since the Industrial Revolution. (Source: [[LINK||http://www.ncdc.noaa.gov/paleo/icecore/||NOAA]])" src="http://climate.nasa.gov/system/content_pages/main_images/203_co2-graph-1280x800.jpg"> This graph, based on the comparison of atmospheric samples contained in ice cores and more recent direct measurements, provides evidence that atmospheric CO2 has increased since the Industrial Revolution. (Credit: Vostok ice core data/J.R. Petit et al.; NOAA Mauna Loa CO2 record.)
The Earth's climate has changed throughout history. Just in the last 650,000 years there have been seven cycles of glacial advance and retreat, with the abrupt end of the last ice age about 7,000 years ago marking the beginning of the modern climate era — and of human civilization. Most of these climate changes are attributed to very small variations in Earth’s orbit that change the amount of solar energy our planet receives.
Scientific evidence for warming of the climate system is unequivocal.
- Intergovernmental Panel on Climate Change
The current warming trend is of particular significance because most of it is very likely human-induced and proceeding at a rate that is unprecedented in the past 1,300 years.1
Earth-orbiting satellites and other technological advances have enabled scientists to see the big picture, collecting many different types of information about our planet and its climate on a global scale. Studying these climate data collected over many years reveal the signals of a changing climate.
The heat-trapping nature of carbon dioxide and other gases was demonstrated in the mid-19th century.2 Their ability to affect the transfer of infrared energy through the atmosphere is the scientific basis of many instruments flown by NASA. There is no question that increased levels of greenhouse gases must cause the Earth to warm in response. Ice cores drawn from Greenland, Antarctica, and tropical mountain glaciers show that the Earth’s climate responds to changes in greenhouse gas levels. They also show that in the past, large changes in climate have happened very quickly, geologically-speaking: in tens of years, not in millions or even thousands.3
The evidence for rapid climate change is compelling:
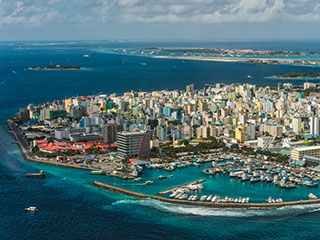 Republic of Maldives: Vulnerable to sea level rise. Republic of Maldives: Vulnerable to sea level rise.
Sea level riseGlobal sea level rose about 17 centimeters (6.7 inches) in the last century. The rate in the last decade, however, is nearly double that of the last century.4
+ more

Earth’s vital signs: Sea LevelAn indicator of current global sea level as measured by satellites; updated monthly.

Quiz: Sea levelTest your knowledge of sea level rise with this interactive quiz.
Global temperature riseAll three major global surface temperature reconstructions show that Earth has warmed since 1880.5 Most of this warming has occurred since the 1970s, with the 20 warmest years having occurred since 1981 and with all 10 of the warmest years occurring in the past 12 years.6 Even though the 2000s witnessed a solar output decline resulting in an unusually deep solar minimum in 2007-2009, surface temperatures continue to increase.7
+ more

Earth’s vital signs: Global temperatureAn indicator of current global average temperature as measured by NASA; updated monthly.

Global Climate Change: CausesAn overview of the greenhouse effect and other contributors to abrupt climate change.

Video: Global warming from 1880 to 2013A visualization of global temperature changes since 1880 based on NASA GISS data.

Warming oceansThe oceans have absorbed much of this increased heat, with the top 700 meters (about 2,300 feet) of ocean showing warming of 0.302 degrees Fahrenheit since 1969.8
+ more

Climate Kids: What is happening in the ocean?An overview of the ocean’s role in climate change and how it stores and releases heat from the atmosphere.
Video: Oceans of climate changeA lighthearted look at the effect of climate change on the world’s oceans and the heat capacity of water.

Article: Warming ocean causing most Antarctic ice shelf mass lossOcean waters melting the undersides of Antarctic ice shelves are responsible for most of the continent's ice shelf mass loss, a new study by NASA and university researchers has found.
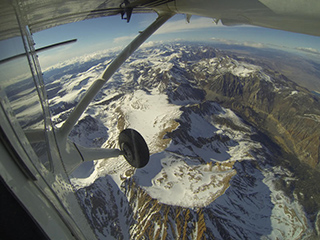
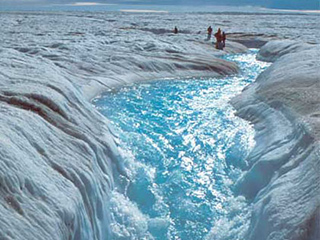 Flowing meltwater from the Greenland ice sheet Flowing meltwater from the Greenland ice sheet
Shrinking ice sheetsThe Greenland and Antarctic ice sheets have decreased in mass. Data from NASA's Gravity Recovery and Climate Experiment show Greenland lost 150 to 250 cubic kilometers (36 to 60 cubic miles) of ice per year between 2002 and 2006, while Antarctica lost about 152 cubic kilometers (36 cubic miles) of ice between 2002 and 2005.
+ more

Vital Signs: Land IceAn indicator of the current volume and the Antarctica and Greenland ice sheets using data from NASA’s Grace satellite.

Global Ice ViewerAn interactive exploration of how global warming is affecting sea ice, glaciers and continental ice sheets world wide.
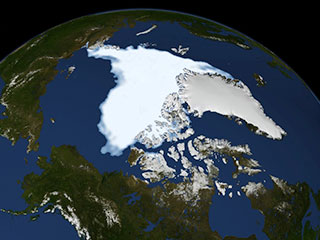 Visualization of the 2007 Arctic sea ice minimum Visualization of the 2007 Arctic sea ice minimum
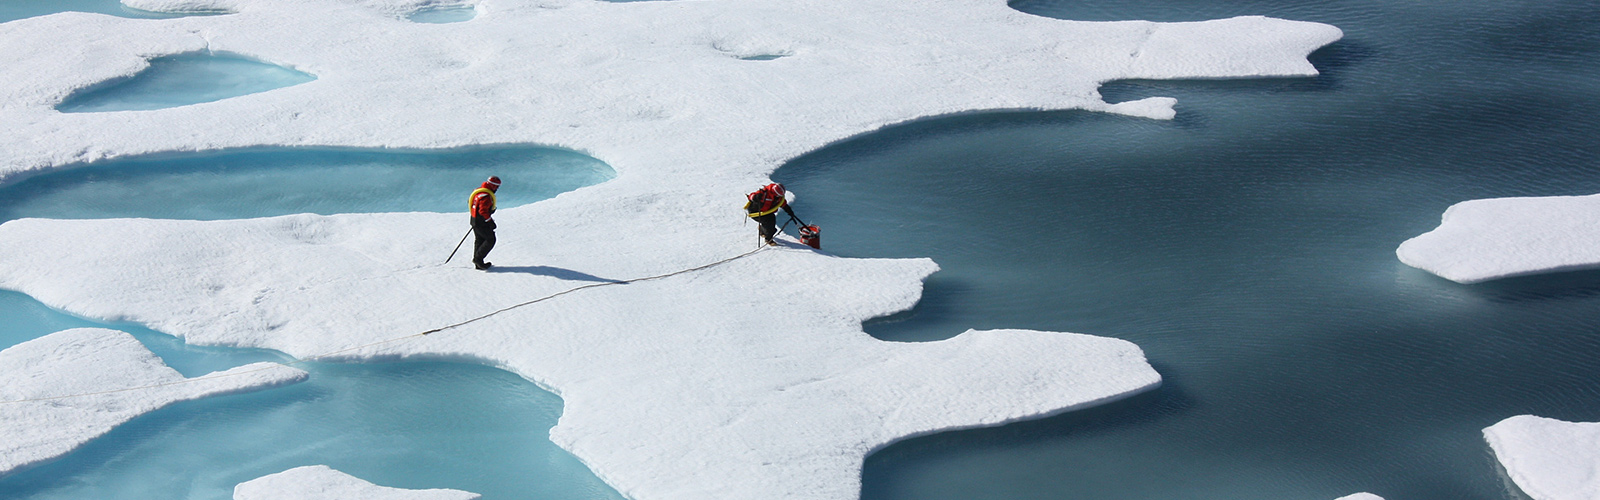
Declining Arctic sea iceBoth the extent and thickness of Arctic sea ice has declined rapidly over the last several decades.9
+ more

Earth’s vital signs: Sea iceAn indicator of changes in the Arctic sea ice minimum over time. Arctic sea ice extent both affects and is affected by global climate change.
Interactive: Global ice viewerAn interactive exploration of how global warming is affect sea ice, glaciers and continental ice sheets worldwide.

NASA’s Operation Icebridge missionNASA’s Operation IceBridge images Earth's polar ice in unprecedented detail to better understand processes that connect the polar regions with the global climate system.
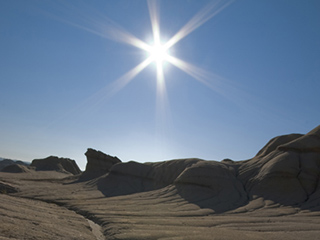
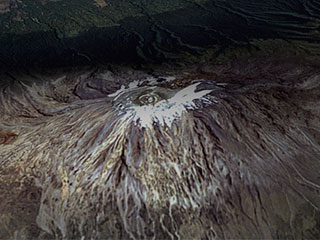 The disappearing snowcap of Mount Kilimanjaro, from space. The disappearing snowcap of Mount Kilimanjaro, from space.
Glacial retreatGlaciers are retreating almost everywhere around the world — including in the Alps, Himalayas, Andes, Rockies, Alaska and Africa.10
+ more
Interactive: Global ice viewerAn interactive exploration of how global warming is affect sea ice, glaciers and continental ice sheets worldwide.

Extreme eventsThe number of record high temperature events in the United States has been increasing, while the number of record low temperature events has been decreasing, since 1950. The U.S. has also witnessed increasing numbers of intense rainfall events.11
+ more

Precipitation Measurement MissionsThe official website for NASA's fleet of Earth science missions that study rainfall and other types precipitation around the globe.

Precipitation QuizEarth’s water is stored in ice and snow, lakes and rivers, the atmosphere and the oceans. How much do you know about how water is cycled around our planet and the crucial role it plays in our climate?
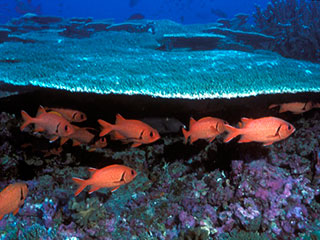
Ocean acidificationSince the beginning of the Industrial Revolution, the acidity of surface ocean waters has increased by about 30 percent.12,13 This increase is the result of humans emitting more carbon dioxide into the atmosphere and hence more being absorbed into the oceans. The amount of carbon dioxide absorbed by the upper layer of the oceans is increasing by about 2 billion tons per year.14,15
+ more
How does climate change affect coral reefs?Article about how global warming leads to coral bleaching and changes ocean chemistry, leading to acidification.

The Other Carbon Dioxide ProblemNOAA page on ocean acidification.
Decreased snow coverSatellite observations reveal that the amount of spring snow cover in the Northern Hemisphere has decreased over the past five decades and that the snow is melting earlier.16
+ more

National Snow and Ice Data CenterAs an information and referral center in support of polar and cryospheric research,NSIDC archives and distributes digital and analog snow, ice, and

Earth Observatory: Snow CoverTime series of global snow cover from NASA's Earth Observatory.
References
IPCC Fourth Assessment Report, Summary for Policymakers, p. 5
B.D. Santer et.al., “A search for human influences on the thermal structure of the atmosphere,” Nature vol 382, 4 July 1996, 39-46
Gabriele C. Hegerl, “Detecting Greenhouse-Gas-Induced Climate Change with an Optimal Fingerprint Method,” Journal of Climate, v. 9, October 1996, 2281-2306
V. Ramaswamy et.al., “Anthropogenic and Natural Influences in the Evolution of Lower Stratospheric Cooling,” Science 311 (24 February 2006), 1138-1141
B.D. Santer et.al., “Contributions of Anthropogenic and Natural Forcing to Recent Tropopause Height Changes,” Science vol. 301 (25 July 2003), 479-483.
In the 1860s, physicist John Tyndall recognized the Earth's natural greenhouse effect and suggested that slight changes in the atmospheric composition could bring about climatic variations. In 1896, a seminal paper by Swedish scientist Svante Arrhenius first speculated that changes in the levels of carbon dioxide in the atmosphere could substantially alter the surface temperature through the greenhouse effect.
National Research Council (NRC), 2006. Surface Temperature Reconstructions For the Last 2,000 Years. National Academy Press, Washington, DC.
Church, J. A. and N.J. White (2006), A 20th century acceleration in global sea level rise, Geophysical Research Letters, 33, L01602, doi:10.1029/2005GL024826.
The global sea level estimate described in this work can be downloaded from the CSIRO website.
http://www.ncdc.noaa.gov/oa/climate/research/ anomalies/index.html
http://www.cru.uea.ac.uk/cru/data/temperature
http://data.giss.nasa.gov/gistemp
T.C. Peterson et.al., "State of the Climate in 2008," Special Supplement to the Bulletin of the American Meteorological Society, v. 90, no. 8, August 2009, pp. S17-S18.
I. Allison et.al., The Copenhagen Diagnosis: Updating the World on the Latest Climate Science, UNSW Climate Change Research Center, Sydney, Australia, 2009, p. 11
http://www.giss.nasa.gov/research/news/20100121/
http://science.nasa.gov/headlines/y2009/ 01apr_deepsolarminimum.htm
Levitus, et al, "Global ocean heat content 1955–2008 in light of recently revealed instrumentation problems," Geophys. Res. Lett. 36, L07608 (2009).
L. Polyak, et.al., “History of Sea Ice in the Arctic,” in Past Climate Variability and Change in the Arctic and at High Latitudes, U.S. Geological Survey, Climate Change Science Program Synthesis and Assessment Product 1.2, January 2009, chapter 7
R. Kwok and D. A. Rothrock, “Decline in Arctic sea ice thickness from submarine and ICESAT records: 1958-2008,” Geophysical Research Letters, v. 36, paper no. L15501, 2009
http://nsidc.org/sotc/sea_ice.html
National Snow and Ice Data Center
World Glacier Monitoring Service
http://lwf.ncdc.noaa.gov/extremes/cei.html
http://www.pmel.noaa.gov/co2/story/What+is+Ocean+Acidification%3F
http://www.pmel.noaa.gov/co2/story/Ocean+Acidification
C. L. Sabine et.al., “The Oceanic Sink for Anthropogenic CO2,” Science vol. 305 (16 July 2004), 367-371
Copenhagen Diagnosis, p. 36.
National Snow and Ice Data Center
C. Derksen and R. Brown, "Spring snow cover extent reductions in the 2008-2012 period exceeding climate model projections," GRL, 39:L19504
http://nsidc.org/cryosphere/sotc/snow_extent.html
Rutgers University Global Snow Lab, Data History Accessed August 29, 2011.
Scientific Consensus Ninety-seven percent of climate scientists agree that climate-warming trends over the past century are very likely due to human activities, and most of the leading scientific organizations worldwide have issued public statements endorsing this position.
Click here for a partial list of these public statements and related resources.
Latest Resources
Explore

Eyes on the Earth
Track Earth's vital signs from space and fly along with NASA's Earth-observing satellites in an interactive 3D visualization.

Climate Time Machine
Travel through Earth's recent climate history and see how increasing carbon dioxide, global temperature and sea ice have changed over time.

Global Ice Viewer
Earth's ice cover is shrinking. See how climate change has affected glaciers, sea ice, and continental ice sheets.

Images of Change
Explore a stunning gallery of before-and-after images of Earth from land and space that reveal our home planet in a state of flux.

Climate Mobile Apps
Keep track of Earth's vital signs, see the planet in a state of flux and slow the pace of global warming with NASA's free mobile apps.
Eyes on the Earth
Track Earth's vital signs from space and fly along with NASA's Earth-observing satellites in an interactive 3D visualization.
Climate Time Machine
Travel through Earth's recent climate history and see how increasing carbon dioxide, global temperature and sea ice have changed over time.
Global Ice Viewer
Earth's ice cover is shrinking. See how climate change has affected glaciers, sea ice, and continental ice sheets.
Images of Change
Explore a stunning gallery of before-and-after images of Earth from land and space that reveal our home planet in a state of flux.
Climate Mobile Apps
Keep track of Earth's vital signs, see the planet in a state of flux and slow the pace of global warming with NASA's free mobile apps.
Eyes on the Earth
Track Earth's vital signs from space and fly along with NASA's Earth-observing satellites in an interactive 3D visualization.
PreviousNext
more multimedia
Get the Newsletter
Stay Connected
Twitter Facebook Google_plus RSS
Science
Articles
NASA's Role
Solutions
Explore
Resources
This website is produced by the Earth Science Communications Team at
NASA's Jet Propulsion Laboratory | California Institute of Technology
Site Manager: Randal Jackson
Senior Science Editor: Amber Jenkins
Site Editor: Holly Shaftel
[iframe title="AddThis utility frame" id="_atssh414" src="http://ct1.addthis.com/static/r07/sh180.html#iit=1416281426193&tmr=load%3D1416281425302%26core%3D1416281425433%26main%3D1416281426151%26ifr%3D1416281426198&cb=0&cdn=0&kw=NASA%2Cclimate%20change%2Cglobal%20warming%2Canthropogenic%2Chumans%2Cgreenhouse%20gases%2Cice%20melt%2Csea%20level%20rise%2Coceans&ab=-&dh=climate.nasa.gov&dr=http%3A%2F%2Fwww.google.ca%2Furl%3Fsa%3Dt%26rct%3Dj%26q%3D%26esrc%3Ds%26source%3Dweb%26cd%3D1%26ved%3D0CCkQFjAA%26url%3Dhttp%253A%252F%252Fclimate.nasa.gov%252Fevidence%252F%26ei%3DR71qVNqrOc6cyAS2qICgAQ%26usg%3DAFQjCNEiYOkXWKjgIJTiaUt098OHcuzvgA%26sig2%3Dneew8z2oFxasIxt83LTKuw&du=http%3A%2F%2Fclimate.nasa.gov%2Fevidence%2F&dt=Climate%20Change%3A%20Vital%20Signs%20of%20the%20Planet%3A%20Evidence&dbg=0&cap=tc%3D0%26ab%3D0&inst=1&jsl=33&prod=undefined&lng=en-CA&ogt=image%2Cupdated_time%2Ctype%3Darticle%2Curl%2Ctitle%2Cdescription%2Csite_name&pc=men&pub=ra-540e2cdc72401709&ssl=0&sid=546abd51aa154887&srpl=1&srcs=1&srd=1&srf=1&srx=1&ver=300&xck=1&xtr=0&og=site_name%3DClimate%2520Change%253A%2520Vital%2520Signs%2520of%2520the%2520Planet%26description%3DVital%2520Signs%2520of%2520the%2520Planet%253A%2520Global%2520Climate%2520Change%2520and%2520Global%2520Warming.%2520How%2520do%2520we%2520know%2520it%25E2%2580%2599s%2520happening%253F%2520Here%25E2%2580%2599s%2520the%2520evidence.%26title%3DHome%26url%3Dhttp%253A%252F%252Fclimate.nasa.gov%252Fevidence%26type%3Darticle%26updated_time%3D2014-11-11%252020%253A19%253A40%2520UTC%26image%3D&aa=0&csi=undefined&toLoJson=chr%3Dutf-8%26md%3D0%26vcl%3D0&rev=10.0&ct=1&xld=1&xd=1" style="border: 0px currentColor; left: 0px; top: 0px; width: 1px; height: 1px; position: absolute; z-index: 100000; border-image: none;"][/iframe]
AddThis Sharing
Twitter Facebook Email More
Hide
Show
AddThis Privacy
Share
Toggle Dock
Share
Close
AddThis Privacy |


