I predict that Obama won't call Goddard a liar, cuz he's never heard of him.
So 2014 may not have been warmest?
That has been the meme from people who don't like the thought. Bob Tisdale, at WUWT, gives a rundown. There is endless misinterpretation of a badly expressed section in the joint press release from NOAA and GISS announcing the record.
The naysayers drift seems to be that there is uncertainty, so we can't say there is a record. But this is no different from any year/month in the past, warmest or coldest. 2005 was uncertain, 2010 also. Here they are, for example, proving that July 1936 was the hottest month in the US. Same uncertainties apply, but no, it was the hottest.
So what was badly expressed by NOAA/GISS. They quoted uncertainties without giving the basis for them. What do they mean and how were they calculated? Just quoting the numbers without that explanation is asking for trouble.
The GISS numbers seem to be calculated as described by Hansen, 2010, paras 86, 87, and Table 1. It's based on the vagaries of spatial sampling. Temperature is a continuum - we measure it at points and try to infer the global integral. That is, we're sampling, and different samples will give different results. We're familiar with that; temperature indices do vary. UAH and RSS say no records, GISS says yes, just, and NOAA yes, verily. HADCRUT will be very close; Cowtan and Way say 2010 was top.
I think NOAA are using the same basis. GISS estimates the variability from GCMs, and I think NOAA mainly from subsetting.
Anyway, this lack of specificity about the meaning of CIs is a general problem that I want to write about. People seem to say there should be error bars, but when they see a number, enquire no further. CI's represent the variation of a population of which that number is a member, and you need to know what that population is.
In climate talk, there are at least three quite different types of CI:
- Measurement uncertainty - variation if we could re-measure same times and places
- Spatial sampling uncertainty - variation if we could re-measure same times, different places
- Time sampling uncertainty - variation if we could re-measure at different times (see below), same places
I'll discuss each below the jump.
Update and digression (OT). I'll just post this plot of the progress of the GISS record. 2014 was a modest jump: 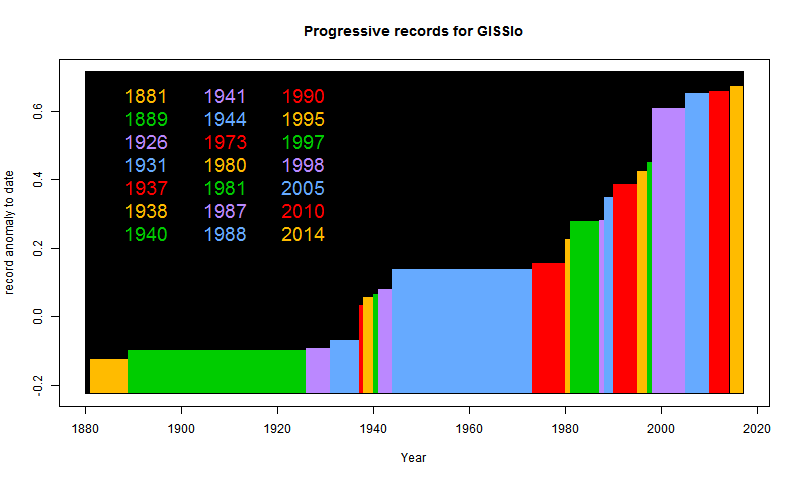
Measurement uncertaintyThis is least frequently quoted, mainly because it is small. But people very often assume it is what is meant. Measurement can have bias or random error. Bias is inescapable, even hard to define. For example, MMTS often reads lower than thermometers. It doesn't help to argue which is right; only to adjust when there is a change.
I speak of a random component, but the main aspect of it is that when you average a lot of readings, there will be cancellations. A global year average has over a million daily readings. In an average of N readings, cancellation should reduce noise by about sqrt(N); in this case by a factor of 1000.
Spatial sampling uncertaintyThat is present in every regional average. As said above, we claim an average over all points in the region, but have only a sample. A different sample might give a different result. This is not necessarily due to randomness in the temperature field; when GISS gives an uncertainty, I presume that reflects some randomness in choice of stations, quite possibly for the same field.
A reasonable analogy here is the stock exchange. We often hear of a low for the year, or a record high, etc. That reflects a Dow calculation on a sample of stocks. A different sample might well lead to a non-record. And indeed, there are many indices based on different samples. That doesn't seem to bother anyone.
What I find very annoying about the GISS/NOAA account is that in giving probabilities of 2014 being a record, they don't say if it for the same sample. I suspect it includes sample variation. But in fact we have very little sample variation. In 2010 we measured in much the same places as 2014. It makes a big difference.
Time sampling uncertainty.This is another often quoted, usually misunderstood error. It most frequently arises with trends of a temperature series. They are quoted with an uncertainty which reflects a model of variation within timesteps. I do those calculations on the trend page and have written a lot about what that uncertainty means. The important distinction is that it is not an error in the trend that was. It is an uncertainty in the trend that might have been if the climate could be rerun with a new instance of random variation. That might sound silly, but it does have some relevance to extrapolating trends into the future. Maybe you think that is silly too.
Briggs has a muddled but interesting article, trenchantly deprecating this use of CI's. RealClimate cited a trend (actually just quoting Cowtan and Way) as 0.116 +/- 0.137. Said Briggs:
"Here’s where it becomes screwy. If that is the working definition of trend, then 0.116 (assuming no miscalculation) is the value. There is no need for that “+/- 0.137? business. Either the trend was 0.116 or it wasn’t. What could the plus or minus bounds mean? They have no physical meaning, just as the blue line has none. The data happened as we saw, so there can not be any uncertainty in what happened to the data. The error bounds are persiflage in this context."
I don't totally disagree. 0.116 is the trend that was. The interesting thing is, you can say the same about the commonly quoted standard error of the mean. Each is just a weighted sum, with the error calculated by adding the weighted variances.
I've used this analogy. If you have averaged the weights of 100 people, the CI you need depends on what you want to use the average for. If it is to estimate the average weight of the population of which they are a fair sample, then you need the se. But if you are loading a boat, and want to know if it can carry them, the se is of no use. You want average instrumental error, if anything.
And the thing about trend is, you often are interested in a particular decade, not in its status as a sample. That is why I inveigh against people who want to say there was no warming over period x because, well, there was, and maybe a lot, but it isn't statistically significant. SS is about whether it might, in some far-fetched circumstances, happen again. Not about whether it actually happened.
Briggs is right on that. Of course I couldn't resist noting that in his recent paper with Monckton, such CI's featured prominently, with all the usual misinterpretations. No response - there never is there.
Statistical TieOK, this a pet peeve of mine. CI's are complicated, especially with such different bases, and people who can't cope often throw up their hands and say it is a "statistical tie". But that is complete nonsense. And I was sorry to see it crop up in Hansen's 2014 summary (Appendix) where 2014, 2010 and 2005 were declared to be "statistically tied".
You often see this in political polling, where a journalist has been told to worry about sampling error, and so declares a race where A polls 52%, B 48% with sampling error, as a "statistical tie".
But of course it isn't. Any pol would rather be on 52%. And such a margin close to the election usually presages a win. Any Bayesian could sort that out.
2014 was the warmest year. It doesn't matter how you juggle probabilities. There is no year with a better claim.
moyhu.blogspot.com |


