The evidence of absence is not the absence of evidence.
It's the double full reverse Carl Sagan with a twist....

This is a follow-up to Frankel's article....
Birthers, (Stimulus) Deniers, and Economic Myths
OK, nothing about birthers, but some comments on truths held deeply, but unjustifiably, by certain types of people.
An Econbrowser reader (Rick Stryker, also an anthropogenic climate change denier, so consistent after a fashion) concludes in comments to this post by Jeffrey Frankel:
1) That some recovery, although disappointing, followed the stimulus is not an argument that the stimulus was responsible
2) The composition of GDP, particularly G, is inconsistent with the stimulus having been effective
3) The composition of the stimulus itself is inconsistent with the stimulus having been effective
4) A typical modern new-Keynesian model that works through expected inflation does not provide a believable mechanism through which stimulus could have operated
Well, point 1 is hard to argue against. Granger causality is not the same as causality. Pretty hard to prove anything causes anything using this criterion. Alternatively, one could flip the question around, and restate the the null hypothesis. Consider Figure 1; notice that ARRA spending is exactly at the same time as the recovery’s beginning.
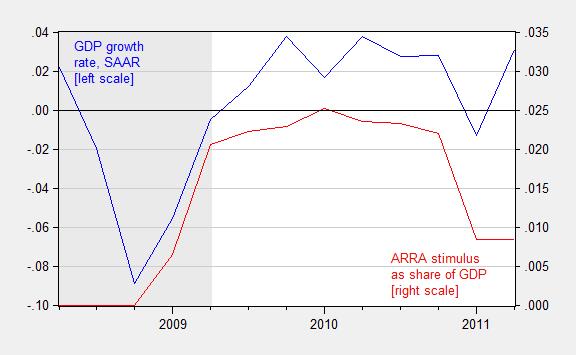
Figure 1: Quarter on quarter growth rate of real GDP, annualized (blue line, left scale) and sum of total receipt effects (reversed) and total expenditure effects from the ARRA, as a share of nominal GDP, 2008Q2-2011Q2. NBER defined recession dates shaded gray. Growth rate calculated as log first difference. Source: BEA via FRED and BEA 2013Q3 3rd release, NBER, and author’s calculations.
I think that reasonable people would say the burden of proof lies on those who assert the beginning of the recovery is due to anything, anything (Fed balance sheet expansion, TARP — both implemented six months earlier –, sunspots, or the return of Ancient Aliens) but the policies implemented by the Obama Administration.
On point (2), the assertion that the pattern in G doesn’t match the beginning of the recovery is just plain wrong. Inspect Figure 2. Notice the red bar, which is growth accounted for a NIPA sense by government consumption and investment spending.
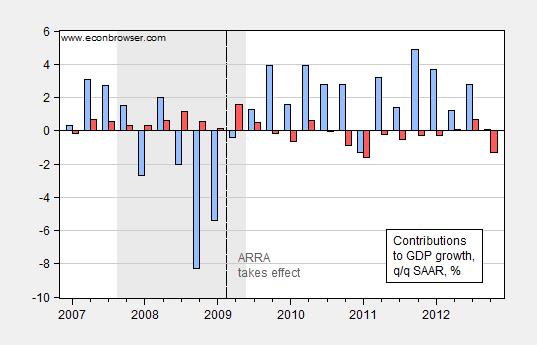
Figure 2: Quarter-on-quarter growth in GDP (blue) and accounted for by government consumption and investment (red). Source: BEA, 2013Q4 advance release.
Government consumption and investment spending accounted for 1.56 ppts of growth in 2009Q2. In economic (not accounting) terms, the impact is bigger, after taking into account multiplier effects (growth resumes going into 2009Q3). Of course the commenter’s focus on government spending on consumption and investment was predicated upon this specious argument:
When you look at the composition of the stimulus, it’s mostly temporary tax cuts and transfers. But Friedman’s permanent income hypothesis and similar ideas suggest that temporary tax cuts are saved rather than spent. Transfers also have very little multiplier effect. And it appears that the transfers to the states were not spent either but rather saved in the sense of allowing states to reduce borrowing.
That assertion is, once again, just plain wrong, on several counts:
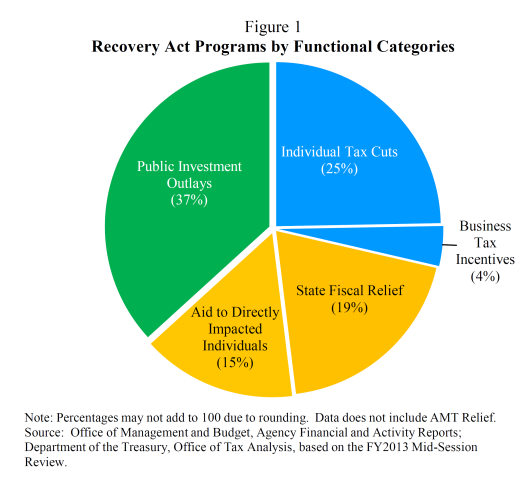
Figure 1 from CEA (2014).
Well, first, 56% of total expenditures were investment and transfers to states [1]. (The calculation omits AMT relief; if one includes it, the majority of expenditures are still in investment and transfers to states; see Table 3.) If one wants to define 44% as most, well one can (and some people do) define up as down.
It’s also important to remember why there was such a large tax component in the stimulus — it was at the insistence of Republicans; the relatively small spending on investment arose in part because so many critics of stimulus believed the recession would be short lived, e.g. Ed Lazear
Second, the assertion that temporary tax and transfer changes had little effect is based upon the Friedman permanent income hypothesis. This, I’ll remind readers, is not gospel, and in fact most DSGE’s I know of include a sizable share of households that are rule-of-thumb (a la Campbell-Mankiw) or hand-to-mouth consumers, exactly because in the absence of such agents, the models “do not fit” the data. One reason that this assumption works is that there are numerous liquidity constrained consumers, who do not behave as if they are completely intertemporally optimizing (not surprising to anybody who’s attempted to estimate an Euler equation for consumption!).
Third, the assertion that Federal transfers to the states were merely used to saved by reducing borrowing flies in the face of anecdotal evidence, the fact that states face balanced budget requirements, and empirical evidence, which indicates high impact on economic activity [2] [3]. Multiplier estimates by the CBO are in concurrence with that view (Table 2 of CBO (2014)).
Once one transcends intro macro, the argument that the composition of spending militated against the stimulus having an impact (point 3) falls apart, and Figure 1 is relevant.
Finally, with respect to expected inflation, it’s actually quite interesting how expected inflation rose after Obama’s election (and the probability of stimulus legislation increased), and continued to rise with the actual passage. This observation is shown in Figure 3.
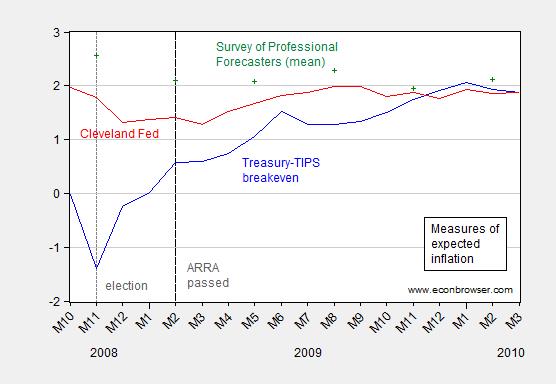
Figure 3: Inflation breakeven from difference between five year constant maturity Treasury yields, and five year constant maturity TIPS yields (blue), Cleveland Fed measure of five year expected inflation (red) and Philadelphia Fed average five year expectations of inflation (green +). Source: Federal Reserve Board via FRED, Cleveland Fed, Philadelphia Fed, and author’s calculations.
Treasury five year breakevens rose from 1.5 ppts, from 0.6% to 2.1% within the year of passage of the ARRA. The Cleveland Fed measure rises from 1.4% to 2%. Survey measures indicate a smaller increase, but once one takes into account the dramatic decline in energy prices toward the end of 2008 and into 2009, it is even more remarkable how much inflation expectations rose. I’m not saying the NK DSGE interpretation of how fiscal policy works is the only plausible one (and recall there are different types of NK DSGEs), but for me the movement in inflation expectations works in the right direction for the NK DSGE interpretation.
I find it interesting that the same people who cite results from a CBO report (evaluating say, for instance, the impact of the minimum wage) then dismiss assessments from the same CBO. In any case, here is the CBO’s assessment of the American Recovery and Reinvestment Act’s impact — specifically what GDP would have been in the absence of the ARRA. The midpoint of CBO estimates is shown as blue; the CEA “model” estimate is very similar to this midpoint series (see Figure 5, here, for graph showing deviation from baseline/counterfactual).
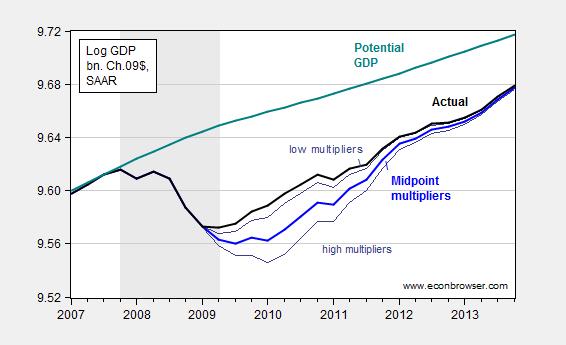
Figure 4: Log actual GDP (black), midpoint of CBO counterfactual of no stimulus (blue), high and low estimates (gray), and CBO estimate of potential GDP (teal), all in billions of Ch.2009$. Estimates presume no monetary policy tightening in response to fiscal stimulus. Source: BEA 2013Q4 advance release, CBO1, CBO, Budget and Economic Outlook, February 2014, and author’s calculations.
In other words, the range in the consensus implies some impact of the stimulus, not zero.
Because I know that some people will disbelieve what I write just because it’s coming from me, I’m going to quote from a vehement critic of the Administration’s policies, but somebody who understands macroeconomics — Doug Holtz-Eakin of the American Action Forum, and formerly Director of the CBO (via C-SPAN coverage of NABE, about 24 minutes in):
It’s pretty tough to throw a trillion dollars at the U.S. economy, and not do something, and so the whole notion that somehow this had no effect is badly misplaced.”
More discussion of fiscal policy and multipliers here, while a survey of recent thinking on fiscal multipliers for The New Palgrave Dictionary of Economics is here.
econbrowser.com |


