Gold And Silver: Bull Markets Are Just Beginning
Gold is up nearly 21% from its December 2015 lows. Moreover, silver has added an impressive 28% to its price during the same timeframe. Most notably, the HUI gold and silver mining index is up over 100% during this period.
Despite the strong performance we have seen from the precious metals complex thus far in only the first few months of 2016, many fear that the move is already nearing an end. Readers should be aware that the potential for both gold, silver, and strong mining equities is much greater than the moves seen thus far. Indeed, a review of the metals and several valuation metrics over a longer timeframe can provide us with clues as to what we should expect through the later part of this decade.
Below we review the long-term perspective for gold since the year 2000. Gold bottomed in 2001 after a nearly 20-year bear market following the peak in 1980 at $850/oz. The return advance to again challenge the $850 level took eight years, although it was not until the following year (2009) that prices decisively broke through this level for good.

Gold then advanced for two years above the former all-time high, hitting $1,917/oz in 2011, before falling back some 45% over the course of nearly five years through the end of 2015.
Markets that consolidate for 29 years (1980 - 2009) below an important peak level ($850) do not finish their subsequent advances in only two years. What was seen from 2009-2011 was simply the initial surge higher from the multi-decade 1980 - 2009 consolidation. The retreat since 2011 is thus a correction within what will be a more significant move higher both in time and in price above the former 1980 peak.
The break of the primary downtrend (shown by the turquoise lines above) is a major signal that the bear market had come to an end in December. Again, markets do not finish a multi-decade consolidation with a two-year surge higher. We are thus setting up for a resumption of the bull market, which should achieve a price multiple well above the $1,917 peak from 2011.
Zooming in on the break of the primary downtrend above (using the GLD fund as a proxy for short-term data) we can clearly see the well-contained consolidation that has been forming between roughly $1,205 and $1,285 since February. This grinding action has many people in the sector concerned, but this is not a top. The longer this consolidation continues, the more powerful it becomes to set up the next move higher, for the exact reason that it is happening below most investors' radar screens. Consolidations cause short-term investors to lose interest, but when taken in the context of a newly emerging bull market, they are extremely healthy setups indeed.
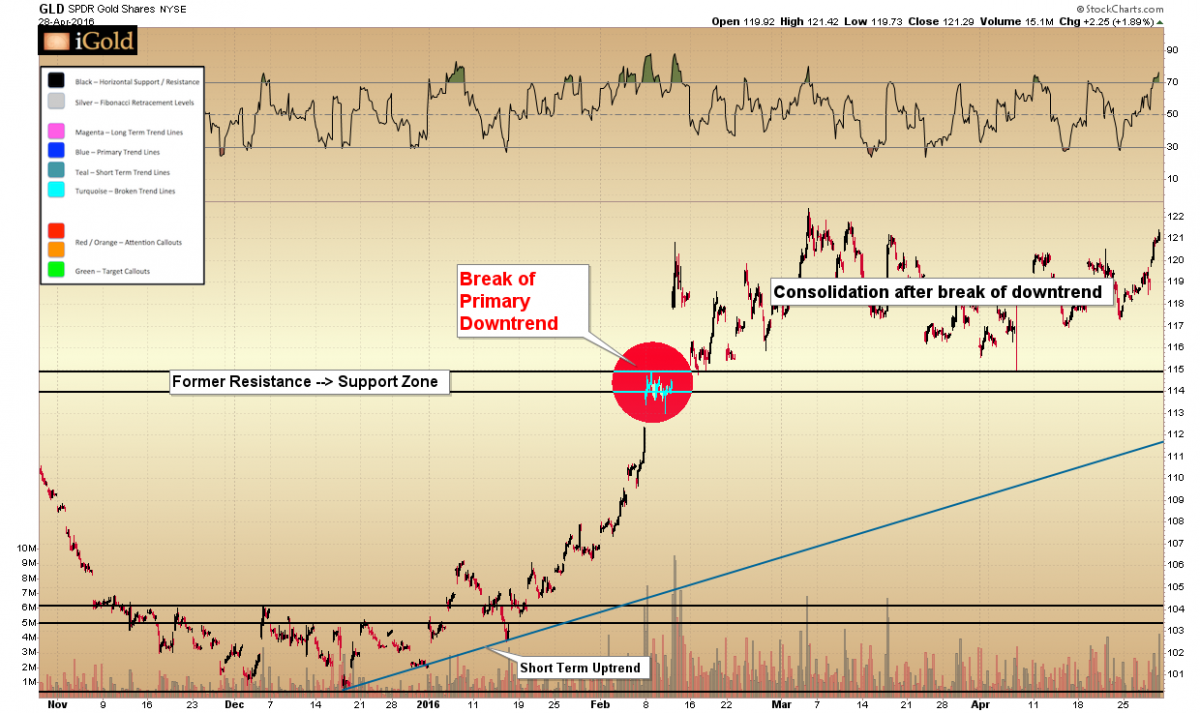
At some point within the next several months, this consolidation will begin to break to the upside. It would not be surprising for the price of gold to wait until the short-term (teal-colored) uptrend line from December catches up with it in June or July.
Silver
Silver is now confirming the move higher in gold.
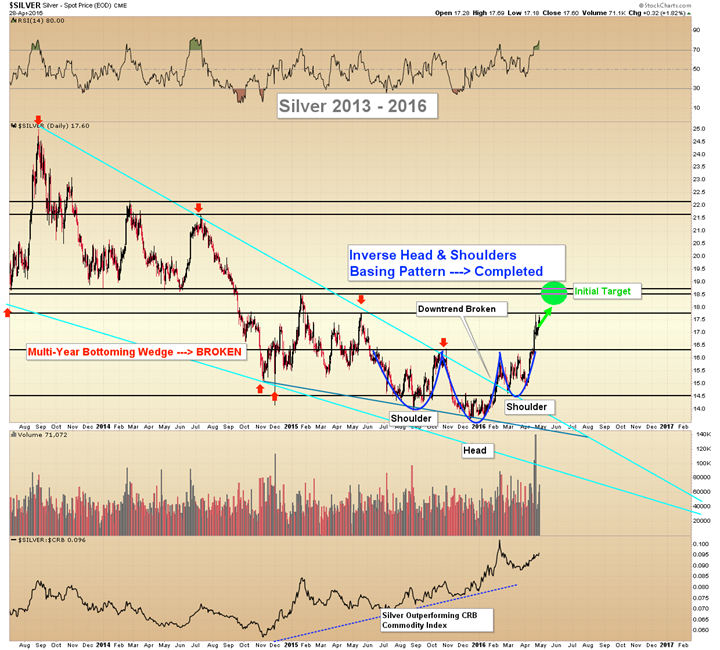
Technical analysis shows that just in the last week silver has broken out of its Inverse Head & Shoulders basing pattern, decisively breaking the $16.25 resistance level that had held prices in check for almost a year.
Our initial target based on the measurement of this pattern is $18.50-75 within the next 2-3 weeks. At that point, we will have to judge the market action. We view any purchases under this immediate target level as excellent long-term value buys, even as we know silver is prone to violent reactive corrections to the tune of $1-2 at any time. Buying on dips is now the recommended strategy going forward for bullion accumulation.
Silver equities continue to confirm this long-term bottom.
Gold to Silver Ratio
Turning to the gold to silver ratio, just in the last week as silver broke higher through our important resistance level near $16.25, we note an important trend change in the ratio between the two precious metals.
Below we show this over the five-year perspective. This ratio asks, in other words: how many ounces of silver does it take to buy one ounce of gold?
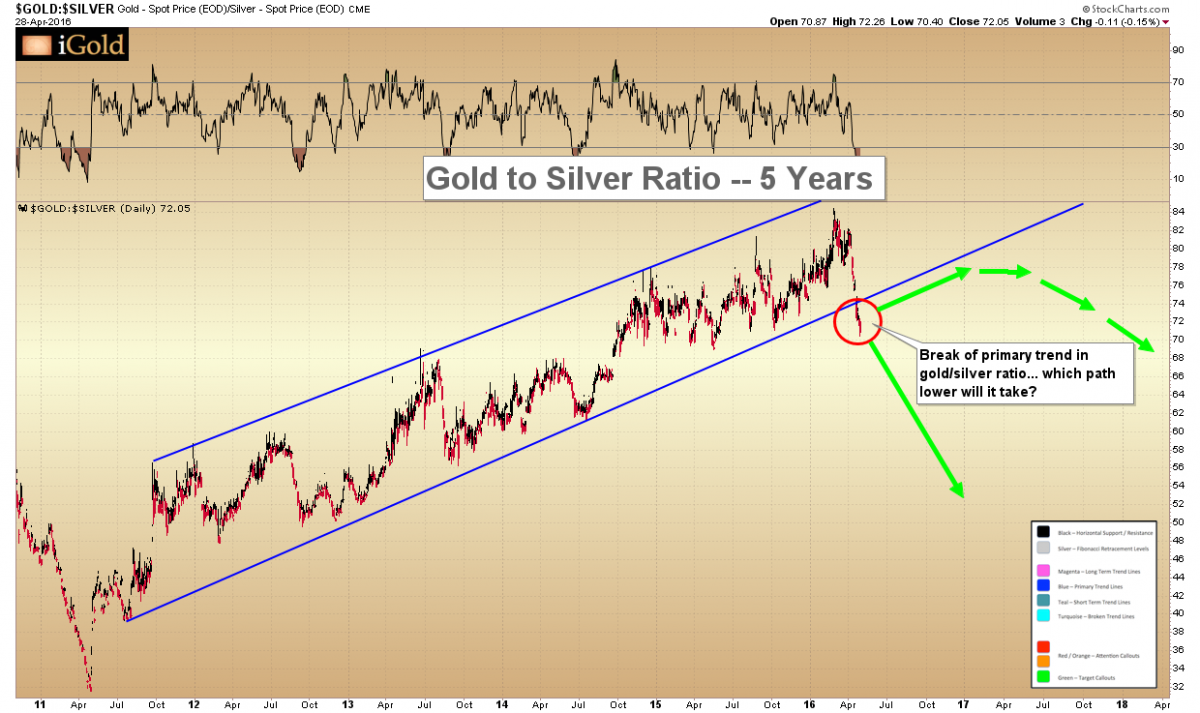
Since the precious metals peak in 2011, as both gold and silver fell, it should be observed that silver had fallen further than gold on a percentage basis. Whereas in April of 2011 it took roughly 30 ounces of silver to buy one ounce of gold, in January of 2016 it took an incredible 84 ounces of silver to buy that same one ounce.
The break we have just seen this week is important. Note how the ratio has broken downward (in favor of silver) toward the 72 region, thus cutting through the lower royal blue trendline on our chart.
Breaks of such trendlines mean exactly that: the trend is changing, and in this case it is changing in favor of silver.
The only question that remains is: what sort of trajectory will the new trend take? We expect both metals to rise over the years ahead. For example, we expect that within the same timeframe, plus or minus a year, gold will re-challenge $1,900 while silver makes another attempt at $50. Based on the numbers from current prices, we would be looking at a 54% rise in gold and a 194% rise in silver to reach those targets. Will the outperformance in silver occur quickly, as shown by the green arrow above moving strongly down in its favor? Or will silver take its time and form more of a rounded topping pattern, perhaps moving evenly with gold for the next 1-2 years, before beginning to outpace its monetary cousin more earnestly in 2018?
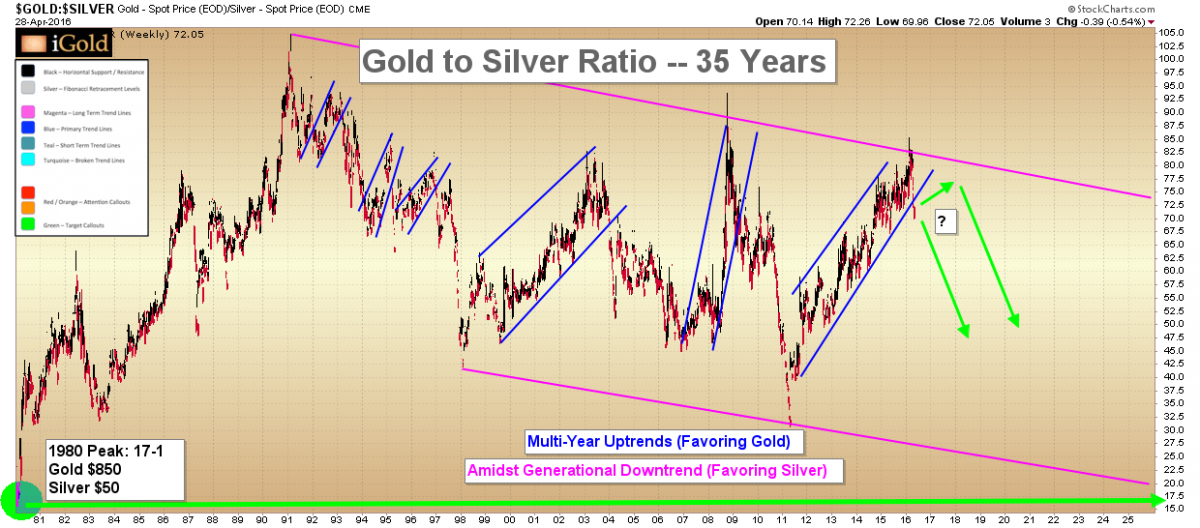
Typically throughout history, the ratio does not stay at such elevated levels for more than a few years at a time. We can observe the importance of these trend changes below in the 35-year perspective, as typically when multi-year trends in favor of gold break downward, silver then begins to outperform relatively quickly. Silver outperformance should thus be expected within two years at maximum.
We should not neglect at this point to offer reminders that there are still many good reasons to own physical gold, and much will depend on the individual circumstances. Ease of portability is a major one: it is much easier to quickly move $50,000 - $100,000 undetected across a border in gold coins than in silver bars (this is not a recommendation to do so, it is just an observation of human behavior throughout history). Such gold could fit into a small handbag. Gold, of course, holds up much better against the elements as it never tarnishes or corrodes. In the final stages of the German Weimar hyperinflation of the 1920's, gold's percentage gains actually outpaced those of silver, as the ease of transportation caused it to enjoy a valuation premium that silver never gained.
We mention these points as counter-balances to what may be an inclination to want to go all-in on silver. Will silver outpace gold in the years ahead? Most likely. But could this take longer than we expect, and are there still good reasons to own gold? Yes.
Let us not discount both the material and psychological benefits to owning both metals. Both are intrinsically related. And while it appears that silver will begin to outperform gold over the next few years, major opportunity awaits those able to recognize the important long-term trends now just beginning to emerge across the entirety of the precious metals complex.
Christopher Aaron |


