More evidence for them to deny...
Observing long-term climatic changes with unusual sources
May 4, 2016
Ed Hawkins
We are all familiar with the usual metrics used to highlight that the climate is changing: surface air temperatures, sea level, sea surface temperatures and ocean heat content all rising, glaciers retreating, Arctic sea ice declining etc. But, there are also many other less well known sources of information about how our climate is changing, and many involve ‘citizen scientists’, who often didn’t realise the potential long-term benefits of the data they were collecting.
Without reliable meteorological observations over the past few centuries (or access to a time machine), climate scientists have to rely on piecing together evidence of historical changes in climate from a wide range of sources. Interpreting this data is often not straightforward, but a consistent picture does emerge.
For example, there has been a recent study examining ice freeze dates in a lake in Japan back to 1443, and ice break-up dates in a river in Finland back to 1693 (also summarised by National Geographic). The Japanese measurements were taken by monks as part of a religious ceremony, and the Finnish measurements were started by a merchant involved in river trade. Both show changes over time, consistent with warming temperatures, although local non-climate factors will also clearly be important (Figure 1).
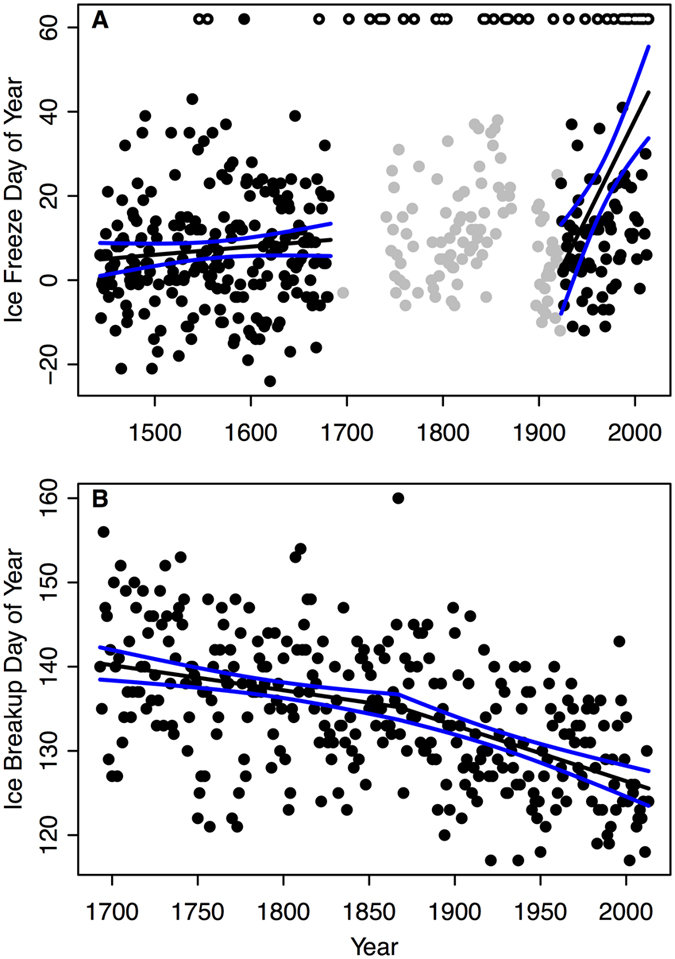 Figure 1: Figure 1:
Long-term observations of ice dates for Lake Suwa in Japan (A, ice freeze) and for the Torne River in Finland (B, ice breakup). Black dots indicate ice dates. Solid black lines indicate the best fit line of mean ice dates, and solid blue lines bound the 95% confidence interval around the estimated means. For Suwa (A), black dots with white centers indicate years when the lake did not freeze and gray points indicate years where the ice dates were considered unreliable. From Sharma et al. 2016
Similarly, in North America, the annual dates in the spring when winter ice cover leaves a lake has come to be known as ‘ice out’, and these dates have been measured by those who live on the lakes since 1836. A recent study analysed records from 12 lakes (Figure 2) and all show consistent trends towards earlier ‘ice-out’ dates. There is also considerable variability, likely due to contributions from variations in the atmospheric circulation, such as the North Atlantic Oscillation.
Figure 2: Julian Day ice out dates plotted against calendar year for the lakes used [Auburn (AUB), Cobbosseecontee (COB), Damariscotta (DAM), Moosehead (MOO), Oromocto (ORO), Rangeley (RAN), Sebec (SEB), Skiff (SKI), Sunapee (SUN), Utopia (UTO), West Grand (WGL), Winnipesaukee (WIN)]. From Patterson & Swindles 2015.
The Nenana Ice Classic is a similar record, measuring the break-up of ice in Alaska since 1917. 2016 was one of the earliest break-ups in the long record.
Another source of not-often-discussed climate data is lake temperatures. Summer lake temperatures using in-situ measurements and satellite data have increased in the vast majority of lakes across the world (Figure 3). These changes are important as warming surface waters means less mixing with deeper waters, depriving the lower layers of oxygen, with harmful consequences for lake marine life. Longer records based on only in-situ data back to 1910 are also under construction.
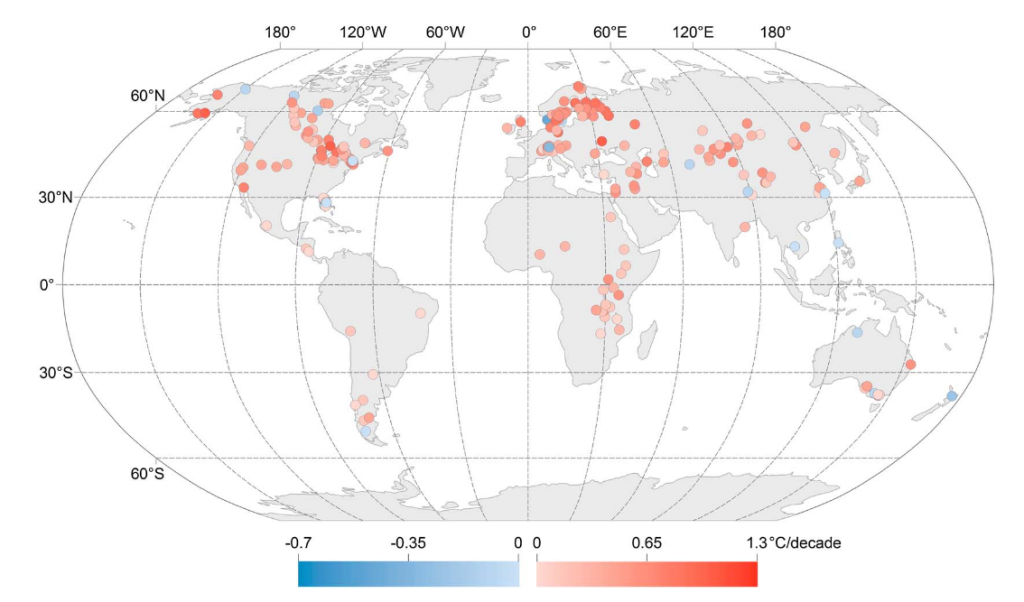 Figure 3: Map of trends in lake summer surface temperatures from 1985 to 2009. Most lakes are warming, and there is large spatial heterogeneity in lake trends. Note that the magnitudes of cooling and warming are not the same. From O’Reilly et al. 2015 Figure 3: Map of trends in lake summer surface temperatures from 1985 to 2009. Most lakes are warming, and there is large spatial heterogeneity in lake trends. Note that the magnitudes of cooling and warming are not the same. From O’Reilly et al. 2015
Moving to the natural world, one of the longest records is from Japan, where the flowering of Cherry trees has been recorded for centuries. A study in 2009 highlighted considerable variability in the flowering day in Kyoto, with a recent trend toward earlier dates (Figure 4). A temperature increase of 1°C moves the flowering dates around 3-5 days earlier. Urbanisation effects are important in this example, but trees from a range of local environments allows the climate related signal to emerge.
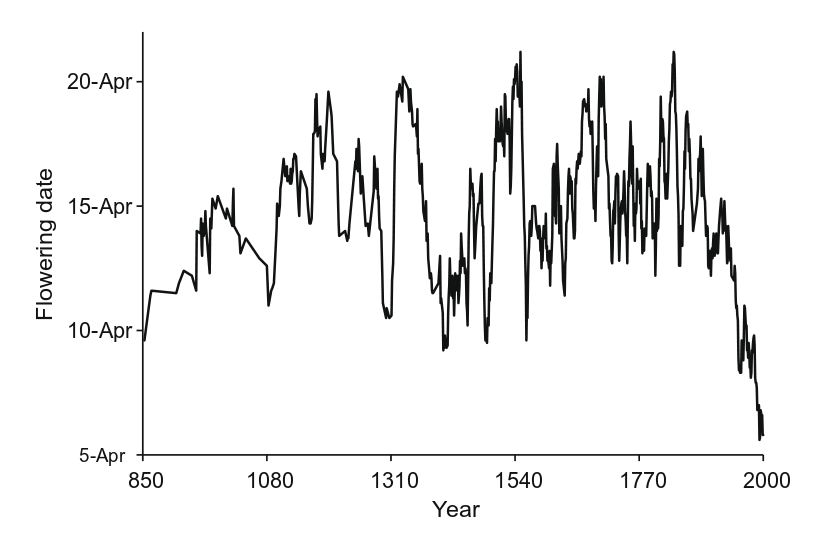 Figure 4: Ten year running averages of cherry blossom dates in Kyoto. From Primack et al 2009. Figure 4: Ten year running averages of cherry blossom dates in Kyoto. From Primack et al 2009.
A final recent example is grape harvest dates in the Czech Republic (available since 1499), which have become much earlier in recent decades due to rising temperatures (Figure 5). There are obvious non-climatic factors which influence the date of grape harvest (e.g. wars, taste etc), but the grape type has apparently been rather constant.
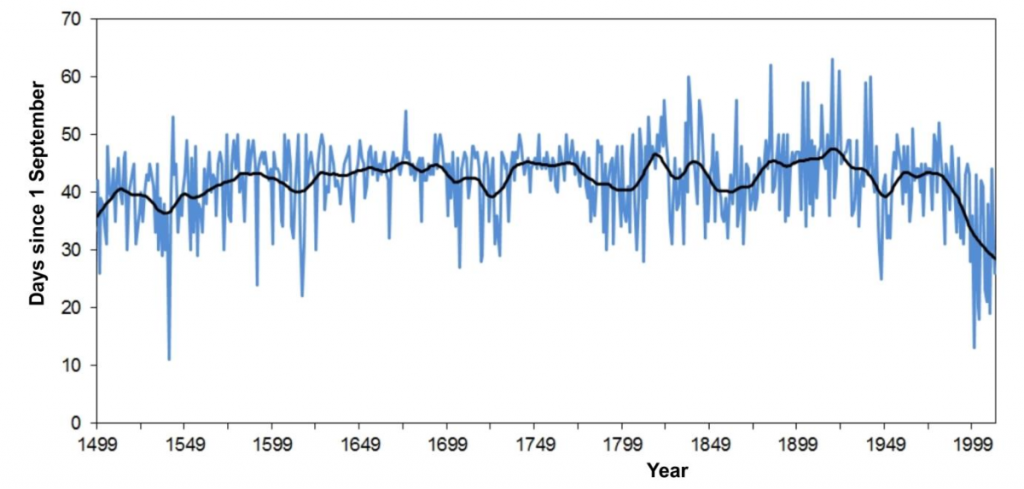 Figure 5: Fluctuations in grape harvest days (in days after 1 September) for the Bohemian wine growing region in the 1499–2012 period. Smoothed by Gaussian filter over 30 years. From Mozny et al. 2016 Figure 5: Fluctuations in grape harvest days (in days after 1 September) for the Bohemian wine growing region in the 1499–2012 period. Smoothed by Gaussian filter over 30 years. From Mozny et al. 2016
Other records of this type have been discussed elsewhere, such as the London Thames Barrier closings, the Elfstedentocht, location of English vineyards, and I am sure there are many, many more.
Overall, these non-traditional measurements of climate tell a consistent picture of a warming world, with considerable interannual and decadal variability, and local non-climatic factors affecting many aspects of traditional events and measurements.
More needs to be done to rescue the billions of instrumental weather observations taken since ~1800, which are currently languishing in various archives around the world (e.g. OldWeather.org), but I would be interested to hear of any ‘data rescue’ activities needed for these non-standard types of observation too.
climate-lab-book.ac.uk |


