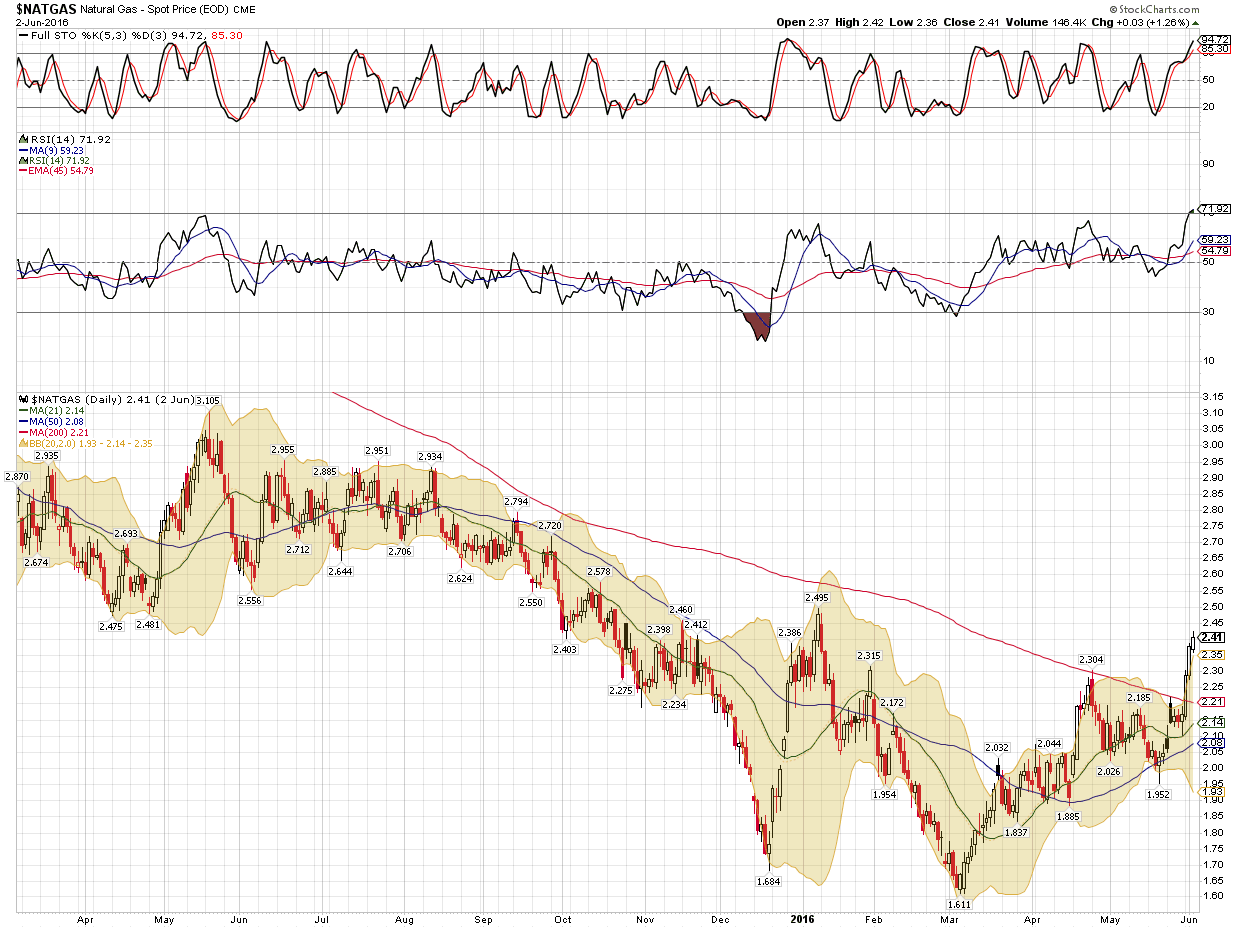
Natural Gas has had the best rally in over a year and the upcoming very hot summer will see an increase in utilization rates of Natural Gas as the Electricity Plants will be working overtime to provide the Air conditioning which has become the most important season for Natural Gas.
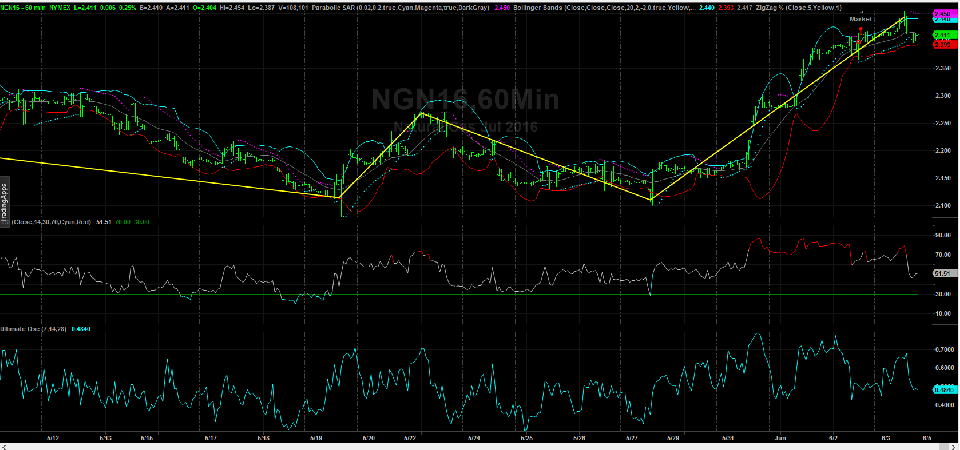
the July contract 60 minutes.....
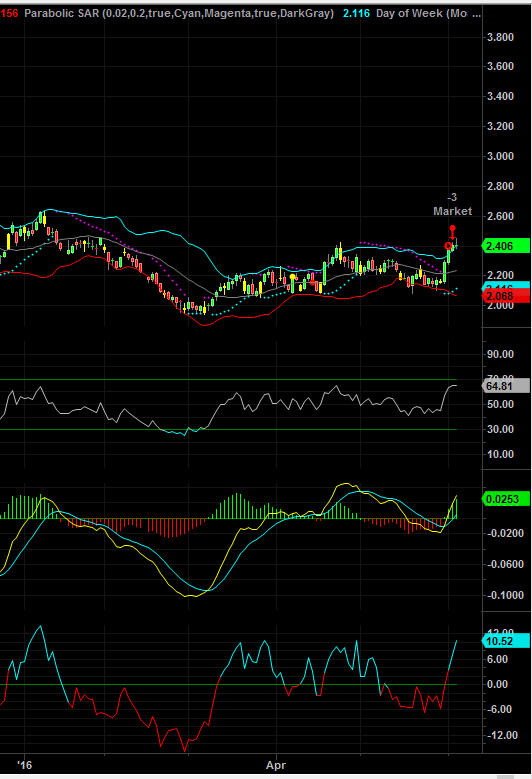
The daily July contract having the most robust rally in a year.......
the 1 year 3 month daily Natural Gas Chart........ showing the powerful rally
here is a chart of the NYSE advancing/ declining issues using a 2 period RSI which is a periodicity that
has been getting some field tests from oxfordstrat.com
the 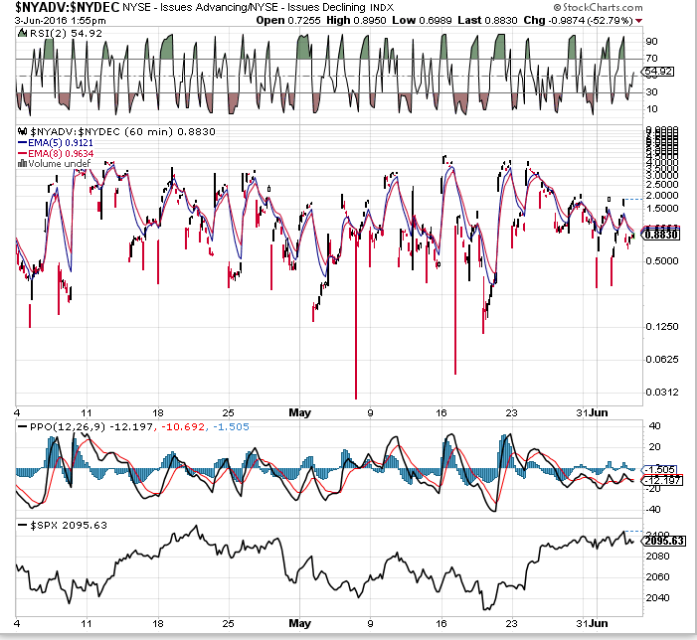
---------------------------
Relative Strength Index (RSI) Model | Trading Strategy (Filter)Posted on 2016/05 by R&D -- click to your left
(all of their studies and reseach are accessible by clicking on the R&D link in blue just above)
I. Trading StrategyDeveloper: Larry Connors (The 2-Period RSI Trading Strategy), Welles Wilder (The RSI Momentum Oscillator). Source: (i) Connors, L., Alvarez, C. (2009). Short Term Trading Strategies That Work. Jersey City, NJ: Trading Markets; (ii) Wilder, J. W. (1978). New Concepts in Technical Trading Systems. Greensboro: Trend Research. Concept: The long equity trading system based on the 2-Period RSI (Relative Strength Index). Research Goal: Performance verification of the simple trading strategy that buys pullbacks in a bull market. Specification: Table 1. Results: Figure 1-2. Trade Filter: The 2-Period RSI closes below RSI_Threshold (Default Value: RSI_Threshold = 5). Portfolio: Five equity futures markets (DJ, MD, NK, NQ, SP). Data: 36 years since 1980. Testing Platform: MATLAB®.
II. Sensitivity TestAll 3-D charts are followed by 2-D contour charts for Profit Factor, Sharpe Ratio, Ulcer Performance Index, CAGR, Maximum Drawdown, Percent Profitable Trades, and Avg. Win / Avg. Loss Ratio. The final picture shows sensitivity of Equity Curve.
Tested Variables: RSI_Threshold & Exit_Look_Back (Definitions: Table 1):


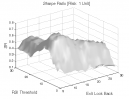


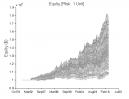
Figure 1 | Portfolio Performance (Inputs: Table 1; Commission & Slippage: $0).
| Auxiliary Variables: | The 2-Period Relative Strength Index (RSI):
The Relative Strength Index (RSI) is a momentum oscillator that compares the magnitude of recent gains to recent losses to determineoverbought and oversold conditions.
RSI(Close, RSI_Look_Back) is the Relative Strength Index of the close price over a period of RSI_Look_Back;
Default Value: RSI_Look_Back = 2.
Formula:
We use an exponential smoothing.
Up = max(Close - Close[i - 1], 0);
Down = max(Close[i - 1] - Close, 0);
AvgUp = (AvgUp[i - 1] * (RSI_Look_Back - 1) + Up) / RSI_Look_Back;
AvgDown = (AvgDown[i - 1] * (RSI_Look_Back - 1) + Down) / RSI_Look_Back;
RS = AvgUp / AvgDown;
RSI = 100 - 100/(1 + RS);
Index: i ~ Current Bar.
Note:
The first “AvgUp” (i.e. AvgUp[1] ) is calculated as a simple average of “Up” values over a period of RSI_Look_Back.
The first “AvgDown” (i.e. AvgDown[1]) is calculated as a simple average of “Down” values over a period of RSI_Look_Back. | RSI_Look_Back = 2; | | Setup: | Long Setup:
MA(Close, Setup_Look_Back) is a simple moving average of the close price over a period of Setup_Look_Back;
Default Value: Setup_Look_Back = 200;
Setup Rule: Close > MA;
Index: i ~ Current Bar. | Setup_Look_Back = 200; | | Filter: | Long Filter:
The RSI closes below RSI_Threshold;
Default Value: RSI_Threshold = 5;
Filter Rule: RSI < RSI_Threshold;
Index: i ~ Current Bar. | RSI_Threshold = [2, 30], Step = 1; | | Entry: | Long Entry:
A buy at the open is placed after a bullish Setup/Filter.
Note: In the original model, a buy at the close is placed on the same bar as a bullish Setup/Filter. | | | Exit: | Trend Exit: MA(Close, Exit_Look_Back) is a simple moving average of the close price over a period of Exit_Look_Back;
Default Value: Exit_Look_Back = 5;
Exit Rule: A sell at the open is placed if Close[i - 1] > MA[i - 1];
Index: i ~ Current Bar.
Stop Loss Exit: ATR(ATR_Length) is the Average True Range over a period of ATR_Length. ATR_Stop is a multiple of ATR(ATR_Length). Long Stop: A sell stop is placed at [Entry - ATR(ATR_Length) * ATR_Stop]. | Exit_Look_Back = [5, 30], Step = 1;;
ATR_Length = 20;
ATR_Stop = 6; | | Sensitivity Test: | RSI_Threshold = [2, 30], Step = 1
Exit_Look_Back = [5, 30], Step = 1 | | | Position Sizing: | Initial_Capital = $1,000,000
Fixed_Fractional = 1%
Portfolio = 5 Equity Futures (DJ, MD, NK, NQ, SP)
ATR_Stop = 6 (ATR ~ Average True Range)
ATR_Length = 20 | | | Data: | Five equity futures markets (DJ, MD, NK, NQ, SP); 36 years (1980/01/01-2016/04/30) | |
Table 1 | Specification: Trading Strategy.
III. Sensitivity Test with Commission & SlippageTested Variables: RSI_Threshold & Exit_Look_Back (Definitions: Table 1):


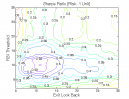


Figure 2 | Portfolio Performance (Inputs: Table 1; Commission & Slippage: $50 Round Turn).
IV. BenchmarkingWe benchmark the base case strategy (default parameters) against alternatives:
Case #1: RSI_Threshold = 5; Exit_Look_Back = 5 (Base Case).
Case #2: RSI_Threshold = 5; Exit_Look_Back = 10.
Case #3: RSI_Threshold = 10; Exit_Look_Back = 10.
Case #4: RSI_Threshold = 15; Exit_Look_Back = 10.
| Net Profit ($) | 119,305 | 215,290 | 472,423 | 410,503 | | Sharpe Ratio | 0.28 | 0.38 | 0.56 | 0.44 | | Ulcer Performance Index (UPI) | 0.30 | 0.50 | 0.93 | 0.67 | | Profit Factor | 1.40 | 1.59 | 1.71 | 1.47 | | CAGR (%) | 0.34 | 0.59 | 1.17 | 1.04 | | Max. Drawdown (%) | (4.64) | (4.86) | (3.96) | (4.24) | | Percent Profitable Trades (%) | 69.82 | 73.17 | 75.50 | 74.89 | | Avg. Win / Avg. Loss Ratio | 0.61 | 0.58 | 0.55 | 0.49 |
Table 2 | Inputs: Table 1; Fixed Fractional Sizing: 1%; Commission & Slippage: $50 Round Turn.
V. ResearchConnors, L., Alvarez, C. (2009). Short Term Trading Strategies That Work. Jersey City, NJ: Trading Markets:
Most traders use the 14-period RSI. But our studies have shown that statistically, there is no edge using the 14-period RSI. However, when you shorten the time frame of the RSI (meaning you go much lower than the 14-period) you start seeing some very impressive results. Our research shows that more robust and consistent results are obtained by using a 2-period RSI and we have built many trading methods that incorporate the 2-period RSI […] The lower the RSI, the greater the performance. The average returns of stocks with a 2-period RSI reading below 2 were greater than those stocks with a 2-period RSI reading below 5, etc.
VI. Rating: Relative Strength Index (RSI) Model | Trading StrategyA/B/C/D
VII. Summary(i) The trading strategy based on the 2-Bar Relative Strength Index underperforms alternative momentum models; (ii) The preferred parameters are: 5 = RSI_Threshold = 13; 8 = Exit_Look_Back = 13 (Figure 1-2).
Related Entries: Relative Strength Index (RSI) Model (New Exits) | Long Equity Trading System (Filter & Exit)| 3-Bar Momentum Pattern (Filter & Exit) | Hikkake Pattern (Filter & Exit)
Proprietary Strategies: ALPHA20TM Trading System | Robust Short-Term PatternsTM
Related Topics: (Public) Trading Strategies
Codes: matlab/connors/rsi-1
CFTC RULE 4.41: HYPOTHETICAL OR SIMULATED PERFORMANCE RESULTS HAVE CERTAIN LIMITATIONS. UNLIKE AN ACTUAL PERFORMANCE RECORD, SIMULATED RESULTS DO NOT REPRESENT ACTUAL TRADING. ALSO, SINCE THE TRADES HAVE NOT BEEN EXECUTED, THE RESULTS MAY HAVE UNDER-OR-OVER COMPENSATED FOR THE IMPACT, IF ANY, OF CERTAIN MARKET FACTORS, SUCH AS LACK OF LIQUIDITY. SIMULATED TRADING PROGRAMS IN GENERAL ARE ALSO SUBJECT TO THE FACT THAT THEY ARE DESIGNED WITH THE BENEFIT OF HINDSIGHT. NO REPRESENTATION IS BEING MADE THAT ANY ACCOUNT WILL OR IS LIKELY TO ACHIEVE PROFIT OR LOSSES SIMILAR TO THOSE SHOWN.
RISK DISCLOSURE: U.S. GOVERNMENT REQUIRED DISCLAIMER | CFTC RULE 4.41
JP |


