zax,
I know this will probably take you a few times through to grasp the basic concepts of statistics...but try
=====
Sunday, September 18, 2016 Fun with Fake Statistics: The 5% "Increase" in Median Household Income Is Pure Illusion
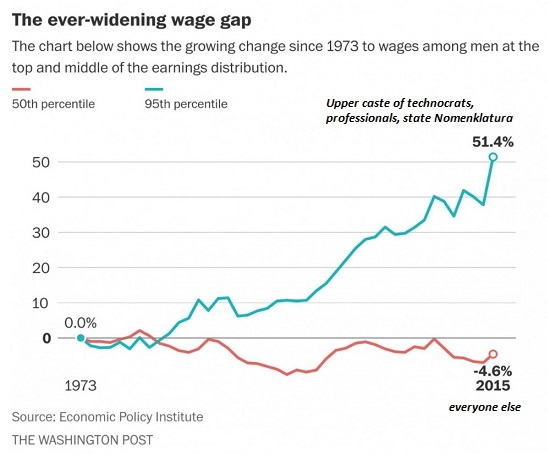
The truth is the rich are getting richer and everyone else is losing ground as inflation chews through stagnant incomes.
Supporters of the status quo nearly wet their pants with joy when the Census Bureau reported that real (adjusted for inflation) median household income rose 5.2% between 2014 and 2015. Too bad it was completely bogus: the supposed increase in everyone's income is pure statistical trickery.
First, the marks who fell for it: here's the Huffington Post wetting itself with glee: Average Americans Just Got a Huge Income Boost.
This headline is risibly wrong on a number of counts. Most importantly, a notch up in median household income doesn't mean "average Americans Just Got a Huge Income Boost": It means that half of households in 2015 earned more than $56,516 and half earned less than $56,516.
It does not mean every household saw a boost in income.
Please follow along as I show you how median household income works. Let's start with a simple sample group of ten households. Household #1 earns $40,000, #2 earns $41,000 and so on, as each additional household earns $1,000 more than the previous household. Household #10 earns $49,000.
The median income of our group is $44,500, as 50% earn less than $44,500 and 50% earn more than $44,500.
As the economy expands, it adds two households earning $48,000 and $49,000 respectively. Meanwhile, the income of the two households that had earned $48,000 and $49,000 respectively each leaps to $250,000 each.
The median household income of the group increases to $45,500, but only the top two households experienced any increase in real income--and their income soared. The "average household" didn't make a dime more, even as the economy expanded and income for the entire group rose an astonishing 45%.
You see what happened as median household income increased: all the gains went to the top layer--"average" household income didn't rise at all. See how much fun we can have with misleading statistics?
Yes, median household income would rise if every household earned an additional $1,000. But an increase in median household income does not prove every household gained.
In fact, other statistics reveal that the increases in income and wealth have been concentrated in the top 1%, 5% and 10%.
Increases in household wealth continue to accrue to the top of the wealth pyramid: The "Devastating" Truth Behind America's Record Household Net Worth:
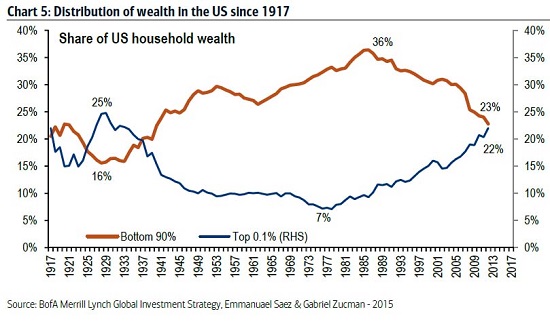
According to the CBO (Congressional Budget Office) report Trends in Family Wealth:
"...families in the top 10 percent of the wealth distribution held 76 percent of all family wealth. ...the difference in wealth held by families at the 90th percentile and the wealth of those in the middle widened from $532,000 to $861,000 over the period (in 2013 dollars). The share of wealth held by families in the top 10 percent of the wealth distribution increased from 67 percent to 76 percent, whereas the share of wealth held by families in the bottom half of the distribution declined from 3 percent to 1 percent."
Just to remind you how meaningless "median" measures really are, the "median household wealth" increased to $81,000 while the rich became much richer and the poor became poorer.
But this isn't the end of the "median household income" trickery: the key trick word is "real," which means adjusted for inflation.
I hope you see this coming: it all depends on how you measure inflation. As explained in this insightful expose, the Census Bureau didn't use the conventional Consumer Price Increase (CPI) measure of inflation; they used a lower deflator of income which magically boosts income--not in the real world, of course, but in the world of trickery, magic, smoke and mirrors, all designed to manage perceptions of a status quo that has failed the bottom 95% of households.
Deconstructing The 5.2% Median Income Gain—-More BS From The Washington Statistical Mills:
"Sentier Research uses the more familiar Consumer Price Index (CPI) for the inflation adjustment. The Census Bureau uses the little-known CPI-U-RS (RS stands for “research series”) as the deflator for their annual data.
The choice of the inflation-adjustment deflator makes all the difference in these median household income calculations."
If CPI is used, the "real median household income" has not even regained its 2008 level.
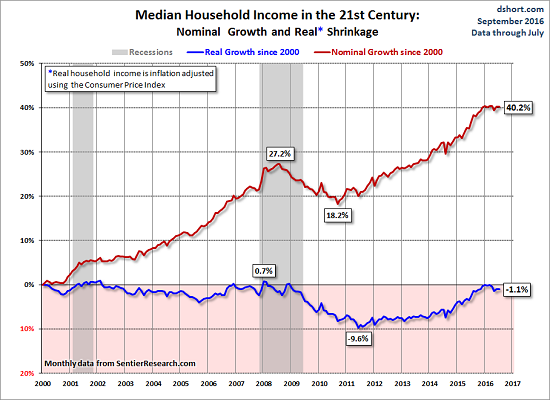
If "real" inflation is running hotter than "official" inflation--which it is if we properly weight the big-ticket items such as rent, healthcare and college tuition--then "real household income" has declined sharply since 2008: the 5% "gain" is completely illusory.
The Burrito Index: Consumer Prices Have Soared 160% Since 2001 (August 1, 2016)
Inflation Hidden in Plain Sight (August 2, 2016)
Revealing the Real Rate of Inflation Would Crash the System (August 3, 2016)
The truth is the rich are getting richer and everyone else is losing ground as inflation chews through stagnant incomes and rising debt loads stripmine disposable income. Bought and paid for cheerleaders for our failed, corrupt status quo will always hype bogus, purposefully misleading statistics--but don't mistake fakery for fact.
|


