Defying IPCC Models, U.S. Blizzard Frequency Has Nearly Quadrupled Since 1960, As U.S. Continues Cooling
By Kenneth Richard on 19. January 2017
What Models Say:? IPCC TAR (2001): “Milder winter temperatures will decrease heavy snowstorms“
? Kunkel et al., 2002: “Surface conditions favorable for heavy lake-effect snow decreased in frequency by 50% and 90% for the HadCM2 and CGCM1 [models], respectively, by the late 21st Century. This reduction was due almost entirely to … an increase in average winter air temperatures.”
? IPCC AR4 (2007): “Snow season length and snow depth are very likely to decrease in most of North America“
? Kapnick and Delworth, 2013: “In response to idealized radiative forcing changes, both models produce similar global-scale responses in which global-mean temperature and total precipitation increase while snowfall decreases. … By using a simple multivariate model, temperature is shown to drive these trends by decreasing snowfall almost everywhere” ( press release) “In North America, the greatest reductions in snowfall will occur along the northeast coast, in the mountainous west, and in the Pacific Northwest. Coastal regions from Virginia to Maine … will get less than half the amount of snow currently received.”
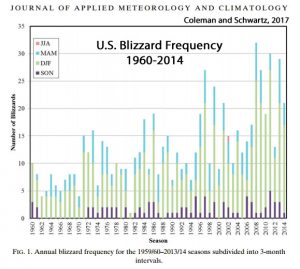
What Observations Say: Coleman and Schwartz, 2017“Data revealed 713 blizzards over the 55 years, with a mean of 13 events per season. Seasonal blizzard frequency ranged from one blizzard in 1980/81 to 32 blizzards in 2007/08. Federal disaster declarations resulting from blizzards totaled 57, with more than one-half of them occurring in the twenty-first century.”
“Storm Data attributed 711 fatalities during the 55-yr study period, with an average of one individual per event; 2044 injuries were reported, with a mean of nearly three per blizzard. Property damage totaled approximately $9.11 billion in unadjusted dollars, with an approximate mean of $12.6 million per storm.”
“Seasonal blizzard frequencies displayed a distinct upward trend, with a more substantial rise over the past two decades. … The modeled increase in blizzard activity showed a nearly fourfold upsurge between the start and end of the study period at 5.9 and 21.6 blizzards, respectively. On the basis of current model trends, the expected blizzard total for a season is 32 blizzards by 2050; uncertainty exists on whether the linear trend will continue or stabilize in the near future.”
The Historical Context: More Snow Means Temperatures Are Cooling, Not WarmingIt has long been assumed in the scientific community that snow coverage would decrease during warm periods, and increase during cool periods. For example:
Eichenlaub, 1970“Evidence suggests that lake effect snowfall has significantly increased during the past several decades, particularly in Southern Michigan and Northern Indiana. While the observed changes cannot be definitively ascribed to any single factor, it seems likely that a general cooling of winter temperatures may be partially responsible for this climatic change.”
[M]any of the snowfall time-series curves for the lake stations show downward trends during the 1920’s and 1930’s, at the height of the recent warm period, and the more recent snowfall increase has coincided with a general world-wide cooling which has occurred in the last several decades.
Recent evidence derived from [isotope] analysis of ice core samples on the Greenland ice cap indicates a continuance of this cooling trend for another 20 or 30 years.”
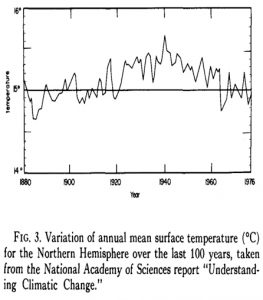
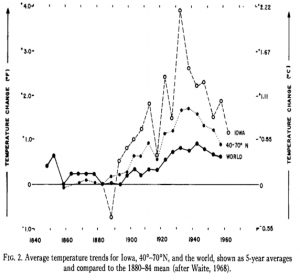
What Dr. Eichenlaub was describing with regard to the increasing and decreasing temperature and snowfall trends is explained by Dr. Agee (1980). The Northern Hemisphere’s surface temperatures warmed by “nearly 1°C” between 1890 and 1940, and then after 1940 and through the mid-1970s, the Northern Hemisphere experienced “comparable cooling” (almost -1°C). (Most of these observations of warming and cooling amplitudes have now been removed from modern Northern Hemisphere datasets via “adjustments” so as to comply with climate model projections.)
Agee, 1980 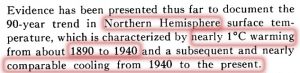
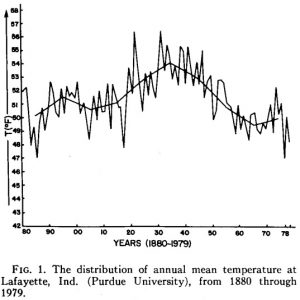
In the temperature records for Indiana and Iowa (U.S.), Agee (1980) reported that, following the overall hemispheric pattern, both states warmed sharply during the 1920s to 1940s and then cooled by more than 2°C in the decades after. This was the context that Eichenlaub (1970) was referring to in pointing out that the U.S. had been experiencing a long-term cooling trend since the 1940s which led to a significant increase in snowfall.
The U.S. Cooling Trend Has Returned In Recent Decades According to NOAA, winter temperatures for the contiguous U.S. declined at a rate of -1.13°F per decade between 1995 and 2014.
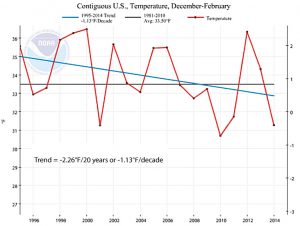
NOAA screenshotLarge Regions Of The U.S. Are Still Colder Now Than They Were In The 1950s Rogers, 2013 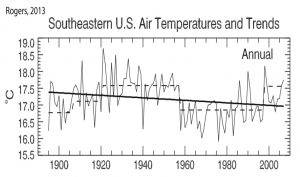
Christy and McNider, 2016 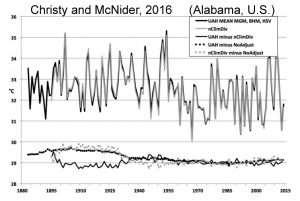
Tipton et al., 2016 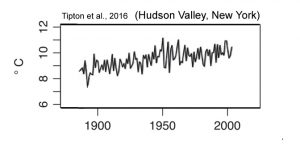
North American Continent Is Not Discernibly Warmer Than During The Little Ice Age Gennaretti et al., 2014 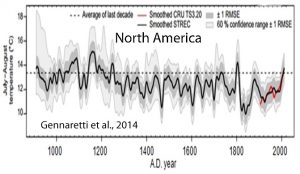
Pitman and Smith, 2012 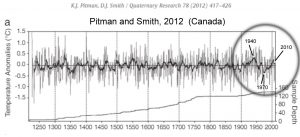
Steinman et al., 2016 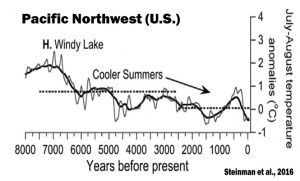
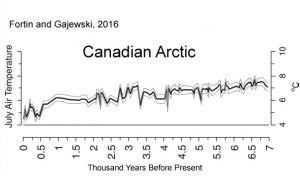
Fortin and Gajewski, 2016“Biological production decreased again at ~ 2 ka and the rate of cooling increased in the past 2 ka, with coolest temperatures occurring between 0.46 and 0.36 ka [460 and 360 years ago], coinciding with the Little Ice Age. Although biological production increased in the last 150 yr, the reconstructed temperatures do not indicate a warming during this time. … Modern inferred temperatures based on both pollen and chironomids are [currently] up to 3°C cooler than those inferred for the mid-Holocene.”
SummaryIt is widely accepted that enhanced snow cover and more frequent snow storms (blizzards) occur when winter temperatures are cooling (or cooler relative to an identified warm period). U.S. temperatures cooled dramatically after the 1940s and 1950s, and they may only have recently reached the levels of warmth achieved in the first half of the 20th century, when snow cover was significantly reduced. Blizzard frequency has increased almost four-fold since 1960, even as climate models have claimed they should be declining in frequency. This increase in snow storms has coincided with a 20-year (1995-2014) winter temperature cooling trend in the U.S.
Overall, there has been no discernible anthropogenic influence on U.S. snow storm frequency in the last several decades, and there has been no discernible anthropogenic influence on U.S. temperatures in the last several hundred years, or even the last several decades relative to the early 20th century.
- See more at: notrickszone.com |
|


