Hi Graham, excellent analysis.
And remember the 1970's were a decade of incredible price inflation in all commodities and prices generally.
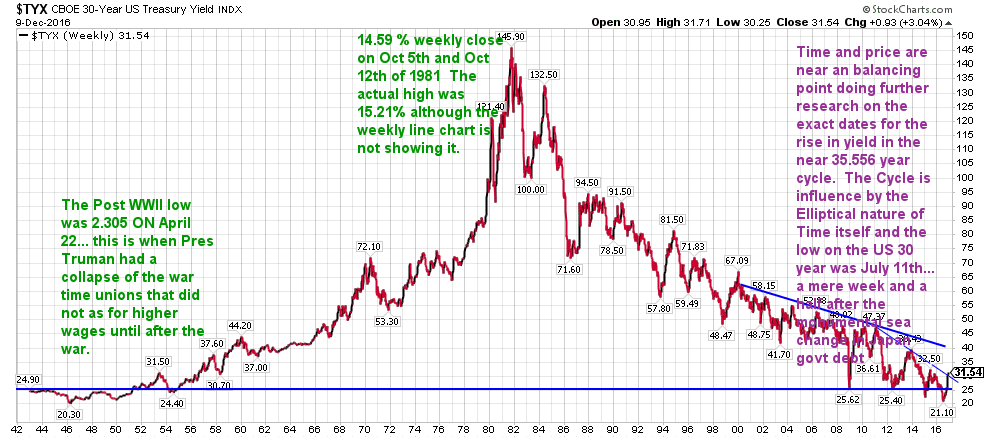
Prices went up exponentially into 1980 and then came down dramatically in the 1980's.. As well as interest rates had a 36 year period of increase into oct 19th of 1981 and we have now witness a corresponding time window of falling interest rates in the US.
In the below post we see how the entire 36 year secular bear market in bonds heading into Oct of 1981 and now our secular bull market in bond prices has reached it's time and price window to end.:
---------------------------
| To: John P who wrote (18356) | 12/12/2016 3:44:19 AM | | From: John P | 1 Recommendation of 18620 | | | July of 2016 is when we saw the ending of the nearly 36 year cycle in the secular bull market in bonds with yields going lower and lower. The Japanese who had created the biggest speculative bubble in Japanese equities ( 44% of global market capitalization) had also created a massive bubble in real estate in Japan, Hawaii, NY.... where they were sold Rockefeller Center, the Citibank Building, The Chase Manhattan building, Chemical, Manny Hanny, Exxon, Mobil........ Pebble beach..... as 135 lb Takeru Kobayashi Nathan's 4th of July hot dog eater... there seemed no limit as to what the Japanese would try to subsume and add to their neverending global portfolio's and dominance of Japanese management techniques.. that were taught at Harvard Business school, Dartmouth..... at top companies in the US such as Exxon, IBM, GE and in numerous case studies.

When the tremendous leverage and interlocking relationships between Large Japanese consortium's what happened is that instead of non performing and overvalued assets getting marketed down; bankruptcies occurring, instead as part of the 20th century culture of the Japanese saving face.... the assets that if marked to market would have instigated a whole sale cleaning of non performing and widely overvalued assets was allowed to not occur... since this was the Japanese way. It did not advance Japan's economic interests.... and that goes a long way to explaining how Japanese went from being the economy that was destined to take over the world and has given us the much reduced stance and the slowly acquired understanding of the Greek word Hubris.. As Bankers Trust trader Tom Wallace always told me that Hubris is the fall of man.
Now this is chapter one of how Japan has indeed gone on to take us into the "Alice through the looking glass world of Negative government rates on JGB's.... and in fact, created a rally from April until July of 40% in price on Long dated Japanese Government bonds.
what the upcoming chapters will examine is how Japan reached the Vortex of Truth in their efforts to drive long government rates to the lowest lows that we would experience in our lifetimes and when they realized that the strategy was literally and metaphysically bankrupt.
that occurred in the beginning of July of this year as the market cognoscenti had started to realize that time and price of the the 35 year 6 month increase in US 30 year rates that began on April 22 1946 at 2.30% and ended on Oct 19th 1981... was reaching it's Natural GANN time and price achieving equality was occurring as the Japanese Government made a dramatic reversal in direction at the start of July of this year.
Observe with this chart....
| To: John P who wrote (18355) | 8/8/2016 3:00:39 AM | | From: John P | Read Replies (2) of 18504 | | Japanese Bond Selloff Pushes Yields Near Positive
Investors have been shedding Japanese government bonds since Friday’s central-bank disappointment
By RACHEL ROSENTHAL and HIROYUKI KACHI
Updated Aug. 2, 2016 10:02 a.m. ET
A selloff in Japan’s 10-year government bonds sent these negative-yielding assets within a hair of positive territory.

Yields on the benchmark 10-year Japanese government bond rose Tuesday as high as minus-0.025%—the highest level since March 16—compared with minus-0.145% Monday. They were around minus-0.06% late afternoon in Asia. Yields rise when bond prices fall.
|
The 0.2-percentage-point climb in yields over three sessions is the biggest move since May 2013, a month after Bank of Japan Gov. Haruhiko Kuroda introduced his first “bazooka” of monetary easing.
Japanese government-bond prices have been falling since Friday, when the central bank announced what amounted to modest policy tweaks—dashing expectations of an interest-rate cut further into negative territory and an expansion of asset purchases. The central bank’s easing program has fueled the fantastic run in bond prices since it started three years ago, so any hints the BOJ might be losing its punch has spooked bond investors.
Selling accelerated on Tuesday in the run-up to a government auction of 10-year bonds, and continued when results showed that demand remains weak.
Beyond the pervasive sense that the Bank of Japan’s monetary policy has reached its limit, the market was rattled by the central bank’s saying it plans a “comprehensive assessment” of policy in September. The rare bit of guidance has stirred questions among investors and analysts about what the BOJ—with a rich history of surprising markets—could be up to.
“What caught the market off-guard and was shocking for us was not that [the BOJ] would postpone additional easing, but rather that they are reviewing the structure of the current market,” says Tadashi Matsukawa, head of Japan fixed income at PineBridge Investments in Tokyo, who manages ¥80 billion ($782 million) in assets. “That means that potentially [the BOJ] might tighten rather than ease, and that’s a source of confusion.”
What shape any tightening could take is anyone’s guess. One option, for example, would be adjusting its ¥80 trillion annual asset-purchase target to a range, and reducing its lower boundary to ¥60 trillion but raising its upper boundary to ¥100 trillion, says Shuichi Ohsaki, a rates strategist at Bank of America Merrill Lynch in Japan.
Limiting asset purchases would damp the appetites of investors who have been buying shorter-dated Japanese government bonds, despite their negative yields, with the expectation of selling them later to the BOJ at even higher prices.
 ENLARGE ENLARGE
The Bank of Japan’s Haruhiko Kuroda announced modest changes Friday. PHOTO:KAZUHIRO NOGI/AGENCE FRANCE-PRESSE/GETTY IMAGES
BOJ Gov. Haruhiko Kuroda suggested that market players are mistaken if they expect the comprehensive assessment to lead to tightening. “I don’t think it will produce such results,” he told reporters following a meeting with Finance Minister Taro Aso. “There is no change in our policy stance to push down the entire yield curve” to stimulate growth and generate 2% inflation.
On Tuesday, the market was particularly tense ahead of a Ministry of Finance auction of more than ¥2 trillion in 10-year bonds. Demand was weaker than usual, but some market participants were reassured when it emerged that big Japanese banks bought up large chunks of the issuance, a sign of confidence that prices would arrest their downward spiral.
Mitsubishi UFJ Morgan Stanley Securities was the biggest buyer, snatching up ¥585 billion—27% of the total issuance—according to Quick.
PineBridge’s Mr. Matsukawa said the rise in 10-year yields was an “opportunity to buy,” though he would be stepping in “cautiously.”
Despite the cloudy outlook, analysts say they are skeptical that selling will continue, given the BOJ’s commitment to easing.
“The negative-rates policy is under way,” said Masahiro Ichikawa, senior strategist at Sumitomo Mitsui Asset Management, adding that the 10-year yield should eventually go back to the minus-0.1% interest rate the BOJ introduced earlier this year.
Earlier Tuesday, Japanese Prime Minister Shinzo Abe ’s cabinet also approved a ¥28 trillion ($274 billion) stimulus package, a widely telegraphed action that analysts said had already been priced in by markets.
—Kosaku Narioka contributed to this article.
http://www.wsj.com/articles/japanese-bond-selloff-pushes-yields-near-positive-1470137561
--------------------------------------
Lord Rothschild commented that "This Is The Greatest Experiment In Monetary Policy In The History Of The World" just as it appears to be winding down.
| To: John P who wrote (18370) | 8/18/2016 12:51:46 PM | | From: John P | 3 Recommendations of 18620 | | |
Lord Rothschild:
by Tyler Durden
Aug 17, 2016 10:27 AM
Two months ago, the bond manager of what was once the world's biggest bond fund had a dire prediction about how "all of this" will end (spoiler: not well).
Follow
 Janus Capital @JanusCapital Janus Capital @JanusCapital
Gross: Global yields lowest in 500 years of recorded history. $10 trillion of neg. rate bonds. This is a supernova that will explode one day
10:05 AM - 9 Jun 2016
823823 Retweets
530530 likes
Now, it is the turn of another financial icon, if from a vastly different legacy - and pedigree - that of Rothschild Investment Trust Chairman himself, Lord Jacob Rothschild, who appears to be the latest entrant to the bearish billionaire club.

We were surprised to find his summary of recent events downright gloomy, and certainly non-conforming with a stock "market", manipulated by central banks as it may be, trading at all time highs. Here are the key excerpts:
The six months under review have seen central bankers continuing what is surely the greatest experiment in monetary policy in the history of the world. We are therefore in uncharted waters and it is impossible to predict the unintended consequences of very low interest rates, with some 30% of global government debt at negative yields, combined with quantitative easing on a massive scale.
To date, at least in stock market terms, the policy has been successful with markets near their highs, while volatility on the whole has remained low. Nearly all classes of investment have been boosted by the rising monetary tide. Meanwhile, growth remains anaemic, with weak demand and deflation in many parts of the developed world.
Many of the risks which I underlined in my 2015 statement remain; indeed the geo-political situation has deteriorated with the UK having voted to leave the European Union, the presidential election in the US in November is likely to be unusually fraught, while the situation in China remains opaque and the slowing down of economic growth will surely lead to problems. Conflict in the Middle East continues and is unlikely to be resolved for many years. We have already felt the consequences of this in France, Germany and the USA in terrorist attacks.
As a result, Rothschild has put his money where his mouth is: "we have reduced our exposure from 55% to 44%. Our Sterling exposure was significantly reduced over the period to 34%, and currently stands at approximately 25%. We increased gold and precious metals to 8% by the end of June."
* * *
Not surprising, RIT's investment portfolio continues do quite well, and has now returned roughly 2,000% since inception

ere is the full section from the RIT Capital Partners' latest half-year financial report.
The six months under review have seen central bankers continuing what is surely the greatest experiment in monetary policy in the history of the world. We are therefore in uncharted waters and it is impossible to predict the unintended consequences of very low interest rates, with some 30% of global government debt at negative yields, combined with quantitative easing on a massive scale.
To date, at least in stock market terms, the policy has been successful with markets near their highs, while volatility on the whole has remained low. Nearly all classes of investment have been boosted by the rising monetary tide.Meanwhile, growth remains anemic, with weak demand and deflation in many parts of the developed world.
Many of the risks which I underlined in my 2015 statement remain; indeed the geo-political situation has deteriorated with the UK having voted to leave the European Union, the presidential election in the US in November is likely to be unusually fraught, while the situation in China remains opaque and the slowing down of economic growth will surely lead to problems. Conflict in the Middle East continues and is unlikely to be resolved for many years. We have already felt the consequences of this in France, Germany and the USA in terrorist attacks.
In times like these, preservation of capital in real terms continues to be as important an objective as any in the management of your Company’s assets. In respect of your Company’s asset allocation, on quoted equities we have reduced our exposure from 55% to 44%. Our Sterling exposure was significantly reduced over the period to 34%, and currently stands at approximately 25%. We increased gold and precious metals to 8% by the end of June. We also increased our allocation to absolute return and credit, which delivered positive returns over the period, benefiting from a number of special situations. Within this category our new association with Eisler Capital had an encouraging start. We expect this part of the portfolio to be an increasingly important contributor to overall returns.
On currencies, we reduced our exposure to Sterling in anticipation of Brexit and the generally unsettled UK political environment. Our significant US Dollar position has now been somewhat reduced as, following the Dollar’s rise, we saw interesting opportunities in other currencies as well as gold, the latter reflecting our concerns about monetary policy and ever declining real yields
Below is a snapshot of where every hedge fund wants to end up: the Rothschild investment portfolio.


-----------------

zerohedge.com
interesting |
|
|


