Robust Evidence NOAA Temperature Data Hopelessly Corrupted By Warming Bias, ManipulationBy Kenneth Richard on 30. January 2017
Dr. Thomas Karl recently retired as Director of the National Oceanic and Atmospheric Administration (NOAA).
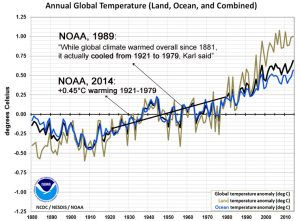
In 1989, Karl’s stated position was that global temperatures cooled between 1921 and 1979.
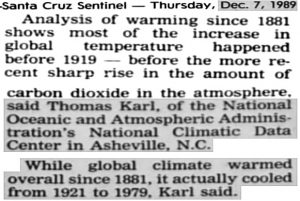
Source: RealClimateScience“Analysis of warming since 1881 shows most of the increase in global temperature happened before 1919 – before the more recent sharp rise in the amount of carbon dioxide in the atmosphere, said Thomas Karl of the National Oceanic and Atmospheric Administration’s National Climatic Data Center in Asheville, N.C. While global climate warmed overall since 1881, it actually cooled from 1921 to 1979, Karl said.”
Today, not only has the 1921-1979 cooling disappeared from NOAA’s official temperature record, it has been replaced by a +0.45°C warming trend during that nearly 60-year period.
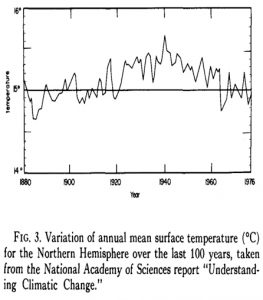
1. Early NOAA Graphs Confirm Strong Cooling Through The 1970s – Before It Was RemovedAs recently as the early 1980s, it was still widely accepted in the scientific community (National Academy of Sciences, hundreds of scientific papers) that the Northern Hemisphere had undergone a dramatic warming of nearly 1°C from about 1900 to 1940, and then, after the 1940s, the trend reversed to severe cooling, fomenting the 1970s global cooling scare.
Agee, 1980 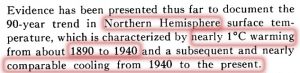
NOAA’s Karl had also supplied plenty of evidence to support the original (1989) position that a global cooling trend persisted through the late 1970s. Graphs appeared in his papers with strong warming trends through the 1920s and 1930s and then cooling trends from the 1940s to the 1970s. For example, the NOAA graph of U.S. annual temperatures showed the cooling trend from 1921-1979, and even indicated there had been no net warming in the U.S. in the 90 years between 1895 and 1985.
Karl, 1988U.S.A. (Annual Average) 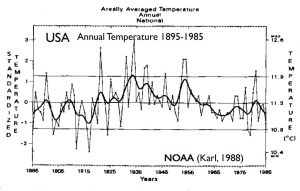
Compare the graph above to the one below. By starting their trend in 1901 rather than 1895 (as above from Karl, 1988), Karl and Jones (1989) could claim there was a net temperature increase of 0.16°C during the 20th century, or as of 1901-’84. All of the 84-year warming occurred prior to the 1940s, and it only warmed overall because the post-1940s cooling didn’t quite eclipse the pre-1940s warming when the trend line started six years later (1901 vs. 1895). The end point of the second trend (1984) is apparently 0.16°C warmer than where the first trend line began (1901).
Karl and Jones, 1989“Temperature trends indicate an increasing temperature from the turn of the century to the 1930s but a decrease thereafter.”
“Over the twentieth century (1901-84) … the overall temperature trend in the United States during this time period, +0.16°C/84 yr.”
U.S.A. (Annual Average) 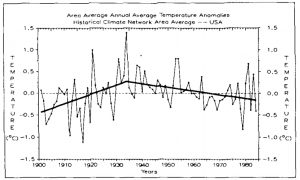
Eastern Australia 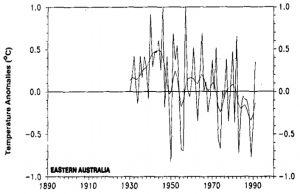
Japan 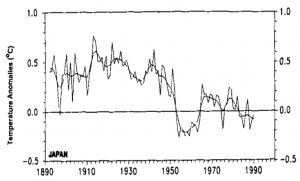
South Africa 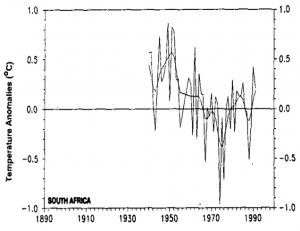
2. Case Example: NOAA Removes Strong Post-1940s Cooling Trend For Indiana (U.S.A.)Like the hemispheric trend, this dramatic warming and cooling trajectory was found in the temperature record for much of the United States — before it was removed. For example, Karl (NOAA) produced a graph showing there was a cooling of multiple degrees (°C) from the 1930s-1950s to the 1960s-1970s in central Indiana. In fact, highest to lowest yearly anomalies reached more than 10°C, a warming-cooling separation of 18°F between the 1931 anomalous warmth and the mid-1970s cooling .
Karl and Riebsame, 1984 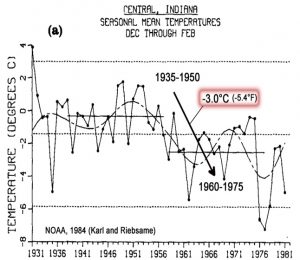
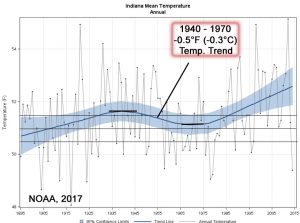
Today, NOAA has eliminated the multiple degrees of warming and cooling for Indiana, almost completely flattening out the earlier steep warming and cooling trends.
3. NOAA (1988, 1989): Artificial Heat From Urbanization Accounts For All 20th Century WarmingDuring the late 1980s and early 1990s, Karl was the lead author or co-author of several papers that affirmed urban temperature bias (locating temperature measuring stations near asphalt, buildings, airports, machinery, etc.) had compromised the U.S. temperature record and produced a substantial artificial warming. The artificial warming bias identified in the temperature record was found to be larger than the overall temperature trend itself. In other words, according to NOAA, all or nearly all the U.S. 20th century warming (through the mid-1980s) could be attributed to artificial (non-climatic) heating due to the effects of urbanization.
Karl and Quayle, 1988“Karl et al., 1988) has shown that at some ‘sun belt’ cities in the West, the rise of temperature that can be attributed to the urban heat island is as much as 0.3 to 0.4°C per decade. In the East, the rise is over 0.1°C per decade. … The artificial warming in the primary station network, relative to the climate division data, is nearly 0.17°C over the past 34 years [since ~1950]. Such trends are at least as large as any of the observed trends over the United States (Karl, 1988) or the globe (Jones and Wigley, 1987).”
Karl and Jones, 1989“Results indicate that in the United States the two global land-based temperature data sets have an urban bias between +0.1°C and +0.4°C over the twentieth century (1901-84). This bias is as large or larger than the overall temperature trend in the United States during this time period, +0.16°C/84 yr.”
At present, only rough estimates of the potential impacts of urbanization can be given. This includes an urban bias in the Hansen and Lebedeff (1987) [NASA] data over the United States between 0.3°C and 0.4°C over the 20th century, which is larger than the overall trend in the United States over this period. … To our knowledge, the United States is the only large area of the globe where the magnitude of this bias has been thoroughly studied.”
“The magnitude of this urban bias in two global, land-based data sets was found to be a substantial portion of the overall trend of global and regional temperatures.”
“Rapid increases in urbanization can lead to [warming] biases in the annual mean temperature at urban locations of over 1°C (Karl et al., 1988; Karl and Jones, 1989).”
Kukla, Gavin, and Karl, 1986“Meteorological stations located in an urban environment in North America warmed between 1941 and 1980, compared to the countryside, at an average rate of about 0.12°C per decade. Secular trends of surface air temperature computed predominantly from [urban] station data are likely to have a serious warm bias. … [W]e compared trends of the 34 urban/rural station pairs…urban stations show a warming with respect to the countryside throughout most of the year. The average annual difference of the trends is about +0.11°C per decade [of non-climatic warming due to urban location]. … The average difference between trends [urban siting vs. rural] amounts to an annual warming rate of 0.34°C/decade. Values from May through August averaged 0.44°C/decade while December showed the smallest difference. The reason why the warming rate in subset D is considerably higher [may be] that the rate may have increased after the 1950s, commensurate with the large recent growth in and around airports. … Our results and those of others show that the urban growth inhomogeneity is serious and must be taken into account when assessing the reliability of temperature records.”
4. NOAA (1989): Early Instrumental Records Have Up To 1°C Biases, Non-Uniform Calibration Standards Karl et al., 1989“Calibration errors are serious problems with early temperature records, some dating back to the seventeenth and 18th century. Early thermometers consisted of a U tube with one open end and required pressure corrections. Varying temperature measurement scales and instrument shelters were used. Readings from these instruments are often difficult to interpret. Temperature measurements over the last 100-140 years have been refined so that the accuracy and the precision of the measurement is at least [within] 0.5°C.”
“Changes in observing schedules and practices have been shown to produce biases in the mean temperature of up to 1°C (Bigelow, 1909; Schaal and Dale, 1977; Karl et al., 1986). Even today, there is not an international standard for the calculation of mean daily temperature, and archived data often include averages based on different formulae for calculating monthly means.”
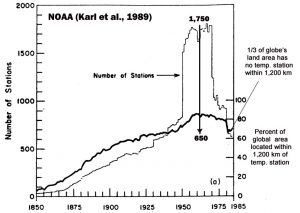
5. NOAA (1989): Poor Coverage In Our Land Data – 1/3rd Of Land Area Has No Thermometer Within 1,200 Kilometers Karl et al., 1989“[There was] a large increase in [temperature measuring] stations from the late nineteenth century to the 1960s and a subsequent decline after the 1960s.”
6. NOAA (1989): ‘Uncomfortable Level Of Uncertainty’ In Our Sea Temperature Data – Poor Coverage, Large Measurement Biases Karl et al., 1989“[T]here are large geographic areas of the oceans which have not been adequately sampled, and even today, only two thirds of the global oceans are sampled in NOAA’s Comprehensive Ocean-Atmosphere Data Set (COADS). The tropical areas of the Pacific Ocean have few observations until the 1950s, and oceanic regions poleward of 40°S (which account for 15% of the world surface area) have few observations available until recent decades. Even when observations are available for an individual grid box, there may be only one or two values for a given month, and adjustments may be required to convert the value to a midmonth or midarea equivalent. … [T]he poor spatial coverage in the tropical Pacific and southern oceans adds an uncomfortable level of uncertainty regarding long-term (50-100 years) changes of ocean temperatures.”
“For marine air temperatures, biases exist for a variety of reasons. Ships have become larger over the years, and the height of the deck above sea level has increased. As ships have become larger, their absorption of insolation has increased and caused a [warm] bias with respect to daytime observations of marine air temperature.”
“For sea surface temperature measurement, biases are known to be caused by changes in the vessel used to hold the seawater in which the temperature is measured.Wooden buckets, metal buckets, canvas buckets, and intake tubes for engine cooling have all been used to measure sea surface temperature since the midnineteenth century. … The magnitude of the warm bias [in measuring sea temperatures] obtained using the modeling approach is similar to that obtained by comparison with the nighttime marine air temperatures (several tenths of a degree Celsius). Differences among the types of buckets (for which the timing is uncertain) can translate into an uncorrected or uncorrectable bias of 0.1°C-0.2°C in the sea surface temperatures over the past century.”
“Oceanic measurements of sea temperature (i.e., data from research cruises) are … very poorly distributed for long-term global studies. … In summary, with so few long-term observations of temperature over the oceans, particularly in the southern hemisphere, and the differing measurement practices, global and hemispheric time series extending into the nineteenth century should be used circumspectly.”
7. NOAA (1989): Surface Temperatures Can Be Raised Artificially By Moving/Eliminating Stations From Rural Locations Karl et al., 1989“Changes in station location, instruments, instrument shelters, and the height of instruments above the ground have led to biases of 1°C or more at many stations (Karl and Williams, 1987).”
8. NOAA (2012): To Be Reliable (‘Fact’), NOAA Temperature Records Should Be ‘Same’ As Satellite RecordsPrior to the publication of his highly criticized 2015 paper that made the the nearly two-decade-long pause in global temperatures ‘disappear’ (by adjusting sea surface temperature data – cooling the past and warming the present), NOAA’s Karl was quoted saying (2012) that NOAA’s surface temperature trends should show the “same kind of a trend” as satellite temperatures do. The agreement between NOAA surface instrumental data and satellite data would indicate that the temperature trend is fact, and not an assertion (his word choices).
However, with the adjustments to the data, the satellite records do not show the “same kind of a trend” as the NASA (NOAA) records do:
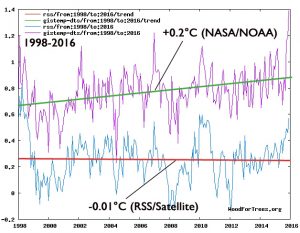
Source: WoodForTrees9. NOAA (1989): Comprehensive Coverage From Satellites ‘Striking’ – Will Likely Be Our Main Temperature Data SourceBack in 1989, NOAA’s Karl asserted that satellite data would soon be the “primary source” for climate change monitoring due to the “striking” coverage (85% of the Earth’s surface, observations every 30 minutes) satellites provide relative to the thermometric record. In fact, he concluded that the eventual “marriage” of land data from temperature stations with satellite data would make the overall temperature record much more reliable.
Karl et al., 1989“[S]pecial data sets from experiments and research projects are becoming available to climate researchers. Some special data sets are also available from research satellites (such as the NOAA satellites) are likely to be the primary source of long-term data for monitoring climate change. The operational satellite data record is now long enough to consider the statistical evaluation of changes of various climate variables.”
“Compared to ground-based data, the most striking characteristic of satellite data is its comprehensive geographic coverage. … Under normal circumstances, five geostationary satellites provide coverage for about 85% of the Earth’s surface. … The geostationary satellites make routine observations every 30 min and are capable of scanning limited latitude bands at shorter intervals.”
“The marriage of space-based satellite observations with traditional surface-based observations with traditional surface-based observations offers the potential to significantly reduce our uncertainties in the climate record.”
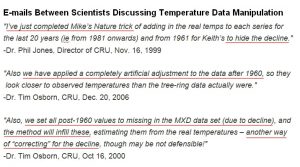
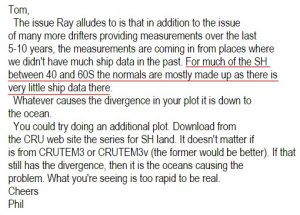
10. How They Do It: NOAA In-Fills Unmeasured Land (And Sea) Regions With Made-Up TemperaturesThe exposed “Climategate” e-mails from overseers of surface temperature data (for example, Phil Jones of the Climate Research Unit) have authentically established that there is a history of scientists making up data and “correcting” cooling temperatures (the “decline”) to satisfy an agenda. The e-mails reveal that scientists are not above artificially removing “the 1940s blip” (that showed too much warming to be compatible with models) or the post-1960s trend (cooling, the “decline”) and making up their own “raw” temperatures when they can. Here are a few sample excerpts from the purloined exchanges.
[ The blurbs below may be hard to read but they show Phil Jones, Tim Osburn, and Tom Wigley discussing adjusting temperature data to make it look like a chart they want. ]
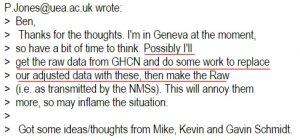  Because the temperature data coverage is so exiguous (i.e., Southern Hemisphere ocean temperatures are “mostly made up”), NOAA has to in-fill the vast non-measured land regions (that contain no thermometers) across the globe with their own numbers derived from modeling. Because the temperature data coverage is so exiguous (i.e., Southern Hemisphere ocean temperatures are “mostly made up”), NOAA has to in-fill the vast non-measured land regions (that contain no thermometers) across the globe with their own numbers derived from modeling.
And because modeling presumes that anthropogenic CO2 emissions drive temperatures, and emissions have exploded since the mid-1940s, there is a modeling bias to cool down the 1920s to 1940s warmth, heat up the 1940s to 1970s cooling trend, and exaggerate the most recent warming. This way, the overall trend will look more and more like the linear emissions post-1940s “hockey stick” trend, and less like the undulating pattern that was scientifically acceptable until the 1980s.
The land area with adequate temperature records available (containing both maximum and minimum uniform daily temperatures) is still woefully absent in regions such as Greenland, Antarctica, Africa, South America, Central America, and most of Asia, Canada, and Scandinavia. The only regions with good coverage are the U.S., Europe, Australia, and China. This doesn’t even include the dearth of coverage for the ocean surfaces, which is even worse.
In a NCDC/NOAA analysis by Peterson and Vose (1997), it was revealed that raw data with the uniform maximum/minimum daily temperatures available from the Global Historical Climatology Network have improved in the last century, but not enough to provide confidence in available global-scale records.
Peterson and Vose, 1997 (NCDC/NOAA) 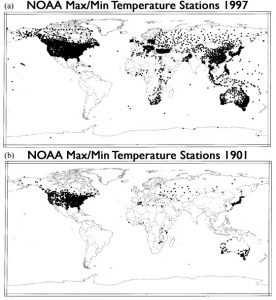
Indeed, NOAA’s lack of adequate observational land coverage – real temperature measurements – is illustrated below. The gray areas effectively contain no thermometric record, meaning the temperatures in those regions must be made up. Keep in mind that the red-blue colored squares used to represent real measurements tend to exaggerate the coverage, as the square sizes depict a larger range of coverage than actual.
ConclusionThe global temperature dataset available from NOAA suffers from massive and uncorrected warm biases (as preferred by its purveyors), woefully inadequate contemporary measurement coverage, and even worse historical coverage (with inherently non-uniform data collection methodologies). Consequently, a substantial portion of the temperature data available from NOAA should be regarded as artificial and untrustworthy. Those who faithfully uphold NOAA’s global temperature dataset as “truth” will need to address its demonstrable speciousness – and why they are inclined to believe in it anyway.
- See more at: notrickszone.com
|
|


