N ew Paper: Glacier Melt Rates Were Up To 3 Times Greater, Faster During Early 20th Century
By Kenneth Richard on 9. February 2017
75% Of Total Modern Glacier Melt Occurred Before 1950
“[T]he retreat of the glaciers after about 1925 became rapid. It was almost entirely during the [pre-1950] twentieth century warming that the Alpine glaciers disappeared from the valley floors up into the mountains. Similarly great retreats occurred in Scandinavia, Iceland, Greenland, in the Americas, and on high mountains near the equator.” — H.H. Lamb Climate, History, and the Modern World (1982), pg. 248A new scientific paper indicates that the pronounced warming that occurred during the years stretching from the 1920s to the 1940s melted Northern Iceland glaciers much more extensively and at a far more rapid pace than has been observed in recent decades.
During the 1960s to 1980s, glacier melt rates not only decelerated relative to the 1920s to 1940s, the ice actually advanced in some cases due to decades of cooling. It has only been since about the mid-1990s that glaciers have consistently begun melting again — but with far less alacrity than they did in the first half of the 20th century.
Fernández-Fernández and co-authors (2017) indicate that the Icelandic glaciers they studied melted by more than 1,000 meters (1,062) on average between the late 1800s and 1946. But from 1947 to 2005, these same glaciers only retreated by an average of 272 meters more. In other words, about 75% of the total glacier melt production since the end of the Little Ice Age (the late 19th century) occurred prior to the mid-1940s.
Below are some key points and graphs from the paper.
Fernández-Fernández et al., 2017Summary:“The abrupt climatic transition of the early 20th century and the 25-year warm period 1925–1950 triggered the main retreat and volume loss of these glaciers since the end of the ‘Little Ice Age’. Meanwhile, cooling during the 1960s, 1970s and 1980s altered the trend, with advances of the glacier snouts. Stötter et al. (1999) indicate that the coldest period after the LIA was from the early 1960s to the mid-1970s, when temperatures fell to levels equivalent to the warmest recorded in the 19th century. This cooling is the reason given by Caseldine (1983, 1985a, 1985b, 1988) to explain the advance of the Gljúfurárjökull between the mid-1970s and the mid-1980s … Studies of aerial photographs and satellite images show that the glacier snouts have retreated by more than 1300 m on average since the LIA maximum (considered to be AD 1898 in Gljúfurárjökull and AD 1868 in both Western and Eastern Tungnahryggsjökull), with an altitudinal rise of more than 100 m. The retreat accelerated rapidly (15.3 m yr-1) during the first half of the 20th century. In the second half of the 20th century, the retreat decelerated considerably, reflected in the lowest values around 1985 (5.2 m yr-1) and a trend shift in 1994, with an advance observed in Gljúfurárjökull. … The retreat rate intensified in the period 2000–2005 compared with 1994–2000, but did not reach the rates recorded before 1946.”Gljúfurárjökull, West Tungnahryggsjökull, and East Tungnahryggsjökull Glaciers:1. During the period 1898–1946, the snout of Gljúfurárjökull retreated 635 m, almost two-thirds of the total distance from the LIA maximum (1898–1903) to 2005, at an average rate of 13.2 m yr-1.2. The trend in Western Tungnahryggsjökull during the first half of the 20th century was a more rapid retreat, showing the highest average rates of the whole period (19.5 m yr-1). By 1946, this glacier had retreated almost 90% of the total recorded between the LIA maximum (1868) and 2005.3. Just as in the glaciers described above, the retreat of the Eastern Tungnahryggsjökull from its LIA position was more intense during the first half of the 20th century, and in 1946 its snout was only 200 m from its current position. … The 2000 aerial photograph shows that an advance of at least 41 m had taken place since 1985. Nevertheless, between 2000 and 2005, the snout retreated 17 m, even more slowly than Western Tungnahryggsjökull. 
No Net Warming In North Iceland Since 1920s-1940s 
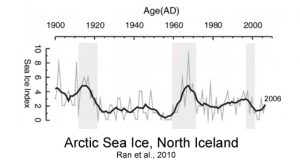
Similar Or Less North Iceland (Arctic) Sea Ice During 1920s-1950s Ran et al., 2010
Holocene Icelandic Climate 4-5°C Warmer, Changing 2-3°C Per Century Andersen et al., 2004 “Our results show that the Nordic Seas circulation system is highly sensitive to the large-scale insolation [surface solar radiation] changes as the general Holocene climate development follows closely the Northern Hemisphere insolation. … Century-scale surface current variability for the Holocene is shown to be 1 – 1.5°C for the Vøring Plateau and East Greenland shelf, and 2.5– 3°C on the North Ice-land shelf. … The first cooling [East Greenland Shelf SSTs] from 2400 to 2000 cal years BP was introduced by a 1.5°C temperature drop starting at 3000 cal years BP which culminated in an SST low around 2100 cal years BP. The second cooling occurred around 300 cal years BP and preceded a rapid warming [during the 1700s A.D.], where SSTs rose with more than 1.5°C within 70 years. The third cooling took place in the second half of the last century. Until the last three centuries, SST variability at this site has been 1°C, while SSTs varied with amplitudes of 1.5– 2°C during the last 300 years.” 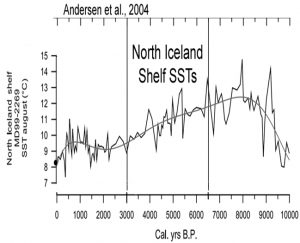
Not Just Iceland: Global Glacier Melt Rates More Rapid, Pronounced 1920s-1950s Gregory et al., 2013 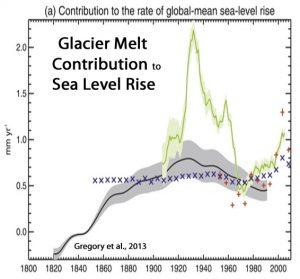
Globally, glaciers melted 69% more rapidly from 1921-1960 (12.5 meters/year) than from 1961-2000 (7.4 meters/year).
Leclercq et al., 2014 A data set of worldwide glacier length fluctuations“The data set contains the glacier length records for 471 [global] glaciers and it covers the period 1535–2011. There are glacier length records from all continents and at almost all latitudes. For the observed glaciers, the 20th century retreat was strongest in the first half of the 20th century.”“[T]he retreat is strongest in the period 1921–1960 rather than in the last period 1961–2000, with a median retreat rate of 12.5 m yr in 1921–1960 and 7.4 m yr in the period 1961–2000.”A Significant Non-Correlation Between CO2 Emissions And Glacier MeltAdvocates of the position that humans exert a profound and dangerous influence on the Earth’s temperatures, glacier melt, sea level rise, extreme weather patterns . . . point to the rapid increase in human CO2 emissions (purple trend line) as the condemnable culprit.
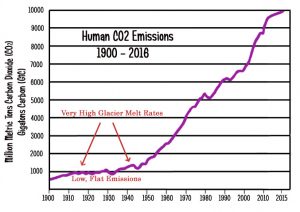
But consider that the trend in anthropogenic CO2 emissions was essentially flat and very low (averaging just 1 gigaton of carbon [GtC] per year) from about 1900 to 1945, when most modern glacier recession occurred. Also consider that explosive growth in human emissions occurred after 1945, when a significant deceleration in glacier melt (and even decades of advancing glaciers) occurred. This historical evidence would not appear to support the position that anthropogenic CO2 emissions drive warming, glacier melt, and sea level rise.
- See more at: notrickszone.com |


