Almost half of GHCN stations at airports as of 2009. It was about 30% in the 1970's. Number of GHCN stations down by 75% since the 1970's too. Rural, high altitude stations disproportionately eliminated. Mann-made global warming.
More Data Manipulation By NOAA, NASA, HadCRUT…Cooling The Past, Warming the Present
By Kenneth Richard on 13. February 2017
Global Temperature Data Manipulation Thousands Of Non-Urban Thermometers Removed 0.3°C Of Pause-Busting Warmth Added Since 1998 0.5°C Of Warming Removed From 1880-1950 Trend Over the course of the last few decades, overseers of the 3 main 19th century-to-present global temperature data sets — NOAA, NASA, and HadCRUT — have been successfully transforming the temperature record to the shape dictated by climate models. Namely, there has been a concerted effort to cool down the past — especially the 1920s to 1940s warm period — and to warm up the more recent decades, especially after about 1950. In this way, a trend of steep linear warming emerges that looks similar to the linear shape of anthropogenic CO2 emissions for the 20th and 21st centuries. A better fit between anthropogenic CO2 emissions and surface temperature helps to imply causation, and this ostensible correlation-turned-causation can then be used to justify policy decisions aimed at eliminating fossil fuel energies.
75% Of GHCN Temperature Stations Removed Since 1970s One of the most unheralded means by which this temperature “shaping” occurs has been the tendentious and wholesale removal of thousands of weather station land thermometers from remote, high altitude, and/or non-urban locations since the 1970s. These are stations which do not show the warming trends predicted by models, as they are not affected by proximity to artificial or non-climatic heat sources (pavements, buildings, machinery, industry, etc.) like urban weather stations are. (As detailed below, locating thermometers near urban heat sources can cause warming biases of between 0.1 and 0.4°C per decade.)
If a highly disproportionate number of non-urban weather stations are removed from the global temperature archive, the urban-based thermometers will be weighted much more heavily than they were before the non-urban stations were removed. And therefore, the temperature record will show (much) more warming — even though the additional warmth is not climatic, but artificial.
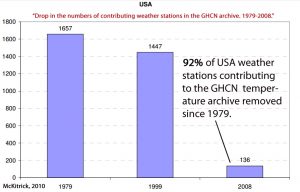
And this is exactly what has happened. The Global Historical Climatology Network, or GHCN, is the primary source for temperature data records from all over the world. NOAA, NASA, and HadCRUT heavily rely on GHCN for temperature histories in constructing their global data sets dating back to the 1800s. According to McKitrick (2010), there were still between 5,000 and 6,000 weather stations across the globe contributing to the GHCN temperature archive as recently as the 1970s. Today (or as of 2009), there are only a little over 1,000 left — 75% of the thermometers used in the 1970s have disappeared. There are now fewer weather stations contributing to the GHCN than there were in 1919.
Astonishingly, as many as half (49% as of 2009) of the weather stations across the globe used by the GHCN are now located on the (paved) grounds of airports.
McKitrick, 2010“There are three main global temperature histories: the combined CRU-Hadley record (HADCRU), the NASA-GISS (GISTEMP) record, and the NOAA record. All three global averages depend on the same underlying land data archive, the Global Historical Climatology Network (GHCN). Because of this reliance on GHCN, its quality deficiencies will constrain the quality of all derived products.”“The number of weather stations providing data to GHCN plunged in 1990 and again in 2005. The sample size has fallen by over 75% from its peak in the early 1970s, and is now smaller than at any time since 1919.” 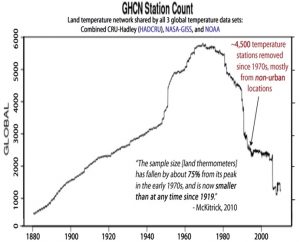
Growing bias toward airport sources“The collapse in sample size has increased the relative fraction of data coming from airports to about 50 percent (up from about 30 percent in the 1970s). … The change in the sample was not uniform with respect to source type. For instance it has biased the sample towards airport locations. GHCN had already been heavily-weighted towards airports, which, for many reasons, are not suitable for climatic monitoring. A problem with airports is that they are often in urban or suburban locations that have been built up in the past few decades, and the increase in global air travel has led to increased traffic, pavement, buildings and waste heat, all of which are difficult to remove from the temperature record. … [A]t the global level, as of 2009 49% of all GHCN data came from airports (46% NH, 59% SH), up from just over 20 percent in the late 1920s.” — McKitrick, 2010 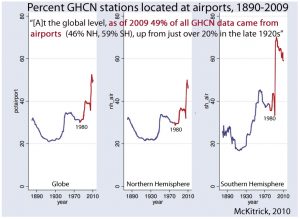
NOAA’s Tom Karl Was Once Concerned About Urban/Airport Warm BiasDuring the late 1980s, the warm bias of 0.1°C to 0.4°C per decade attributed to the urban (or airport) siting of temperature stations was thought to severely compromise the global temperature data sets, with “a substantial portion of the overall trend of global and regional temperatures” directly reflecting this warm bias. The “artificial warming in the primary station network” never went away. But it is now just ignored.
Karl and Quayle, 1988“Karl et al., 1988) has shown that at some ‘sun belt’ cities in the West, the rise of temperature that can be attributed to the urban heat island is as much as 0.3 to 0.4°C per decade. In the East, the rise is over 0.1°C per decade. … The artificial warming in the primary station network, relative to the climate division data, is nearly 0.17°C over the past 34 years [since ~1950]. Such trends are at least as large as any of the observed trends over the United States (Karl, 1988) or the globe (Jones and Wigley, 1987).” Karl and Jones, 1989“Results indicate that in the United States the two global land-based temperature data sets have an urban bias between +0.1°C and +0.4°C over the twentieth century (1901-84). … At present, only rough estimates of the potential impacts of urbanization can be given. This includes an urban bias in the Hansen and Lebedeff (1987) [NASA] data over the United States between 0.3°C and 0.4°C over the 20th century, which is larger than the overall trend in the United States over this period. … To our knowledge, the United States is the only large area of the globe where the magnitude of this bias has been thoroughly studied.”“The magnitude of this urban bias in two global, land-based data sets was found to be a substantial portion of the overall trend of global and regional temperatures.” Kukla, Gavin, and Karl, 1986“Meteorological stations located in an urban environment in North America warmed between 1941 and 1980, compared to the countryside [cooling], at an average rate of about 0.12°C per decade. Secular trends of surface air temperature computed predominantly from [urban] station data are likely to have a serious warm bias. … [W]e compared trends of the 34 urban/rural station pairs…urban stations show a warming with respect to the countryside throughout most of the year. The average annual difference of the trends is about +0.11°C per decade [of non-climatic warming due to urban location]. … The average difference between trends [urban siting vs. rural] amounts to an annual warming rate of 0.34°C/decade. … The reason why the warming rate in subset D is considerably higher [may be] that the rate may have increased after the 1950s, commensurate with the large recent growth in and around airports. … Our results and those of others show that the urban growth inhomogeneity is serious and must be taken into account when assessing the reliability of temperature records.”Growing bias toward lowland sites“The steady increase [in the mean altitude of temperature stations above sea level until the 1980s] is consistent with a move inland of the network coverage, and also increased sampling in mountainous locations. The sample collapse in 1990 is clearly visible as a drop not only in numbers but also in altitude, implying the remote high-altitude sites tended to be lost in favour of sites in valley and coastal [urban] locations. This happened a second time in 2005. Since low-altitude sites tend to be more influenced by agriculture, urbanization and other land surface modification, the failure to maintain consistent altitude of the sample detracts from its statistical continuity. … GHCN has progressively lost more and more high latitude sites (e.g. towards the poles) in favour of lower-latitude sites. Other things being equal, this implies less and less data are drawn from remote, cold regions and more from inhabited, warmer regions.” — McKitrick, 2010 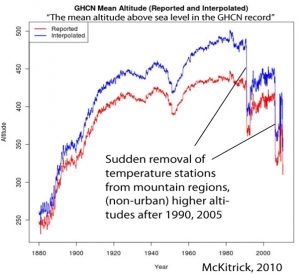
The Results: Artificial Land Warming Since 1980 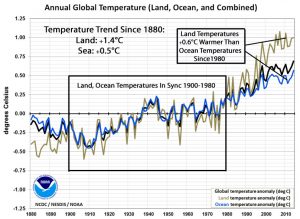
NOAA Global Land vs. Sea 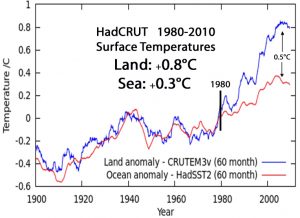
HadCRUT Land vs. Ocean Temperature AnomaliesNOAA Adds +0.3°C Of Warming (Relative To Satellites) Since 1998Earlier this month, the Karl et al. (2015) “pause-buster” paper was once again subjected to significant criticism by another former NOAA scientist (Tom Karl was NOAA’s Director during 2015) due to allegations there were political motivations to rush the paper to press before the (December) 2015 Paris Climate Change Conference without requisite quality checks. The motivation was obvious: If the inconvenient pause in global warming reported by the IPCC in 2013 could be eliminated, it would be a significant development that might encourage government leaders to pledge to reduce CO2 emissions. Unfortunately, the original temperature data used to compute the new trend (“ For 1998–2014, our new global trend is 0.106± 0.058°C dec-1“) in the NOAA publication has been “lost” on a faulty computer that had undergone a “ complete failure,” leaving little chance for independent replication or verification.
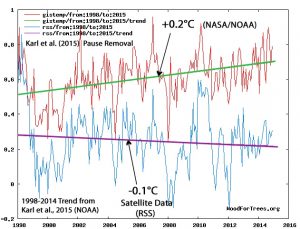
Since then, the New York Times has issued a defense of the NOAA controversy by claiming that the 1998-2014 trend used in the Karl et al. (2015) paper has been independently verified by other scientists, as well as by satellite data, to show that the +0.11°C per decade trend (+0.2°C overall) between 1998-2014 was consistent across all data sets.
This claim is false, of course. Using the raw data available and the WoodForTrees interactive tool, we see that the trend discrepancy for the period under consideration (1998-2014) in the Karl paper is nearly 0.3°C when comparing the recently created NOAA trend to satellites (RSS). There is as much as a 0.5°C difference between the NOAA/NASA GIS and RSS trend line end points (December, 2014). The -0.1°C cooling that emerges in the satellite data has been transformed into a +0.2°C warming by Karl et al. (2015). Almost immediately after its publication, the new warming trend for 1998-2014 was accepted by NASA and HadCRUT as well, allowing all three long-term data sets to now show significant warming when there had previously been a pause, even cooling.
Source: WoodForTreesHadCRUT Erases 1998-2012 Slight Cooling Trend By Changing VersionsChanging unpalatable temperature trends in time for an event of intergovernmental and public policy significance has happened before.
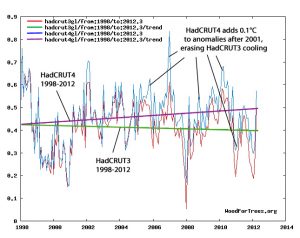
The combined Hadley Centre and Climatic Research Unit (HadCRUT) data set — which is featured in the Intergovernmental Panel on Climate Change (IPCC) reports — underwent a revision from version 3 to version 4 in March of 2012. This was about a year before the latest IPCC report was to be released (2013). At the time (early 2012), it was quite inconvenient to the paradigm that HadCRUT3 was highlighting a slight global cooling trend between 1998 and 2012, as shown in the graph below (using HadCRUT3 and HadCRUT4 raw data from WoodForTrees).
Graphs used by the IPCC depicting a slight cooling trend since 1998 would not be acceptable to policymakers wishing to emphasize the urgency of addressing dangerous global warming. So, just in time for the 2013 edition of the IPCC report, about 0.1°C was added to the 1998-2012 HadCRUT trend. The effect was to transform the slight cooling into what the IPCC called a “hiatus” from warming. To achieve the removal of the slight cooling trend found in HadCRUT3, the more recent anomalies in HadCRUT4 were warmed up (by 0.1 to 0.2°C), whereas the past warmth (especially around 1998) was left intact. The effect was to warm the present and cool the past.
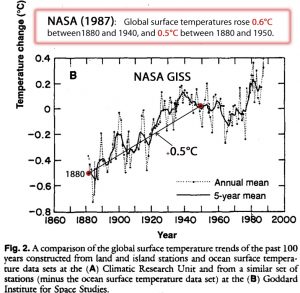
Source: WoodForTreesIPCC (2013) analysis of the 1998-2012 “hiatus” from warming:“For the period 1998–2012, 111 of the 114 climate-model simulations show a surface-warming trend larger than the observations.”“During the 15-year period beginning in 1998, the ensemble of HadCRUT4 GMST trends lies below almost all model-simulated trends.”“Almost all CMIP5 historical simulations do not reproduce the observed recent warming hiatus.”NASA Has Removed Almost 0.5°C From 1880-1950 Warming Since The 1990sAs recently as 1990, it was widely accepted that the global temperature trend, as reported by NASA (Hansen and Lebedeff, 1987), showed a “0.5°C rise between 1880 and 1950.”
Pirazzoli, 1990
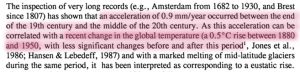
This 0.5°C rise in global temperatures between 1880-1950 (and 0.6°C between 1880 and 1940) can clearly be seen in the NASA GISS graph from 1987:
Schneider, S. H. 1989. The greenhouse effect: Science and policy. Science 243: 771-81.Today, it is no longer acceptable for the HadCRUT, NASA, and NOAA global temperature data sets to graphically depict a strong warming trend during the first half of the 20th century. This is because anthropogenic CO2 emissions were flat and negligible relative to today during this abrupt warming period, as shown here:
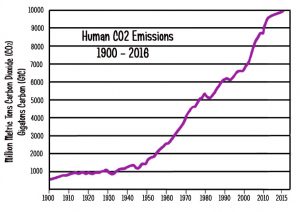
So as to eliminate the inconvenience of a non-anthropogenic warming trend in modern times, NASA and NOAA have removed all or nearly all the 0.5°C of warming between 1880 and 1950. If past raw temperature data do not fit the narrative that human CO2 emissions drive climate change, the raw data must be changed. In this way, the paradigm is kept alive.
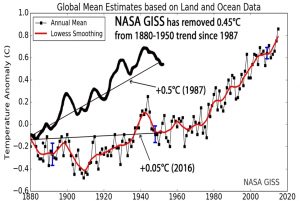
NASA GISS graph 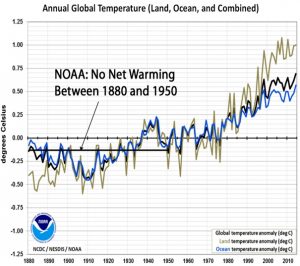
- See more at: http://notrickszone.com/#sthash.uuSbHNA5.dpuf |


