Hi Don, VIX Historical pricing and term structure charts site (interactive) and to give one specific possibility as to why you may have seen the movement of the past few days... look at the volume and price movement in the volatility ETF's including VXX, UVXY, and TVIX -- They have to use futures to hedge their ETF exposure.
vixcentral.com
has an area of historical price where you can put in a single day or show multiple days on a single chart
this chart is the VIX term structure from Oct 13th - 18 of 2008 ... the front month was very high at the time.
and for good reason.... a good sized financial panic ( that is also the area it defaults to... Oct 18th I believe.... it's probably a worthwhile exercise to reflect on how the markets were performing at that time.

you can also explore day by day the front 2 months of the VIX compared to month 4 through 7 ( right now that should be Aug - Nov)... with May being the nearby month.

You can also click at a spot and zoom from in this case Dec 2012 to July 2013 as that was a period where you had lots of movement between the front months and deferred months....

---------------------------------------------
The Cost of Contango—It’s Not the Daily RollUpdated: Apr 12th, 2017 | Vance Harwood | @6_Figure_Invest
It’s well known that long volatility Exchange Traded Products (ETPs) like VXX, UVXY, and TVIX often experience devastating losses during market quiet spells—even when the value of the VIX is staying relatively stable. These heavy losses occur when the VIX futures that underlie these funds are in a price/time arrangement called contango. The chart below shows an example of VIX futures in a contango configuration.
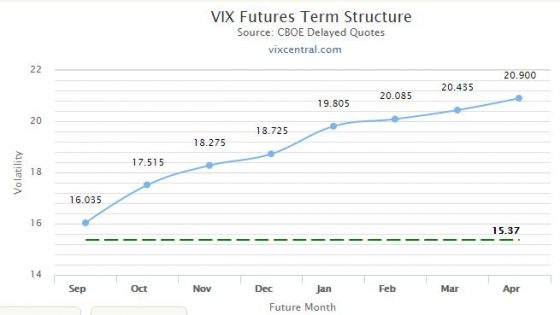
The blue dots show the prices of various futures and the horizontal scale indicates the month of expiration. The horizontal green line shows the current VIX price— also known as the “spot” price. You can’t tell it from the chart, but in this example the leftmost future has 4 days until expiration. At expiration, a VIX future’s value will be very close to the VIX spot price.
When futures are in contango the longer the future has until expiration the higher its price.
If you were to take a time lapse video of this chart over time with a stable VIX you would see the blue dots moving down the blue line, eventually intersecting with the green VIX line at expiration.
Volatility Exchange Traded Funds Roll Futures
In contrast to VIX futures contracts, volatility ETPs don’t expire; instead, they hold a mix of VIX futures (the two leftmost ones for VXX, UVXY, and TVIX) that’s adjusted every day in order to keep the average time to expiration of the portfolio at 30 days. In this daily transaction some of the leftmost, next to expire futures (I’ll call them M1), are sold and longer dated futures (M2) are purchased. In futures parlance, this is called a “roll.” When the M1 futures expire all the M2 futures become M1 and the roll process starts selling the futures with that expiration date rather than accumulating them.
When the futures are in contango it’s bad news for the price of the ETP’s holding them. They are buying futures when they are higher on the curve, at a more expensive price, and selling them when they have decayed to a lower price. Buying high and selling low—not a profitable practice.
The Daily Roll Does Not Reduce the ETP’s Value
There’s a widespread misconception that the roll process itself is the cause of the ETP price erosion—after all, you are buying high and selling low. But the roll is not the reason the ETP price erodes.
Saying that the roll is the cause is equivalent to saying that selling your old, depreciated car to the dealer and buying a new one is the reason your car dropped in value. Of course, everyone knows that your car dropped in value as it aged, and this is also the case for VIX futures in contango. The transactions just shift the depreciation process to a different vehicle.
You might think this is a harmless misunderstanding, and in the grand scheme of things it is trivial, but that doesn’t mean it can’t leave a trail of confusion in its path.
For example, what happens if M1 and M2 stay stable at 17.6 and 18.45 for a couple of days? If the roll causes decay then we would expect the price of VXX to drop as it sells M1 contracts and buys more expensive M2 contracts—but it doesn’t, as the detailed example later in this post shows.
I used to accept the daily roll explanation for the decay of the long volatility ETPs, but once I did the math it didn’t add up. The reality is that when the VIX futures are in contango both M1 and M2 tend to drop down towards the VIX price over time. Given that, it’s not surprising that the long volatility funds that hold these futures tend to drop in price. The next section shows analytically that the daily roll has nothing to do with the decline—it’s a value-neutral operation.
A Detailed Analysis of VXX’s Cost of Contango
A few years ago I developed a consolidated spreadsheet to organize historic VIX futures data from the CBOE into a single spreadsheet. Using this spreadsheet I calculated the short ( SPVXSTR) and medium term ( SPVXMTR) rolling indexes that underlie the various volatility Exchange Traded Products (ETP) like VXX, UVXY, XIV, and ZIV. The image below shows a small sample comparing my calculations (M1-M2 Short Term Rolling Index) with the official value of the short term index.
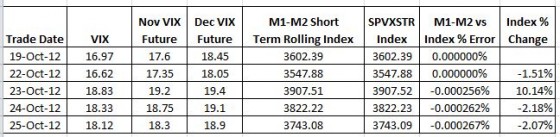
The percentage differences between my index and the official index (e.g., -0.000256%) aren’t cumulative and are probably due to rounding.
Once I verified my index calculations I wanted to look at the nemesis of the long volatility funds like VXX and UVXY—yield losses. These losses, which can be 5% to 10% per month, occur when the CBOE S&P 500 Volatility Index (VIX) Futures that underlie these ETPs are more expensive than the market, or “spot” price.
I wanted to quantify this loss with my spreadsheet without the noise of everyday volatility moves, so I left the term structure in contango but held the futures prices constant in my spreadsheet from day to day as an experiment. The results were surprising.
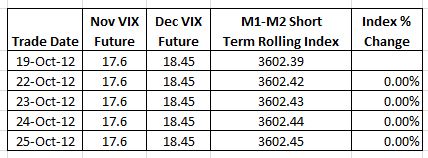
My calculations showed no daily roll costs in the index. The 0.01 upticks in the index are due to Treasury bill interest. Of course having the futures fixed like this is not a realistic situation—as futures near expiration they usually move closer to the spot price. But the example proves that the specific roll mechanism specified by the index and followed by ETF issuers does not decrease the value of the index on a day to day basis.
The usual explanation for roll costs, discredited in the sample above, asserts that losses are incurred when funds sell cheaper shorter term contracts and buy more expensive longer term contracts every day as specified by the indexes they follow—a sell low, buy high situation. A closer look illustrates the flaw in this explanation. Suppose you have a $10 million position after market close on 19-Oct-12— after the contract rolls. Fractional contracts aren’t supported, so the unused money goes in the cash bucket.
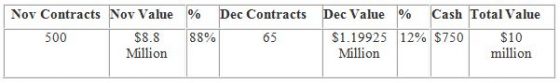
The next table shows the positions at the end of the next day, neglecting transaction costs and interest, and assuming no change in the futures values.
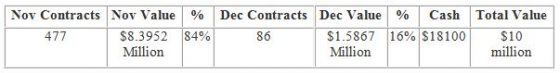
The number of contracts changes, but the total value doesn’t.
There’s no doubt that these indexes lose money when the VIX Futures term structure is in contango—so where do the losses come from?
The chart below shows the real root cause:

Plotting the actual 2012 November and December VIX futures values during a period of contango vs the CBOE’s VIX®, we see that both contracts decline in value over time, eventually converging with the “spot” VIX price at their expiration. With both sets of contracts held by the long volatility funds generally declining it’s not surprising the overall value drops. Since we are typically looking at term structures over the span of multiple months, the small daily “slide” down the curve isn’t noticeable—especially when obscured by the up and down moves in volatility driven by daily stock market fluctuations.
This analysis also explains why the mid-term volatility index SPVXMTR which holds contracts that are 4 to 7 months out also declines in contango situations, even though 2/3rds of the contracts (M5 & M6) aren’t rolled on a day to day basis.
Volatility Futures aren’t always in contango. If the markets are panicky enough the futures contracts get less expense than the VIX index. The chart below from VIX Central shows the June 10, 2010 situation when the VIX index closed at 36.57.
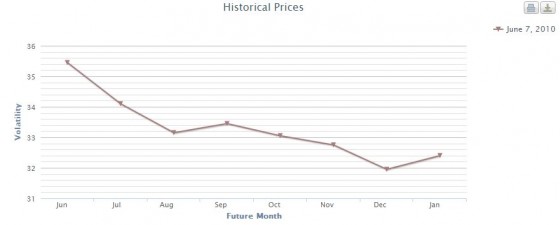
In this configuration, called backwardation, the long volatility funds have the wind at their backs, every day the futures they hold are sliding up the curve, getting closer to the spot price.
Knowing the real reason for term structure based losses / gains hasn’t changed my volatility investment strategy, but it has removed one source of confusion in understanding the daily moves.
Related Posts The Volatility Term Structure is Driven by OTM Puts A 3D View of the S&P 500: Price, Time, and Markets 10 Questions about Mid-Term Volatility The Volatility Watcher’s Toolkit Sometimes Inverse / Leveraged Volatility Funds Outperform Their Leverage Factors
sixfigureinvesting.com
--------------------
if you start doing google searches on VIX contango and VIX term structure and searches on the ETF volatility products ... a lot of info comes up.....
the data is NOT for the Futures only goes back to 2006 so it's not 20 years for the futures
VIX
From Wikipedia, the free encyclopedia
For other uses, see Vix (disambiguation).

CBOE Volatility Index (VIX) 1985–2012.
VIX is the ticker symbol for the CBOE Volatility Index, a popular measure of the implied volatility of S&P 500 index options, calculated and published by the Chicago Board Options Exchange (CBOE). It is colloquially referred to as the fear index or the fear gauge.
The formulation of a volatility index, and financial instruments based on such an index, were developed by Menachem Brenner and Dan Galai in 1986 and described in two academic papers. [1] [2] The authors stated the "volatility index, to be named Sigma Index, would be updated frequently and used as the underlying asset for futures and options. ... A volatility index would play the same role as the market index play for options and futures on the index."
The VIX concept formulates a theoretical expectation of stock market volatility in the near future. The current VIX index value quotes the expected annualized change in the S&P 500 index over the next 30 days, as computed from the options-based theory and current options-market data. [3]
The CBOE retained consultant Robert Whaley in 1992 to develop a tradable stock market volatility index based on index option prices. [4] Since 1993, CBOE has published VIX real-time data. Based on the history of index option prices, Whaley then computed a data series of retrospective daily VIX levels from January 1986 onward.
Specifications[ edit]The VIX is calculated and disseminated in real-time by the Chicago Board Options Exchange. Theoretically it is a weighted blend of prices for a range of options on the S&P 500 index. On March 26, 2004, the first-ever trading in futures on the VIX began on CBOE Futures Exchange (CFE). As of February 24, 2006, it became possible to trade VIX options contracts. Several exchange-traded funds seek to track its performance. The formula uses a kernel-smoothed estimator that takes as inputs the current market prices for all out-of-the-money calls and puts for the front month and second month expirations. [5] The goal is to estimate the implied volatility of the S&P 500 index over the next 30 days.
The VIX is calculated as the square root of the par variance swap rate for a 30-day term[ clarify] initiated today. Note that the VIX is the volatility of a variance swap and not that of a volatility swap (volatility being the square root of variance, or standard deviation). A variance swap can be perfectly statically replicated through vanilla puts and calls whereas a volatility swap requires dynamic hedging. The VIX is the square root of the risk-neutral expectation of the S&P 500 variance over the next 30 calendar days. The VIX is quoted as an annualized standard deviation.
The VIX has replaced the older VXO as the preferred volatility index used by the media. VXO was a measure of implied volatility calculated using 30-day S&P 100 index at-the-money options.
Statistician Salil Mehta of Statistical Ideas shows the distribution of the VIX. [6]
John |


